WMX Williams Fractals strategy V4There are some magic numbers out there! Guys, Check this out!
if you like it please support me with a like or leave your comments below
ابحث في النصوص البرمجية عن "williams"

Normailzed CandleThis indicator normalizes Day's candle with Open. Idea is to see the daily movement in the context of the Open of the Day.
Larry Williams talks about Open being the most important price of the day. Hence, this indicator.
The Green line is average Open-to-High for occurrences of Red days. The Red line is average Open-to-Low for occurrences of Green days.
Average are not perfect calculations since occurrences(of Red or Green) will vary within the time-span used for averages.
These can used to gauge likelihood of the intra-day price reversal. If the price exceeds green/red line, there is higher likelihood of the price closing above/below open.
The blue lines are average Open-to-close for Green and Red occurrences.
Be careful on days where consecutive 3rd Highest High or Lowest Low day is made and also on the next day after such day. Prices may turn direction at least for a short while.
The precursor to this script of the Candle Infopanel script. That script was just numbers in panel and this is a graphical representation. I
Some of the calculations from original script are commented here because it would make visuals clutters (and probably the left-out calculation are not critical to making trade decisions!)

Experimental Entry Interface (Buy Arrows with TP & SL)This script provides high probability entry points and includes Take Profit and Stop Loss targets.
It attempts to predict when the market conditions are set to move up, and prints long positions.
In addition to Long Entry Arrows, it will print Take Profit / Stop Loss targets.
This indicator is highly adjustable. Hence the name 'Experimental' in the title. Experiment with it to find the results you want.
Designed for use on the 1H timeframe in Forex, but could possibly be useful elsewhere. Do your own testing.
This indicator can repaint. It is best used with alerts set for once per bar close, so that your alerts do not repaint and your trades are solid.
Not ever signal is a winner. Backtest thoroughly. Adjust accordingly.
Arrows
Four sets of colored arrows are included.
💵 💶 Green and Blue Entry Arrows are formed when the market is in an uptrend, and has a momentary pullback.
💴 💷 Yellow and Purple Entry Arrows are formed when the market is just starting to recover from being severely oversold.
Backtest Mode
Turn on Backtest Mode to easily see if an entry ended up as a winner or loser. A Take Profit and Stop Loss line will be drawn to show results.
Take Profit & Stop Loss Targets
You have two options for this.
Price will show you where your TP/SL exits should be placed. These values will show up under the arrow, based on your Risk/Reward ratio.
Pips are much more simple, and will only show you the market entry point and how many pips up/down to place your SL/TP. Warning: This is fixed at a 1:1 RRR .
Risk/Reward Adjustment
Each entry arrow color allows custom risk/reward ratio adjustment.
Dollar Amounts Displayed
Change your account value and leverage to see how much you would have won on each trade.
How to trade with it?
(Forex, 1H) Open the settings, and turn on all the arrow entries. Turn on Backtest mode to see how past trades would have played out. Turn on TakeProfit/StopLoss Targets to see where to set your targets, for each arrow. Set an alert to notify you once per candle close when there is an Entry. Trade happy!
Bill Williams Alligators are also included, if you want. Not necessary though. Some of the calculations depend on them for trend direction analysis.

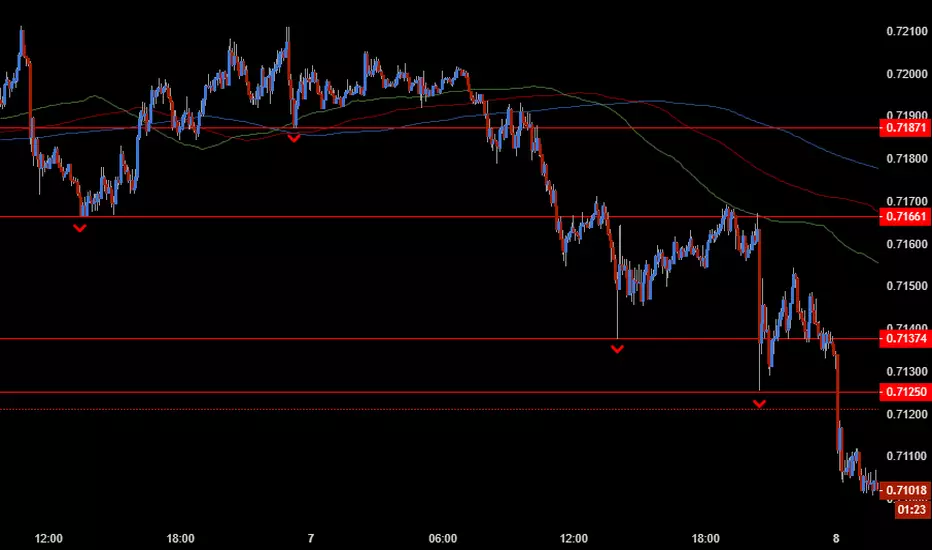
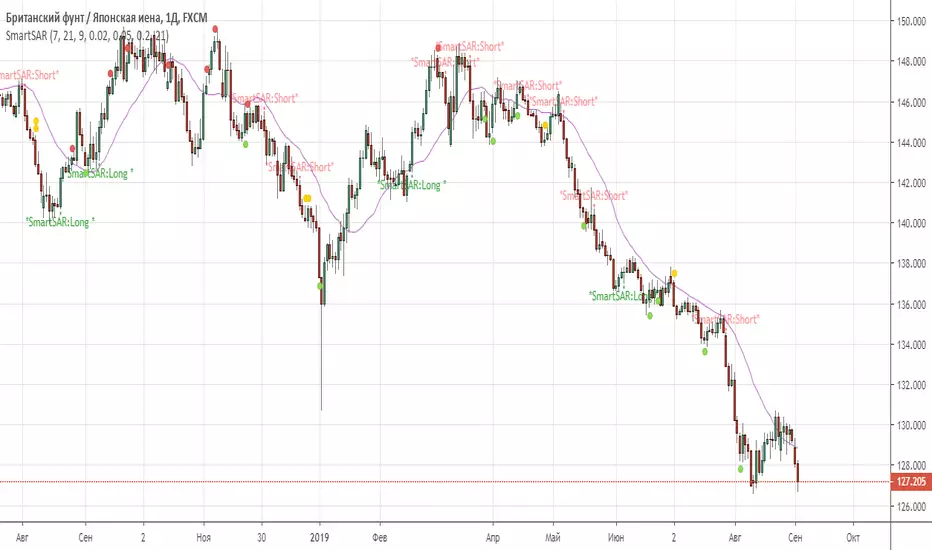
SmartSARSAR signal filtered by 3 indicators: MACD, AC, RVI.
This combination of trend indicator(SAR), 2 oscillators (MACD, RVI) , and 1 Bill Williams (AC) give us good Enter point.
Recommended timeframes: from 30 min and higher.
ATR, Kijun-Sen, %R Strategy [No Nonsense FX]A strategy that employs the No Nonsense FX method as described by VP.
1. Risk: ATR
2. Baseline: Kijun-Sen
3. Confirmation #1: Williams % Range
4. Volume: TBD
5. Confirmation #2: TBD
6. Exit: TBD
Give me a follow if you enjoy and please PM me for more info/collabs!
Notes:
The defaults seem to work on all pairs
Please check the "two digit" box if running on JPY or Metals
If you have any ideas for a volume indicator, confirmation, and/or exit leave a comment!

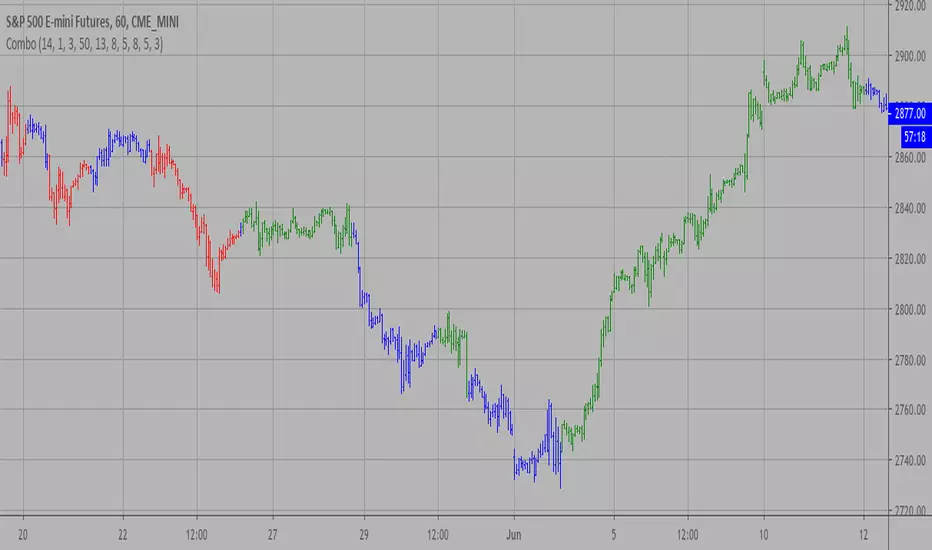
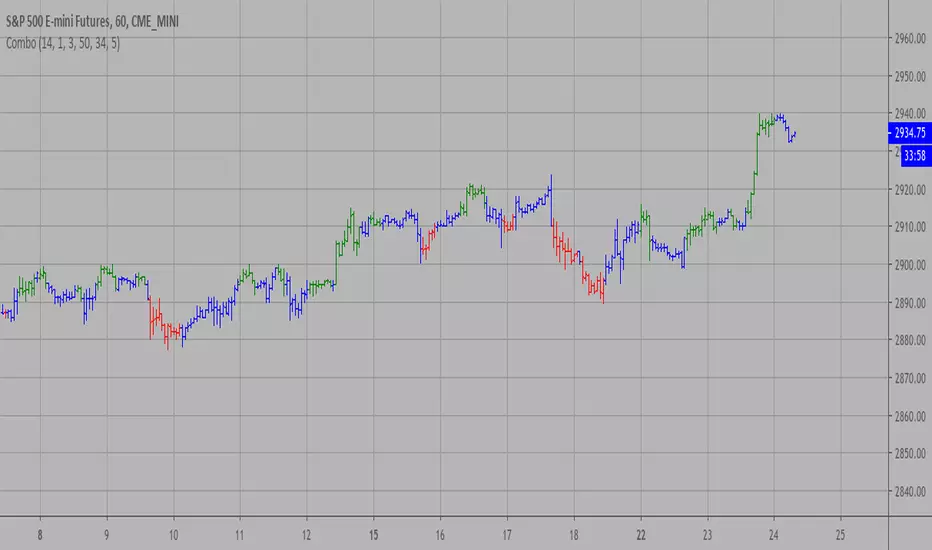
Combo Backtest 123 Reversal & Bill Williams Averages. 3Lines This is combo strategies for get
a cumulative signal. Result signal will return 1 if two strategies
is long, -1 if all strategies is short and 0 if signals of strategies is not equal.
First strategy
This System was created from the Book "How I Tripled My Money In The
Futures Market" by Ulf Jensen, Page 183. This is reverse type of strategies.
The strategy buys at market, if close price is higher than the previous close
during 2 days and the meaning of 9-days Stochastic Slow Oscillator is lower than 50.
The strategy sells at market, if close price is lower than the previous close price
during 2 days and the meaning of 9-days Stochastic Fast Oscillator is higher than 50.
Second strategy
This indicator calculates 3 Moving Averages for default values of
13, 8 and 5 days, with displacement 8, 5 and 3 days: Median Price (High+Low/2).
The most popular method of interpreting a moving average is to compare
the relationship between a moving average of the security's price with
the security's price itself (or between several moving averages).
WARNING:
- For purpose educate only
- This script to change bars colors.

Combo Strategy 123 Reversal & Bill Williams Averages. 3Lines This is combo strategies for get
a cumulative signal. Result signal will return 1 if two strategies
is long, -1 if all strategies is short and 0 if signals of strategies is not equal.
First strategy
This System was created from the Book "How I Tripled My Money In The
Futures Market" by Ulf Jensen, Page 183. This is reverse type of strategies.
The strategy buys at market, if close price is higher than the previous close
during 2 days and the meaning of 9-days Stochastic Slow Oscillator is lower than 50.
The strategy sells at market, if close price is lower than the previous close price
during 2 days and the meaning of 9-days Stochastic Fast Oscillator is higher than 50.
Second strategy
This indicator calculates 3 Moving Averages for default values of
13, 8 and 5 days, with displacement 8, 5 and 3 days: Median Price (High+Low/2).
The most popular method of interpreting a moving average is to compare
the relationship between a moving average of the security's price with
the security's price itself (or between several moving averages).
WARNING:
- For purpose educate only
- This script to change bars colors.
Willams %R with 13 EMA and 13 SMAThis is standard Williams %R originally written by another user that I modified. Credit to him whose name escapes me at the moment. The green line is 13EMA and red line is 13SMA (offset by 2 for timing trades). Great for very quick trades/day trades. Green over red = long. Red over Green = short.
Beware: this is still a choppy indicator. You'll need to use it with the Ichimoku lagging span, chop indiicator, adx, or some other method of avoiding getting chopped to death trying to take every signal.
Combo Backtest 123 Reversal and Accelerator Oscillator (AC) This is combo strategies for get
a cumulative signal. Result signal will return 1 if two strategies
is long, -1 if all strategies is short and 0 if signals of strategies is not equal.
First strategy
This System was created from the Book "How I Tripled My Money In The
Futures Market" by Ulf Jensen, Page 183. This is reverse type of strategies.
The strategy buys at market, if close price is higher than the previous close
during 2 days and the meaning of 9-days Stochastic Slow Oscillator is lower than 50.
The strategy sells at market, if close price is lower than the previous close price
during 2 days and the meaning of 9-days Stochastic Fast Oscillator is higher than 50.
Second strategy
The Accelerator Oscillator has been developed by Bill Williams
as the development of the Awesome Oscillator. It represents the
difference between the Awesome Oscillator and the 5-period moving
average, and as such it shows the speed of change of the Awesome
Oscillator, which can be useful to find trend reversals before the
Awesome Oscillator does.
WARNING:
- For purpose educate only
- This script to change bars colors.

Combo Strategies 123 Reversal and Accelerator Oscillator (AC) This is combo strategies for get
a cumulative signal. Result signal will return 1 if two strategies
is long, -1 if all strategies is short and 0 if signals of strategies is not equal.
First strategy
This System was created from the Book "How I Tripled My Money In The
Futures Market" by Ulf Jensen, Page 183. This is reverse type of strategies.
The strategy buys at market, if close price is higher than the previous close
during 2 days and the meaning of 9-days Stochastic Slow Oscillator is lower than 50.
The strategy sells at market, if close price is lower than the previous close price
during 2 days and the meaning of 9-days Stochastic Fast Oscillator is higher than 50.
Second strategy
The Accelerator Oscillator has been developed by Bill Williams
as the development of the Awesome Oscillator. It represents the
difference between the Awesome Oscillator and the 5-period moving
average, and as such it shows the speed of change of the Awesome
Oscillator, which can be useful to find trend reversals before the
Awesome Oscillator does.
WARNING:
- This script to change bars colors.
Noro's Alligator Strategy by Bill Williamssma1 > sma2 and sma2 > sma3 - to open a long position (and to close a short position)
sma1 < sma2 and sma2 < sma3 - to open a short position (and to close a long position)

Momentum & Williams %R This strategy join 2 power study indicators on the same plot: Willian %R and Momentum.
Willian %R can indicate the good time for you buy or sale. Less than -80 indicate good buying opportunity . Greater than -20 good sale opportunity.
Momentum can indicate the good price for buy or sale, in other words, can indicate the speed the price goes down or goes up.
By Baldasso, March 2019.

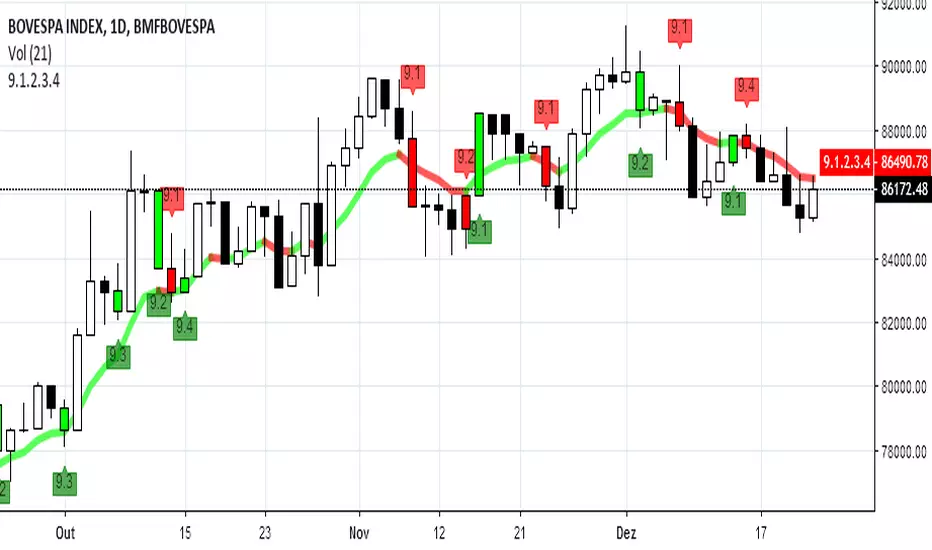
Backtest Larry Williams 9.1 ( exemplo) - JBBacktest simples para compra no rompimento do topo do primeiro candle que abre abaixo e fecha acima da ema de 9 periodos e venda no rompimento do fundo do primeiro candle que fecha abaixo da ema de 9

WillSpread IndexDescription Source: www.instaforex.com
The technical indicator Will-Spread was developed by Larry Williams and described in his book Long-Term Secrets to Short-Term Trading. Will-Spread is one of the strongest financial indicators, which measures the flow of price between the primary market and a secondary market. The purpose of this comparison is to highlight signals for opening/closing positions of a financial asset through market signals that have influence on this particular asset. Once the Will Spread turns positive, look for the next bar to be above bar when Will spread turned positive to get long.
Indicator Use
Trading use The main method of using Will-Spread is watching the way it crossing the zero line. If the indicator crosses the zero line upward, rising trend is likely to continue. When the indicator falls below the zero line, there is an obvious downtrend. The author offered to use the indicator in trading from the standpoint of a filter: when Will-Spread crosses the zero line, a trader should wait for the formation of the bar that follows after the signal. In case the new bar generates a high/low above/below the previous one, a trader should open position. It is not recommended to open position if the bar does not form a new high/low.
The spread (A/B *100) takes two underlyings, get the exponential average creating exponential period (5) and subtract from another exponential period (20). The example he gives is that bonds move stocks, so we take the S&P and bonds. Get a will spread of SPY & TLT.

Setup 9.1.2.3.4---IN-US---
Hi traders, created by the professional Trader Larry Willians this trade system is based on 9 EMA, they are called 9.1, 9.2, 9.3 and 9.4.
Setup EMA 9.1
Allowed to buy when EMA 9 period turns to up after a Leg down, and to sell when turns to down after a Leg up.
Setup EMA 9.2
1) Find a stock with 9 EMA uptrend.
2) Wait for a close below the last candle low and mark the high of it candle.
3) If the price doesnt across the high, mark the next high.
4) Buy when the price cross the mark.
5) Stop-loss in the low of the marked candle.
Setup 9.3
1) Find a stock with the 9 period EMA uptrend.
2) Look for a close which is followed by two lower closes,
3) Mark the high of the last candle.
4) Buy when the price cross the mark.
5) Stop-loss in the low of the marked candle.
Setup EMA 9.4
1) Find a stock with 9 EMA uptrend and turns down, but the low of the candle which made turn go down can't be lose, 9 EMA can go down ONLY ONE candle.
2) Wait for 9 EMA go up in the next candle and mark the high.
3) If the price doesnt across the high, mark the next high.
4) Buy when the price cross the mark.
5) Stop-loss in the low of the marked candle.
--PT-BR---
Olá traders, setup universal, criado pelo famoso Trader Larry Williams , e divulgado pelo Trader Palex. Setup baseado na MME de 9 períodos. Temos aqui o conjunto de sinais 9.1, 9.2, 9.3, 9.4.
Setup MME 9.1
Setup MME 9.2
1) Achar ativo com a MME9 subindo;
2) Aguardar fechamento abaixo da mínima do candle anterior e marcar a máxima desse candle;
3) Se a máxima não for rompida, marcar a próxima máxima;
4) Compra no rompimento dessa máxima (qualquer negócio acima dessa máxima);
5) Stop na mínima do candle anterior ao que gerou a entrada;
Setup MME 9.3
1) Achar ativo com a MME9 esteja subindo;
2) Procurar 1 fechamento que seja seguido por dois fechamentos seguidos descendentes (abaixo do "candle referência") e marcar máxima do último candle;
3) Se a máxima não for rompida, marcar a próxima máxima;
4) Compra no rompimento dessa máxima (qualquer negócio acima dessa máxima);
5) Stop na mínima do candle anterior ao que gerou a entrada;
Setup MME 9.4
1) Achar ativo com a MME9 esteja subindo; A MME9 vem subindo e vira para baixo, mas o candle que fez essa virada ocorrer não tem a mínima perdida e a MME9 volta a virar para cima no candle seguinte. Só pode ficar virada pra baixo 1 candle e logo no candle seguinte a média vira pra cima.
2) Marcamos a máxima do candle que fez a MME9 virar para cima e no seu rompimento temos a entrada na
ponta compradora.
3) Se a máxima não for rompida, marcar a próxima máxima;
4) Compra no rompimento dessa máxima (qualquer negócio acima dessa máxima);
5)Stop-loss na mínima do candle que fez a MME9 virar para baixo.
Bons trades a todos.
BO Willians EMA'sBo Williams is a North America/Brazilian trader. He created a trading software called PHI CUBE.
This ema ratios are very used in Brazil. They a based in the Golden Number PHI.
"There is a special ratio that can be used to describe the proportions of everything from nature's smallest building blocks, such as atoms, to the most advanced patterns in the universe, such as unimaginably large celestial bodies. Nature relies on this innate proportion to maintain balance, but the financial markets also seem to conform to this "golden ratio." Here, we take a look at some technical analysis tools that have been developed to take advantage of it.
The Mathematics
Mathematicians, scientists and naturalists have known this ratio for centuries. It's derived from something known as the Fibonacci sequence, named after its Italian founder, Leonardo Fibonacci (whose birth is assumed to be around 1175 A.D. and death around 1250 A.D.). Each term in this sequence is simply the sum of the two preceding terms (1, 1, 2, 3, 5, 8, 13, etc.).
But this sequence is not all that important; rather, it is the quotient of the adjacent terms that possesses an amazing proportion, roughly 1.618, or its inverse 0.618. This proportion is known by many names: the golden ratio, the golden mean, PHI and the divine proportion, among others. So, why is this number so important? Well, almost everything has dimensional properties that adhere to the ratio of 1.618, so it seems to have a fundamental function for the building blocks of nature. "
More here www.goldennumber.net

Setup 9.1 MatheusGrijoI'm a big fan of Larry Williams, I put this indicator based on the famous SETUP of the same, denominated 9.1.
Basically it is a very simple, and efficient SETUP in the crypto markets.
I recommend using graphics times of 5/15/30 minutes.
Always on BTC pairs and crypts.
The code is opensource and free, feel free to copy or change.
Good Profits;)

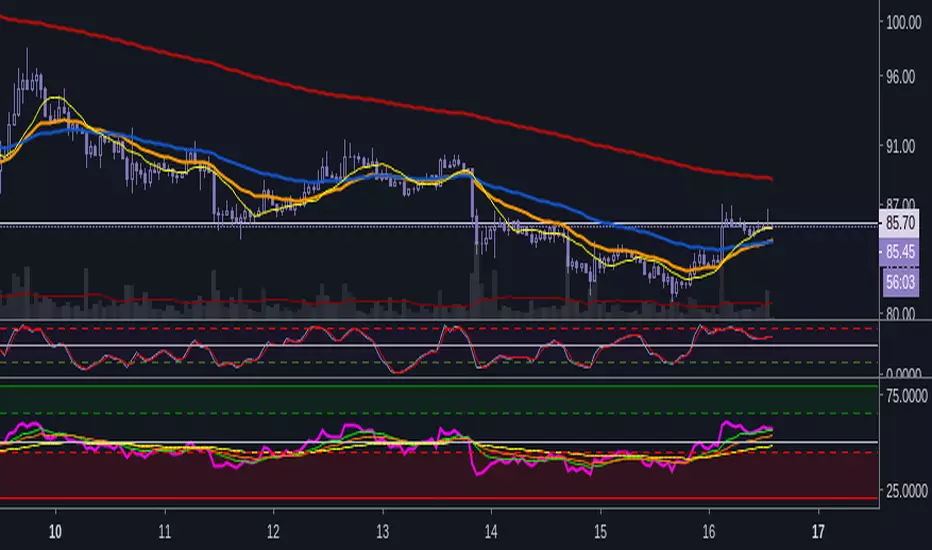
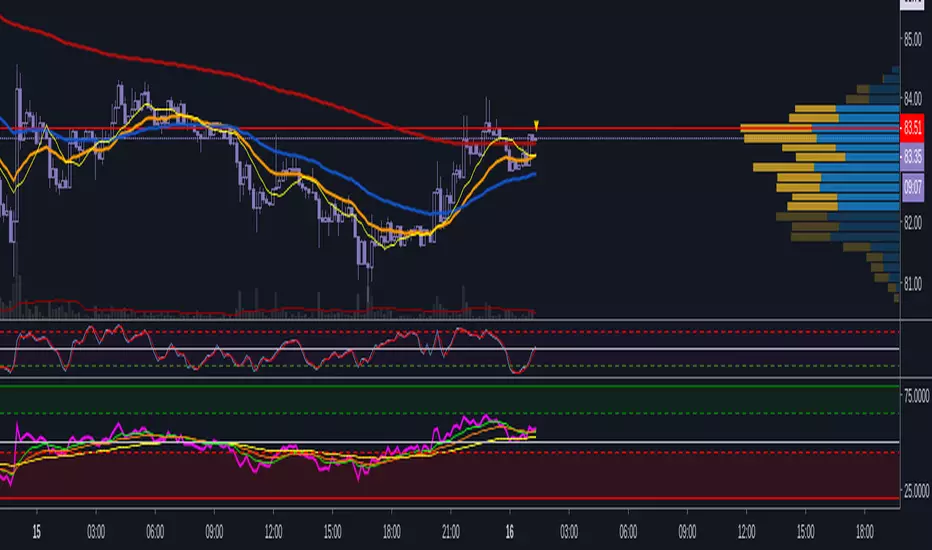
RSI_EMAx3_SushiThis indicator is mostly the same as other RSI+EMA indicators, the relevant difference is that it uses three EMAs instead of one.
The additional two EMAs can act as support/resistance and tell how strong a move is (eg. 'Williams Alligator'). It provides the same utility any MA does.
RSI & EMAx3_SushiThis indicator is mostly the same as other RSI+EMA indicators, the relevant difference is that it uses three EMAs instead of one.
The additional two EMAs can act as support/resistance and tell how strong a move is (eg. 'Williams Alligator'). It provides the same utility any MA does.
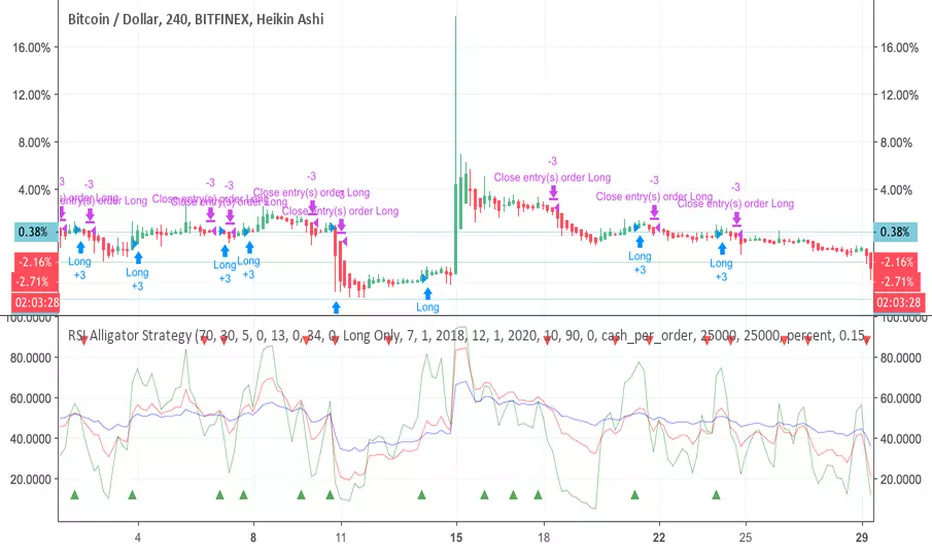
RSI Alligator Strategy [forked from jedireza]Backtester for RSI alligator is Williams Alligator strategy using Relative Strength Index to predict entries
Original script can be found at
Coral Trend of BiznesFilosofThis indicator is made specifically for day trading. You can trade within the day, but then you need to change the settings for your strategy.
You can enter a trade when the schedule returns to the corridor. But be sure to pay attention to the Bill Williams indicator "Alligator".
Everything is simple here: red dots are a sales trend, and green dots are a shopping trend.
For convenience, candles can be moved to the last layer.
More details on my channel in YouTube. Section "Indicators".
===
Этот индикатор сделан специально для дневной торговли. Можно торговать и внутри дня, но тогда надо изменить настройки под Вашу стратегию.
Входить в сделку можно, когда график возвращается в коридор. Но обязательно нужно обращать внимание на индикатор Билла Вильямса "Аллигатор".
Здесь всё просто: красные точки - тренд продаж, а зеленые точки - тренд покупок.
Для удобства свечи можно переместить на последний слой.
Больше подробностей на моём канале в Ютуб. Раздел "Индикаторы".

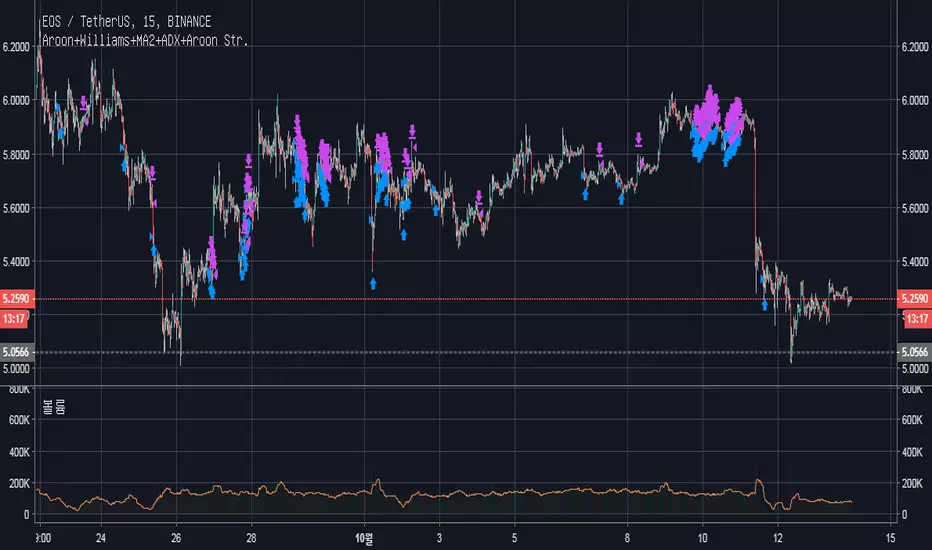
Aroon+Williams+MA2+ADX+Aroon Str.Inspired by the Watchbot strategy which makes about +60% profit in two months.
cafe.naver.com
This is customized to "EOSUSDT, 15 min, Binance" as a default.
I want to add the function for avoiding the recurrence of the trading for 24 ticks(period), but don't know how to yet.
Multiple Time Frame Williams Alligator H1M5fractalist scalpers, chaos theorists and traders trading on 5 minute charts in the financial markets are often swamped by too many fractals; switching between charts back and forth can be a headache too; so here's an indicator script coded by yours truly to make our lives easier.
how it works?
apply MTFWA on a 5 minute chart; synchronise it with your 1 hour chart; draw the standard horizontal lines to mark fractals on your 1 hour chart...there you go; better fractals filtered to analyse your 5 minute chart; scalp your hearts out.