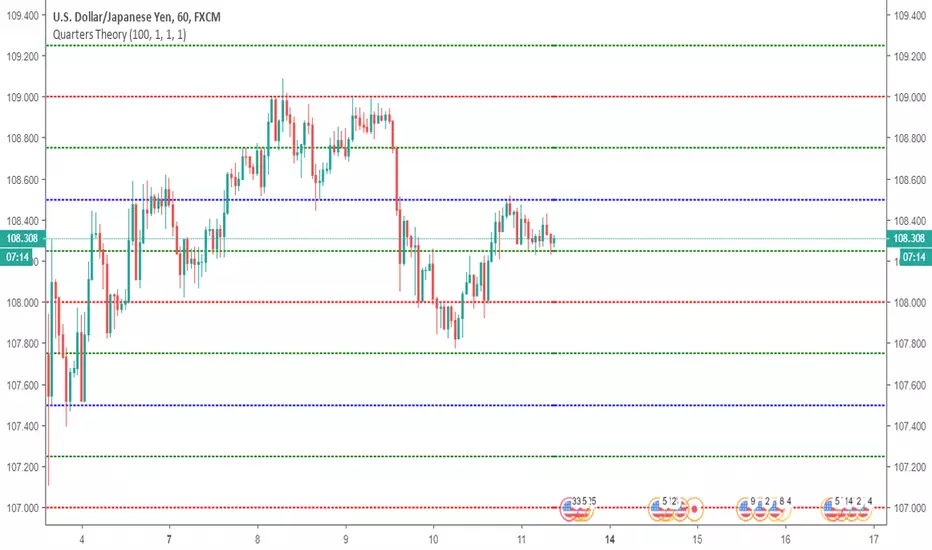
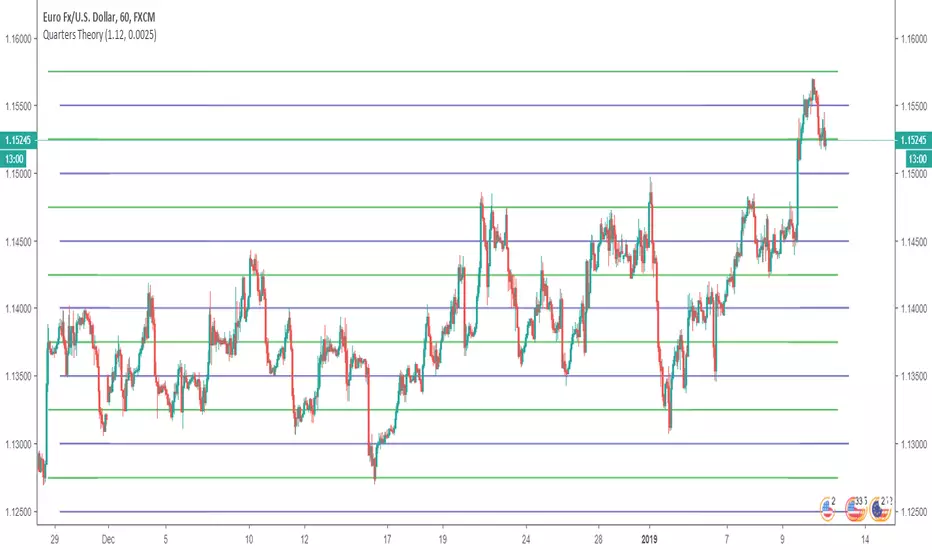
Quarters TheoryThis indicator helps you to put Quarter Theory lines on your chart. It's defaults are meant for EURUSD , but you can change it for other charts. There are 16 lines in this indicator.
For EURUSD recommended settings right now are: Starting Price (Bottom):1.12 and Gap: 0.0025
USDCAD: Starting Price (Bottom):1.315 and Gap: 0.005
EURAUD: Starting Price (Bottom):1.59 and Gap: 0.005
USDJPY: Starting Price (Bottom):107 and Gap: 0.5
USDCHF: Starting Price (Bottom):0.97 and Gap: 0.0025
BTCUSD: Starting Price (Bottom):3200 and Gap: 100
XAUUSD: Starting Price (Bottom): 1230 and Gap: 5
These settings are the ones I use, but you could find better settings for yourself.
Works very well on JPY pairs.
ابحث في النصوص البرمجية عن "xauusd黄金实时价格"
Horizontal LinesHorizontal lines help you to put Quarter Theory lines on your chart. It's defaults are meant for EURUSD , but you can change it for other charts. There are 16 lines in this indicator.
For EURUSD recommended settings right now are: Starting Price (Bottom):1.12 and Gap: 0.0025
USDCAD: Starting Price (Bottom):1.315 and Gap: 0.005
EURAUD: Starting Price (Bottom):1.59 and Gap: 0.005
USDJPY: Starting Price (Bottom):107 and Gap: 0.5
USDCHF: Starting Price (Bottom):0.97 and Gap: 0.0025
BTCUSD: Starting Price (Bottom):3200 and Gap: 100
XAUUSD: Starting Price (Bottom): 1230 and Gap: 5
These settings are the ones I use, but you could find better settings for yourself. It works very well on JPY pairs.
Bästa Bob Multi-RSI 😎👊✅ RSI 7 → Fast impulse indicator
• Shows micro-movements
• Reacts instantly to liquidity sweeps
• Perfect for entry timing
✅ RSI 14 → Macro momentum indicator
• Captures the real trend
• Filters out noise
• Confirms larger market movements
When both are in sync → you get true market direction plus perfect timing.
👉 How to Use RSI 7 + RSI 14
1️⃣ Entry Signals (the best method)
BUY when:
• RSI 7 turns up from oversold
• RSI 14 is also sloping upward or gets crossed by RSI 7 from below
→ Extremely accurate right after a liquidity sweep.
SELL when:
• RSI 7 turns down from overbought
• RSI 14 is sloping downward or gets crossed by RSI 7 from above
→ Works insanely well for fakeouts and FVG entries.
2️⃣ Trend Filter
• When RSI 14 stays above 50 → market is bullish
• When RSI 14 stays below 50 → bearish
RSI 7 is then used only for timing entries.
3️⃣ A++ Setups (your favorite ones 😉🔥)
The best signals appear when:
✔ RSI 7 crosses RSI 14 at the same time as:
• a liquidity sweep happens
• price taps into an FVG or Order Block
• volume reacts
• your trend filter (EMA, HTF) supports the move
This combo is criminally effective when scalping BTC, NAS100, and XAUUSD.

Supertrend + EMA50 — Signal (no labels) chpolSupertrend + EMA50, best for 15 minutes, Forex, Crypto, XAUUSD.

CANX MA Crossover© CanxStixTrader
Moving average crossover systems measure drift in the market. They are great strategies for time-limited traders. KEEP IT SIMPLE
This strategy works both for buys and sells using the reaction line to guide your position against the reactions.
HOW TO USE THE INDICATOR
1) Choose your market and timeframe.
2) Choose the length.
3) Choose the multiplier.
4) Choose if the strategy is long-only or bidirectional (longs & shorts).
TIPS
The strategy works best in bullish markets as that is the primary direction that market such as stocks, indexes and metals like to move.
- Increase the multiplier to reduce whipsaws
- Increase the length to take fewer trades
- Decrease the length to take more trades
- Try a Long-Only strategy to see if that performs better.
The base set up when you load the indicator is for the 1 minute chart on gold. We found that it also works well on the US Indexes. For other markets you may need to change the length and multiplier to suit the market and back test its results.

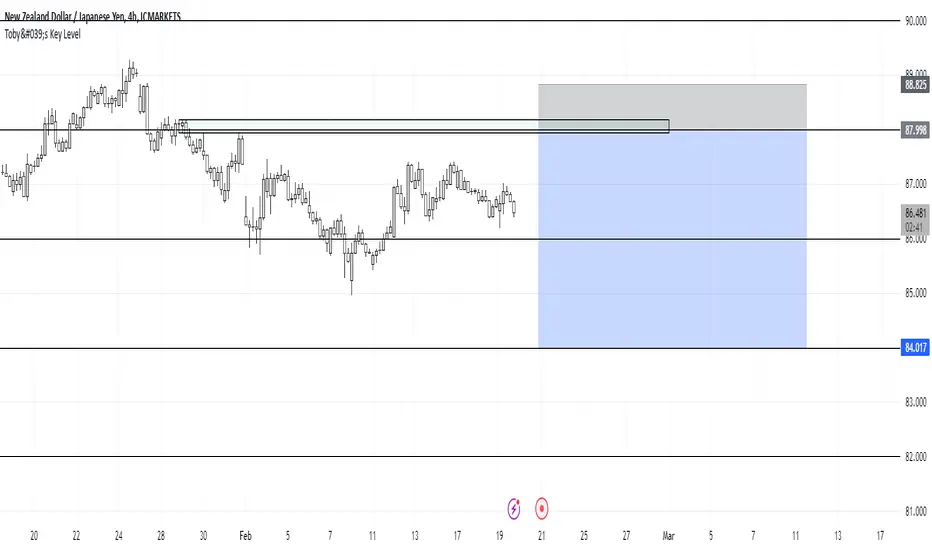
Toby's Key LevelsAn Indicator that helps determine Key Areas on the chart. You set the values you want the horizontal lines to update. They horizontal lines will be used for exits and entries of trade. My recommendation for these Key Areas are as follows ( These recommendations are mostly for day trading and swing trading ):
XAU: Value distance of 50 ex. XAUUSD.
NAS: Value distance of 250 ex. NAS100/USTEC.
ETH: Value distance of 100 ex. ETHUSD.
AUD pairs: Value distance of 0.0200 ex. GBPAUD, EURAUD.
CAD pairs: Value distance of 0.0100 ex. NZDCAD, EURCAD.
CHF pairs: Value distance of 0.0100 ex. CADCHF, GBPCHF.
GBP pairs: Value distance of 0.00350 ex. EURGBP.
JPY pairs: Value distance of 2.00 ex. EURJPY, GBPJPY.
NZD pairs: Value distance of 0.015 ex. GBPNZD, AUDNZD.
Note:
These are subject to change and you can alter the lines anyhow you want to suit your trading style. These are what I recommend. Remember, Market is King.
Safe Trading!
Easy Scalping Lot Calculator for ForexThe calculator was created to make it easier to calculate the lot size on Forex. I planned to use it for the following pairs: AUDCAD, AUDCHF, AUDJPY, AUDUSD, EURAUD, EURCAD, EURCHF, EURGBP, EURJPY, EURNZD, EURUSD, GBPCHF, GBPJPY, GBPUSD, NZDUSD, USDCAD, USDCHF, USDJPY, XAUUSD.
The indicator is a table that shows the calculation of the lot for a predetermined stop loss.
For example, you are planning a trade, have calculated a stop loss of 15 points, and by checking the table you understand approximately what lot you need to use to limit your risk.
In the settings you can change the risk and also determine the stop loss value in points.
The calculator does not take into account the spread in the calculations.
There are websites where you can accurately calculate the lot, but if you trade on small time frames this is not suitable for you.
The calculator uses the formula:
Lot size = maximum risk / stop loss (in pips) / minimum pip value x minimum trading lot.

T3 Gold Sniper [RickAtw]Gold Sniper based on support and resistance looks for a sniper entry for trades. Used together with EMA
Key signal
Buy ------> Green Line
Sell ------> Red Line
Functional
The system was made for gold and everything is tuned for it.
I am a professional investor and I test each system for how long. If the system makes an income, it gets to my page. Use it for gold, cryptocurrencies and pairs AUD/USD GBP/USD
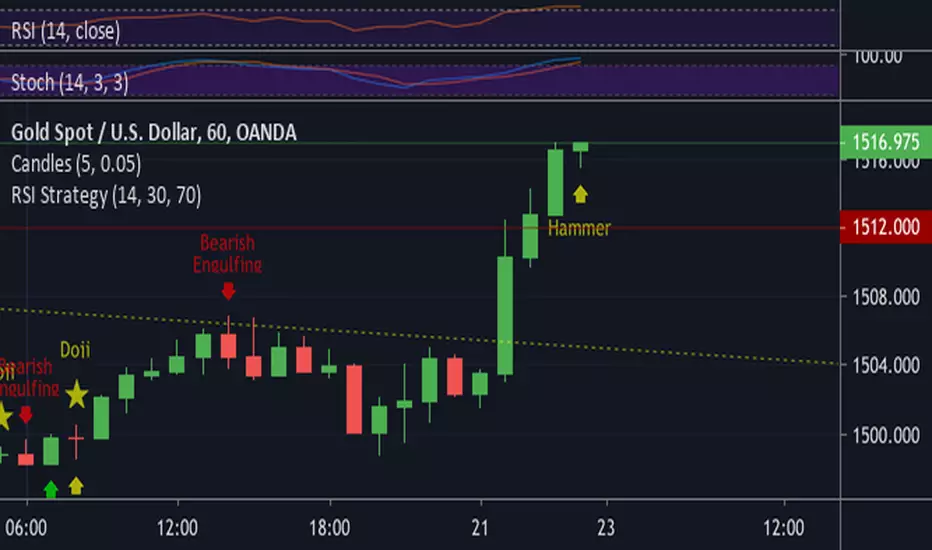
RSI StrategyNothing special in this strategy its just purely and application of RSI in 1hour chart of XAUUSD.
Generation 6 Massive Trend Following for Gold (Note at bottom!)Making this one an open script for you people.
Commission_value = 0.02 is the same as a 50 pip gold spread.
Start capital $10,000.
1.00 lots = 1 contract on this.
Trend establishment with the 600 period moving average, trend continuation with the crossover/crossunder.
This strategy is great for finding trends on XAUUSD.
Side note: if anyone knows MQL4 coding language for MT4, please let me know, I would like to see the results of this strategy over a period of several years rather than the several months of data that Tradingview Provides. Please PM me, I want to see how profitable this code is over a long period of time. Thank you, and enjoy.
Momentum Candle V3 by Sekolah TradingMomentum Candle v3 by Sekolah Trading
Description:
Momentum Candle v3 is a technical indicator designed to identify market momentum signals based on price movement within a single candle. The indicator measures the size of the candle's body and wick to determine if the market is showing strong bullish or bearish momentum.
Key Features:
Candle Size: Measures price movement within a single candle to assess market momentum.
Short Wick: Focuses on wick length, with short wicks indicating that the closing price is more significant than the opening price.
Bullish/Bearish Momentum: Provides bullish signals when the closing price is higher than the open, and bearish signals when the closing price is lower than the open.
Customizable Minimum Body: Users can adjust the minimum body size for XAUUSD and USDJPY pairs according to their trading preferences.
Timeframe: Works on M5 and M15 timeframes for XAUUSD and USDJPY currency pairs.
How to Use:
Bullish Signal: The indicator signals bullish momentum when the candle body is sufficiently large and the wick is short, with the closing price higher than the open.
Bearish Signal: The indicator signals bearish momentum when the candle body is sufficiently large and the wick is short, with the closing price lower than the open.
Pip Parameters: Adjust the pip values for XAUUSD and USDJPY according to market conditions or your trading preferences.
Note: This indicator is a tool for technical analysis and does not guarantee specific trading results. It is recommended to use it alongside other strategies and analyses for better accuracy.
Realistic Backtest Results:
To ensure transparency and honesty in the backtest, here are some key factors to consider:
Position Size: The backtest uses a realistic position size of about 5-10% of the account equity per trade.
Commission & Slippage: A commission of 0.1% per trade and slippage of 1 pip were used in the backtest simulation to reflect real market conditions.
Number of Trades: The backtest sample includes more than 100 trades for a representative result.
Example of Backtest Results:
Profitability: The backtest results on XAUUSD and USDJPY show consistent performance with this strategy on the M5 and M15 timeframes.
Commission and Slippage: Adjusting for commission and slippage showed better accuracy under more realistic market scenarios.
How to Use the Indicator:
Signals from this indicator can be used to confirm market momentum in trending conditions. However, it is highly recommended to combine this indicator with other technical analysis tools to minimize the risk of false signals.
Important Notes:
Honesty & Transparency: This indicator is designed to provide signals based on technical analysis and does not guarantee specific trading results.
No Over-Claims: The backtest results displayed represent realistic scenarios and are not intended to promise certain profits.
Original Content: The code for this indicator is original and does not violate any copyrights.
Tagging:
Smart Tags: Momentum, Candle, XAUUSD, USDJPY, Bullish, Bearish, M5, M15, Technical Indicator, Market Momentum.

Trade Setup A+ [v.8 Fixed Lines]🚀 Trade Setup A+ : Liquidity Hunter System (XAUUSD)
This indicator is an "All-in-One" trading system designed specifically for XAUUSD (Gold) Scalping and Swing trading. It combines Smart Money Concepts (SMC) with Price Action to identify high-probability setups by tracking liquidity pools and institutional order blocks.
💎 Key Features (v.8 Updated):
Auto Order Blocks (Clean View):
Automatically detects and draws Bullish (Green) and Bearish (Red) Order Blocks based on swing points.
Clean Look: Limits display to the last 5 active zones to keep the chart clutter-free.
Liquidity Levels (Fixed Lines):
D-High / D-Low: Thin lines representing Previous Day’s High & Low.
W-High / W-Low: Thick lines representing Previous Week’s High & Low (Strong Support/Resistance).
Dual Entry Signals:
Method 1 (Sniper): Shows a Diamond Icon (💎) when price touches an Order Block zone (Reversal setup).
Method 2 (Follow): Shows a Triangle Arrow (🔼/🔽) when price crosses EMA 14 with trend confirmation from EMA 49.
Macro Time Zones:
Highlights high-volume trading sessions (Asia, London, NY) on the background to identify "Killzones".
📈 How to Trade:
BUY Signal: Look for a Green Diamond (Touch OB) or Green Triangle (Price > EMA 14 & 49).
SELL Signal: Look for a Red Diamond (Touch OB) or Orange Triangle (Price < EMA 14).
Best Time: Trade when signals align with highlighted Macro Time zones.
⚠️ Disclaimer: This tool is for educational purposes only. Always use proper risk management.
🚀 Trade Setup A+ : ระบบเทรดล่าสภาพคล่อง (สำหรับทองคำ)
อินดิเคเตอร์ชุดนี้ออกแบบมาเพื่อเทรด XAUUSD (ทองคำ) โดยเฉพาะ ผสมผสานเทคนิค SMC (Smart Money Concepts) และ Price Action เพื่อหาจุดเข้าที่มีความแม่นยำสูง (High Probability) โดยเน้นการดักจับสภาพคล่องของรายใหญ่ค่ะ
💎 ฟีเจอร์หลัก (อัปเดตล่าสุด v.8):
Auto Order Blocks (แบบคลีน):
สร้างกล่องโซนซื้อขาย (Supply/Demand) ให้อัตโนมัติ (สีเขียว = โซน Buy, สีแดง = โซน Sell)
Clean Look: ระบบจะโชว์เฉพาะ 5 กล่องล่าสุดเท่านั้น เพื่อไม่ให้กราฟรกสายตา
Liquidity Levels (เส้นแนวรับต้าน):
D-High / D-Low: เส้นบาง แสดงราคาสูงสุด/ต่ำสุดของ "เมื่อวาน" (Day)
W-High / W-Low: เส้นหนา แสดงราคาสูงสุด/ต่ำสุดของ "สัปดาห์ที่แล้ว" (Week) ซึ่งเป็นแนวรับต้านที่แข็งแกร่ง
สัญญาณเข้าเทรด 2 แบบ (Dual Signals):
วิธีที่ 1 (Sniper): แสดงรูป เพชร (💎) เมื่อราคาวิ่งชนขอบกล่อง Order Block (ดักจุดกลับตัวปลายไส้)
วิธีที่ 2 (Follow Trend): แสดงรูป ลูกศรสามเหลี่ยม (🔼/🔽) เมื่อราคาตัดเส้น EMA ตามเงื่อนไข (Buy ต้องยืนเหนือ EMA 14 และ 49)
Macro Time (ช่วงเวลาทำเงิน):
ระบายสีพื้นหลังบอกช่วงเวลาที่ตลาดวิ่งแรง (Asia, London, NY) เพื่อให้โฟกัสถูกจุด
📈 วิธีใช้งาน:
ขา BUY: รอสัญญาณ เพชรสีเขียว (ชนกล่องรับ) หรือ ลูกศรเขียว (ตามเทรนด์)
ขา SELL: รอสัญญาณ เพชรสีแดง (ชนกล่องต้าน) หรือ ลูกศรส้ม (ตามเทรนด์)
คำแนะนำ: ประสิทธิภาพสูงสุดเมื่อสัญญาณเกิดในช่วงเวลา Macro Time (แถบสีพื้นหลัง)

XAU Macro Regime + Mispricing OscillatorThis indicator is designed to measure the true macro environment behind gold (XAUUSD) and identify when price is aligned with macro flows or mispriced relative to them.
It combines a macro composite index, a mispricing spread oscillator, and automatic divergence detection into one tool.
1. Macro Composite Index (Regime Filter)
The top layer of the indicator constructs a macro regime score derived from:
A basket of gold FX pairs (XAUJPY, XAUAUD, XAUCHF, XAUNZD, XAUSGD)
The inverted DXY (to represent USD pressure on gold)
US30 (to capture global risk appetite and macro sentiment)
Each component is normalized and weighted, then combined into a composite macro index.
A smoothed baseline (SMA) is subtracted from this composite to form the Regime Line.
Interpretation
Regime > 0 (Green background):
Macro environment is supportive for gold.
XAUUSD is more likely to rise, consolidate, or mean revert upward.
Regime < 0 (Red background):
Macro environment is hostile for gold.
XAUUSD is more likely to fall, struggle, or mean revert downward.
This creates a macro trend filter that tells you when it is safer to prefer longs, shorts, or stay out.
2. Mispricing Spread Oscillator (Spread MACD)
The second layer measures the difference between XAUUSD and the macro composite index:
Spread = (Macro Composite) – (Normalized XAUUSD)
This spread is then smoothed into a signal line, and a histogram is plotted from their difference (MACD-style).
Interpretation
Spread > 0:
Gold is undervalued relative to macro conditions.
Macro strength > price strength.
Spread < 0:
Gold is overvalued relative to macro conditions.
Price strength > macro strength.
Spread crossing above signal:
Macro momentum turning bullish relative to price.
Spread crossing below signal:
Macro momentum turning bearish relative to price.
Green histogram: acceleration upward
Red histogram: acceleration downward
This oscillator captures mispricing, momentum shifts, and macro-pressure reversals.
3. Automatic Divergence Detection
The indicator automatically detects:
-Bullish Divergence-
XAUUSD makes a lower low
Spread makes a higher low
→ Price is weaker than macro reality → potential bullish reversal or mispricing reversion.
-Bearish Divergence-
XAUUSD makes a higher high
Spread makes a lower high
→ Price is stronger than macro reality → potential bearish reversal or exhaustion.
Labels (“Bull div” / “Bear div”) appear directly on the oscillator for clarity.
4. What The Indicator Seeks To Do
This indicator aims to answer the question:
“Is gold moving with the true macro pressure behind it, or diverging from it?”
Most gold indicators only watch XAUUSD price.
This one watches:
-gold cross-currency flows
-USD strength
-global risk sentiment
-gold’s relative position vs macro
-mispricing momentum
-divergence between price and macro reality
This creates a unique tool that:
-Detects when gold is overextended
-Detects when gold is undervalued
-Reveals hidden macro strength or weakness
-Highlights turning points and exhaustion
-Shows when a pullback is likely to end
-Shows when a rally is likely to fail
-Gives regime-aware trade direction (long vs short bias)
-Adds divergence labels for precision entries

SYMBOL NOTES - UNCORRELATED TRADING GROUPSWrite symbol-specific notes that only appear on that chart. Organized into 6 uncorrelated groups for safe multi-pair trading.
📝 SYMBOL NOTES - UNCORRELATED TRADING GROUPS
This indicator solves two problems every serious trader faces:
1. Keeping Track of Your Analysis
Write notes for each trading pair and they'll only appear when you view that specific chart. No more forgetting your key levels, trade ideas, or analysis!
2. Avoiding Correlated Risk
The symbols are organized into 6 groups where ALL pairs within each group are completely UNCORRELATED. Trade any combination from the same group without worrying about double exposure.
━━━━━━━━━━━━━━━━━━━━━━━━━━━━━━━━━━━━━━━━━━━━━
🎯 THE PROBLEM THIS SOLVES
Have you ever:
- Opened XAUUSD and EURUSD at the same time, then Fed news hit and BOTH positions went against you?
- Traded GBPUSD and GBPJPY together, then BOE announcement stopped out both trades?
- Forgotten what levels you were watching on a pair?
This indicator helps you avoid these costly mistakes!
━━━━━━━━━━━━━━━━━━━━━━━━━━━━━━━━━━━━━━━━━━━━━
📁 THE 6 UNCORRELATED GROUPS
Each group contains pairs that share NO common currency:
```
GRUP 1: XAUUSD • EURGBP • NZDJPY • AUDCHF • NATGAS
GRUP 2: EURUSD • GBPJPY • AUDNZD • CADCHF
GRUP 3: GBPUSD • EURJPY • AUDCAD • NZDCHF
GRUP 4: USDJPY • EURCHF • GBPAUD • NZDCAD
GRUP 5: USDCAD • EURAUD • GBPCHF
GRUP 6: NAS100 • DAX40 • UK100 • JPN225
```
**Example - GRUP 1:**
- XAUUSD → Uses USD + Gold
- EURGBP → Uses EUR + GBP
- NZDJPY → Uses NZD + JPY
- AUDCHF → Uses AUD + CHF
- NATGAS → Commodity (independent)
= 7 different currencies, ZERO overlap!
━━━━━━━━━━━━━━━━━━━━━━━━━━━━━━━━━━━━━━━━━━━━━
**✅ HOW TO USE**
1. Add indicator to any chart
2. Open Settings (gear icon ⚙️)
3. Find your symbol's group and input field
4. Write your note (support levels, trade ideas, etc.)
5. Switch charts - your note appears only on that symbol!
━━━━━━━━━━━━━━━━━━━━━━━━━━━━━━━━━━━━━━━━━━━━━
⚙️ SETTINGS
- Note Position: Choose where the note box appears (6 positions)
- Text Size: Tiny, Small, Normal, or Large
- Show Group Name: Display which correlation group
- Show Symbol Name: Display current symbol
- Colors: Customize background, text, group label, and border colors
━━━━━━━━━━━━━━━━━━━━━━━━━━━━━━━━━━━━━━━━━━━━━
💡 TRADING STRATEGY TIPS
Safe Multi-Pair Trading:
1. Pick ONE group for the day
2. Look for setups on ANY symbol in that group
3. Open positions freely - they won't correlate!
4. Even if major news hits, only ONE position is affected
━━━━━━━━━━━━━━━━━━━━━━━━━━━━━━━━━━━━━━━━━━━━━
🔧 COMPATIBLE WITH
- All major forex brokers
- Prop firms (FTMO, Alpha Capital, etc.)
- Works on any timeframe
- Futures symbols supported (MGC, M6E, etc.)
━━━━━━━━━━━━━━━━━━━━━━━━━━━━━━━━━━━━━━━━━━━━━

Vital Wave 20-50Simplicity is almost always the most effective approach, and here I’m giving you a trend-following system that exploits the bullish bias of traditional markets and their trending nature, with very basic rules.
Rules (long entries only)
• Market entry: When the EMA 20 crosses above the EMA 50 (from below)
• Main market exit: When the EMA 20 crosses below the EMA 50 (from above)
• Fixed Stop Loss: Placed at the price level of the Lower Bollinger Band at the moment the trade is entered.
In my strategy, the primary exit is when the EMA 20 crosses below the EMA 50. However, this crossover can sometimes take a while to occur, and in the meantime the price may have already dropped significantly. The Stop Loss based on the Lower Bollinger Band is designed to limit losses in case the market moves sharply against the position without giving the bearish crossover signal in time. Having two exit conditions makes the strategy much more robust in terms of risk management.
Risk Management:
• Initial capital: $10,000
• Position size: 10% of available capital per trade
• Commissions: 0.1% on traded volume
• Stop Loss: Based on the Lower Bollinger Band
• Take Profit / Exit: When EMA 20 crosses below EMA 50
Recommended Markets:
XAUUSD (OANDA) (Daily)
Period: January 3, 1833 – November 23, 2025
Total Profit & Loss: +$6,030.62 USD (+57.57%)
Maximum Drawdown: $541.53 USD (3.83%)
Total Trades: 136
Winning Trades (Win Rate): 36.03% (49/136)
Profit Factor: 2.483
XAUUSD (OANDA) (12-hour)
Period: March 19, 2006 – November 23, 2025
Total Profit & Loss: +$1,209.56 USD (+11.89%)
Maximum Drawdown: $384.58 USD (3.61%)
Total Trades: 97
Winning Trades (Win Rate): 35.05% (34/97)
Profit Factor: 1.676
XAUUSD (OANDA) (8-hour)
Period: March 19, 2006 – November 23, 2025
Total Profit & Loss: +$1,179.36 USD (+11.81%)
Maximum Drawdown: $246.88 USD (2.32%)
Total Trades: 147
Winning Trades (Win Rate): 31.97% (47/147)
Profit Factor: 1.626
Tesla (NASDAQ) (4-hour)
Period: June 29, 2010 – November 23, 2025
Total Profit & Loss (Absolute): +$11,687.90 USD (+116.88%)
Maximum Drawdown: $922.05 USD (6.50%)
Total Trades: 68
Winning Trades (Win Rate): 39.71% (27/68)
Profit Factor: 4.156
Tesla (NASDAQ) (3-hour)
Total Profit & Loss: +$11,522.33 USD (+115.22%)
Maximum Drawdown: $1,247.60 USD (8.80%)
Total Trades: 114
Winning Trades: 33.33% (38/114)
Profit Factor: 2.811
Additional Recommendations
(These assets have shown good trending behavior with the same strategy across multiple timeframes):
• NVDA (15 min, 30 min, 1h, 2h, 3h, 4h, 6h, 8h, 12h, Daily)
• NFLX (1h, 2h, 3h, 4h, 6h, 8h, 12h, Daily)
• MA (1h, 2h, 3h, 4h, 6h, 8h, 12h, Daily)
• META (1h, 2h, 3h, 4h, 6h, 8h, 12h, Daily)
• AAPL (1h, 2h, 3h, 4h, 6h, 8h, 12h, Daily)
• SPY (12h, Daily)
About the Code
The user can modify:
• EMA periods (20 and 50 by default)
• Bollinger Bands length (20 periods)
• Standard deviation (2.0)
Visualization
• EMA 20: Blue line
• EMA 50: Red line
• Green background when EMA20 > EMA50 (bullish trend)
• Red background when EMA20 < EMA50 (bearish trend)
Important Note:
We can significantly increase the profit factor and overall profitability by risking a fixed percentage per trade instead of a fixed amount. This would prevent losses from fluctuating with changes in volatility.
This could be implemented by reducing position size or adjusting leverage based on the volatility percentage required for each trade, but I’m not sure if this is fully possible in Pine Script. In my other script, “ Golden Cross 50/200 EMA ,” I go deeper into this topic and provide examples.
I hope you enjoy this contribution. Best regards!

Ben's BTC Macro Fair Value OscillatorBen's BTC Macro Fair Value Oscillator
Overview
The **BTC Macro Fair Value Oscillator** is a non-crypto fair value framework that uses macro asset relationships (equities, dollar, gold) to estimate Bitcoin's "macro-driven fair value" and identify mean-reversion opportunities.
"Is BTC cheap or expensive right now?" on the 4 Hour Timeframe ONLY
### Key Features
✅ **Macro-driven**: Uses QQQ, DXY, XAUUSD instead of on-chain or crypto metrics
✅ **Dynamic weighting**: Assets weighted by rolling correlation strength
✅ **Mean-reversion signals**: Identifies when BTC is cheap/expensive vs macro
✅ **Validated parameters**: Optimized through 5-year backtest (Sharpe 6.7-9.9)
✅ **Visual transparency**: Live correlation panel, fair value bands, statistics
✅ **Non-repainting**: All calculations use confirmed historical data only
### What This Indicator Does
- Builds a **synthetic macro composite** from traditional assets
- Runs a **rolling regression** to predict BTC price from macro
- Calculates **deviation z-score** (how far BTC is from macro fair value)
- Generates **entry signals** when BTC is extremely cheap vs macro (dev < -2)
- Generates **exit signals** when BTC returns to fair value (dev > 0)
### What This Indicator Is NOT
❌ Not a high-frequency trading system (sparse signals by design)
❌ Not optimized for absolute returns (optimized for Sharpe ratio)
❌ Not suitable as standalone trading system (best as overlay/confirmation)
❌ Not predictive of short-term price movements (mean-reversion timeframe: days to weeks)
---
## Core Concept
### The Premise
Bitcoin doesn't trade in a vacuum. It's influenced by:
- **Risk appetite** (equities: QQQ, SPX)
- **Dollar strength** (DXY - inverse to risk assets)
- **Safe haven flows** (Gold: XAUUSD)
When macro conditions are "good for BTC" (risk-on, weak dollar, strong equities), BTC should trade higher. When macro conditions turn against it, BTC should trade lower.
### The Innovation
Instead of looking at BTC in isolation, this indicator:
1. **Measures how strongly** BTC currently correlates with each macro asset
2. **Builds a weighted composite** of those macro returns (the "D" driver)
3. **Regresses BTC price on D** to estimate "macro fair value"
4. **Tracks the deviation** between actual price and fair value
5. **Signals mean reversion** when deviation becomes extreme
### The Edge
The validated edge comes from:
- **Extreme deviations predict future returns** (dev < -2 → +1.67% over 12 bars)
- **Monotonic relationship** (more negative dev → higher forward returns)
- **Works out-of-sample** (test Sharpe +83-87% better than training)
- **Low correlation with buy & hold** (provides diversification value)
---
## Methodology
### Step 1: Macro Composite Driver D(t)
The indicator builds a weighted composite of macro asset returns:
**Process:**
1. Calculate **log returns** for BTC and each macro reference (QQQ, DXY, XAUUSD)
2. Compute **rolling correlation** between BTC and each reference over `corrLen` bars
3. **Weight each asset** by `|correlation|` if above `minCorrAbs` threshold, else 0
4. **Sign-adjust** weights (+1 for positive corr, -1 for negative) to handle inverse relationships
5. **Z-score normalize** each reference's returns over `fvWindow`
6. **Composite D(t)** = weighted sum of sign-adjusted z-scores
**Formula:**
```
For each reference i:
corr_i = correlation(BTC_returns, ref_i_returns, corrLen)
weight_i = |corr_i| if |corr_i| >= minCorrAbs else 0
sign_i = +1 if corr_i >= 0 else -1
z_i = (ref_i_returns - mean) / std
contrib_i = sign_i * z_i * weight_i
D(t) = sum(contrib_i) / sum(weight_i)
```
**Key Insight:** D(t) represents "how good macro conditions are for BTC right now" in a normalized, correlation-weighted way.
---
### Step 2: Fair Value Regression
Uses rolling linear regression to predict BTC price from D(t):
**Model:**
```
BTC_price(t) = α + β * D(t)
```
**Calculation (Pine Script approach):**
```
corr_CD = correlation(BTC_price, D, fvWindow)
sd_price = stdev(BTC_price, fvWindow)
sd_D = stdev(D, fvWindow)
cov = corr_CD * sd_price * sd_D
var_D = variance(D, fvWindow)
β = cov / var_D
α = mean(BTC_price) - β * mean(D)
fair_value(t) = α + β * D(t)
```
**Result:** A time-varying "macro fair value" line that adapts as correlations change.
---
### Step 3: Deviation Oscillator
Measures how far BTC price has deviated from fair value:
**Calculation:**
```
residual(t) = BTC_price(t) - fair_value(t)
residual_std = stdev(residual, normWindow)
deviation(t) = residual(t) / residual_std
```
**Interpretation:**
- `dev = 0` → BTC at fair value
- `dev = -2` → BTC is 2 standard deviations **cheap** vs macro
- `dev = +2` → BTC is 2 standard deviations **rich** vs macro
---
### Step 4: Signal Generation
**Long Entry:** `dev` crosses below `-2.0` (BTC extremely cheap vs macro)
**Long Exit:** `dev` crosses above `0.0` (BTC returns to fair value)
**No shorting** in default config (risk management choice - crypto volatility)
---
## How It Works
### Visual Components
#### 1. Price Chart (Main Panel)
**Fair Value Line (Orange):**
- The estimated "macro-driven fair value" for BTC
- Calculated from rolling regression on macro composite
**Fair Value Bands:**
- **±1σ** (light): 68% confidence zone
- **±2σ** (medium): 95% confidence zone
- **±3σ** (dark, dots): 99.7% confidence zone
**Entry/Exit Markers:**
- **Green "LONG" label** below bar: Entry signal (dev < -2)
- **Red "EXIT" label** above bar: Exit signal (dev > 0)
#### 2. Deviation Oscillator (Separate Pane)
**Line plot:**
- Shows current deviation z-score
- **Green** when dev < -2 (cheap)
- **Red** when dev > +2 (rich)
- **Gray** when neutral
**Histogram:**
- Visual representation of deviation magnitude
- Green bars = negative deviation (cheap)
- Red bars = positive deviation (rich)
**Threshold lines:**
- **Green dashed at -2.0**: Entry threshold
- **Red dashed at 0.0**: Exit threshold
- **Gray solid at 0**: Fair value line
#### 3. Correlation Panel (Top-Right)
Shows live correlation and weighting for each macro asset:
| Asset | Corr | Weight |
|-------|------|--------|
| QQQ | +0.45 | 0.45 |
| DXY | -0.32 | 0.32 |
| XAUUSD | +0.15 | 0.00 |
| Avg \|Corr\| | 0.31 | 0.77 |
**Reading:**
- **Corr**: Current rolling correlation with BTC (-1 to +1)
- **Weight**: How much this asset contributes to fair value (0 = excluded)
- **Avg |Corr|**: Average correlation strength (should be > 0.2 for reliable signals)
**Colors:**
- Green/Red corr = positive/negative correlation
- White weight = asset included, Gray = excluded (below minCorrAbs)
#### 4. Statistics Label (Bottom-Right)
```
━━━ BTC Macro FV ━━━
Dev: -2.34
Price: $103,192
FV: $110,500
Status: CHEAP ⬇
β: 103.52
```
**Fields:**
- **Dev**: Current deviation z-score
- **Price**: Current BTC close price
- **FV**: Current macro fair value estimate
- **Status**: CHEAP (< -2), RICH (> +2), or FAIR
- **β**: Current regression beta (sensitivity to macro)
---
## Installation & Setup
### TradingView Setup
1. Open TradingView and navigate to any **BTC chart** (BTCUSD, BTCUSDT, etc.)
2. Open **Pine Editor** (bottom panel)
3. Click **"+ New"** → **"Blank indicator"**
4. **Delete** all default code
5. **Copy** the entire Pine Script from `GHPT_optimized.pine`
6. **Paste** into the editor
7. Click **"Save"** and name it "BTC Macro Fair Value Oscillator"
8. Click **"Add to Chart"**
### Recommended Chart Settings
**Timeframe:** 4h (validated timeframe)
**Chart Type:** Candlestick or Heikin Ashi
**Overlay:** Yes (indicator plots on price chart + separate pane)
**Alternative Timeframes:**
- Daily: Works but slower signals
- 1h-2h: May work but not validated
- < 1h: Not recommended (too noisy)
### Symbol Requirements
**Primary:** BTC/USD or BTC/USDT on any exchange
**Macro References:** Automatically fetched
- QQQ (Nasdaq 100 ETF)
- DXY (US Dollar Index)
- XAUUSD (Gold spot)
**Data Requirements:**
- At least **90 bars** of history (warmup period)
- Premium TradingView recommended for full historical data
---
## Reading the Indicator
### Identifying Signals
#### Strong Long Signal (High Conviction)
- ✅ Deviation < -2.0 (extreme undervaluation)
- ✅ Avg |Corr| > 0.3 (strong macro relationships)
- ✅ Price touching or below -2σ band
- ✅ "LONG" label appears below bar
**Interpretation:** BTC is extremely cheap relative to macro conditions. Historical data shows +1.67% average return over next 12 bars (48 hours at 4h timeframe).
#### Moderate Long Signal (Lower Conviction)
- ⚠️ Deviation between -1.5 and -2.0
- ⚠️ Avg |Corr| between 0.2-0.3
- ⚠️ Price approaching -2σ band
**Interpretation:** BTC is cheap but not extreme. Consider as confirmation for other signals.
#### Exit Signal
- 🔴 Deviation crosses above 0 (returns to fair value)
- 🔴 "EXIT" label appears above bar
**Interpretation:** Mean reversion complete. Close long positions.
#### Strong Short/Avoid Signal
- 🔴 Deviation > +2.0 (extreme overvaluation)
- 🔴 Avg |Corr| > 0.3
- 🔴 Price touching or above +2σ band
**Interpretation:** BTC is expensive vs macro. Historical data shows -1.79% average return over next 12 bars. Consider exiting longs or reducing exposure.
### Regime Detection
**Strong Regime (Reliable Signals):**
- Avg |Corr| > 0.3
- Multiple assets weighted > 0
- Fair value line tracking price reasonably well
**Weak Regime (Unreliable Signals):**
- Avg |Corr| < 0.2
- Most weights = 0 (grayed out)
- Fair value line diverging wildly from price
- **Action:** Ignore signals until correlations strengthen

[FGL] Stochastic ATR Trend IndicatorThis indicator:
Detects trend direction using ATR-based dynamic bands around SMA.
Generates buy/sell signals using Stochastic crossover conditions filtered by trend.
Colors candles to show trend direction.
Plots a visual “trend zone” band on the chart.
INPUT PARAMETERS:
Stochastic Length → Period for the stochastic oscillator.
Smooth K and Smooth D → Smoothing parameters for %K and %D lines.
ATR Length → Period used for SMA-based trend detection.
LOGIC FLOW
Determine trend using long ATR-based SMA channel.
Detect momentum change with Stochastic cross.
Confirm both momentum and price align with trend.
Generate buy/sell signal + change candle color.
STRATEGIC INTERPRETATION
Best use: Trend-following momentum entries.
Avoids: Countertrend false signals by filtering with trend value.
Signals:
Buy: In uptrend + bullish stochastic crossover.
Sell: In downtrend + bearish stochastic crossover.

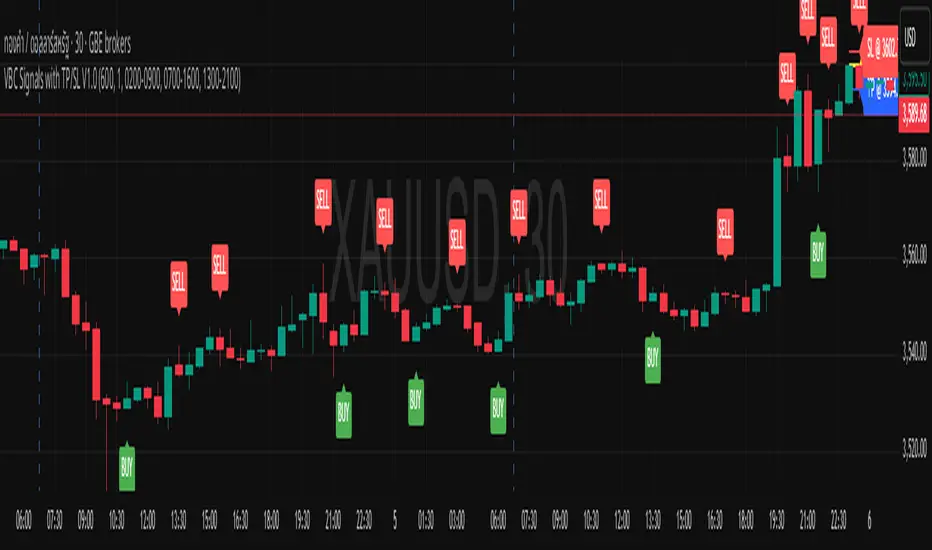
VBC Signals with TP/SL V1.0This script was based on volume break candle theory.
VBC has a very simple idea. It uses the principle that if the price of the XAUUSD asset rises above a specified range of at least 600 points (configuarable) continuously, and a candle breaks the upward trend, a signal will be generated to sell. The entry principle is to enter at the price at the last bullish candle with TP300 SL300.
On the other hand, if the price of xauusd falls below the specified level of 600 points and a candle breaks the price down by 1 candle, a BUY signal will occur, and the ENTRY and TP SL will use the same values as the SELL signalใ
How it works:
SELL SIGNAL : When the asset price rises above 600 points continuously and a "SELL" signal occurs, place a limit sell order at the pair of green and red bars that formed the signal, specifying a TP of 300 and SL of 300.
BUY SIGNAL : When the asset price falls more than 600 points continuously and a "BUY" signal occurs, place a limit sell order at the double bar pattern of the red and green bars that formed the signal, specifying a TP of 300 and a SL of 300.
Disclaimer: This script is for educational purposes only. It does not constitute financial advice. Always do your own research before making trading decisions.
NOTE: For certain XAUUSD of certain broker (for instance XAUUSD on OANDA), the signal might found to often, just multiple the threshold by 10, then 600 will be come 6000
AI-123's BTC vs Gold (Lag Correlation)
DISCLAIMER
I made this indicator with the help of ChatGPT and using what I have learned so far from The Pine Script Mastery Course, LOTS of edits based on what I have learned so far had to be made as well as additions and modifications to my liking thanks to what I have learned so far. I am aware this already exists but I have done my best to make a first ever script/indicator while learning how to properly publish as well, so please bear that in mind.
Overview
This indicator analyzes the correlation between Bitcoin (BTC) and Gold (XAUUSD), with a customizable lag applied to the Gold price, providing insight into the macro relationship between these two assets.
It is designed for traders and investors who want to track how Bitcoin and Gold move in relation to each other, particularly when Gold is lagged by a specific number of days.
Key Features:
BTC and Gold (Lagged) Price Overlay: Display Bitcoin (BTC) and Gold (XAUUSD) prices on the chart, with an adjustable lag applied to the Gold price.
Rolling Correlation Calculation: Measures the correlation between Bitcoin and lagged Gold prices over a customizable lookback period.
Adjustable Lag: The number of days that Gold is lagged relative to Bitcoin is fully customizable (default: 20 days).
Customizable Correlation Length: Allows you to choose the lookback period for the correlation (default: 50 days), providing flexibility for short-term or long-term analysis.
Normalized Plotting: Prices of Bitcoin and Gold are normalized for better visual alignment with the correlation values. BTC is divided by 1000, and Gold by 100.
Correlation Scaling: The correlation value is amplified by 10 for better visual clarity and comparison with price data.
Zero Line: Horizontal line representing a correlation of 0, making it easier to identify positive or negative correlation shifts.
Maximum Correlation Lines: Horizontal lines at +10 and -10 values for extreme correlation scenarios.
Input Settings:
Gold Symbol: Customize the Gold ticker (default: OANDA:XAUUSD).
Bitcoin Symbol: Customize the Bitcoin ticker (default: BINANCE:BTCUSDT).
Lag (in trading days): Adjust the number of trading days to lag the Gold price relative to Bitcoin (default: 20).
Correlation Length (days): Set the number of days over which the rolling correlation is calculated (default: 50).
How to Use:
Price Comparison: The BTC (Spot) and Lagged Gold plots give you a side-by-side visual comparison of the two assets, normalized for clarity.
Correlation Line: The correlation line helps you gauge the strength and direction of the relationship between BTC and lagged Gold. Positive values indicate a strong positive correlation, while negative values indicate a negative correlation.
Visual Analysis: Watch how the correlation shifts with changes in lag and correlation length to identify potential market dynamics between Bitcoin and Gold.
Potential Applications:
Macro Trading: Track how Bitcoin and Gold behave in relation to each other during periods of economic uncertainty or inflation.
Sentiment Analysis: Use the correlation data to understand the sentiment between digital and traditional assets.
Strategic Timing: Identify potential opportunities where Bitcoin and Gold show a strong correlation or diverge based on the lag adjustment.
Understanding Macro Trends/Correlations.
Disclaimer:
This indicator is for informational purposes only. The correlation between Bitcoin and Gold does not guarantee future performance, and users should conduct their own research and use risk management strategies when making trading decisions.
Notes: This script uses historical data, so results may vary across different timeframes.
Customization options allow users to adjust the lag and correlation length to better fit their trading strategy.
Future Enhancements: Additional Correlation Line: A second correlation line for different lengths of lag or different assets.
Color-Coding of Correlation: Future updates may include color-coded correlation strength, visually indicating positive or negative correlation more effectively.

Gold Opening 15-Min ORB INDICATOR by AdéThis indicator is designed for trading Gold (XAUUSD) during the first 15 minutes of major market openings: Asian, European, and US sessions. It highlights these key time windows, plots the high and low ranges of each session, and generates breakout-based buy/sell signals. Ideal for traders focusing on volatility at market opens.
Features:Session Windows:
Asian: 1:00–1:15 AM Barcelona time (23:00–23:15 UTC, CEST-adjusted).
European: 9:00–9:15 AM Barcelona time (07:00–07:15 UTC).
US: 3:30–3:45 PM Barcelona time (13:30–13:45 UTC).
Marked with yellow (Asian), green (Europe), and blue (US) triangles below bars.
High/Low Ranges:Plots horizontal lines showing the highest high and lowest low of each session’s first 15 minutes.Lines appear after each session ends and persist until the next day, color-coded to match the sessions.Breakout Signals:Buy (Long): Triggers when the closing price breaks above the highest high of the previous 5 bars during a session window (lime triangle above bar).Sell (Short): Triggers when the closing price breaks below the lowest low of the previous 5 bars during a session window (red triangle below bar).
Signals are restricted to the 15-minute session periods for focused trading.Usage:Timeframe: Optimized for 1-minute XAUUSD charts.Timezone: Set your chart to UTC for accurate session timing (script uses UTC internally, based on Barcelona CEST, UTC+2 in April).Strategy:
Use buy/sell signals for breakout trades during volatile market opens, with session ranges as support/resistance levels.Customization: Adjust the lookback variable (default: 5) to tweak signal sensitivity.Notes:Tested for April 2025 (CEST, UTC+2).
Adjust timestamp values if using outside daylight saving time (CET, UTC+1) or for different broker timezones.Best for scalping or short-term trades during high-volatility periods. Combine with other indicators for confirmation if desired.How to Use:Apply to a 1-minute XAUUSD chart.Watch for session markers (triangles) and breakout signals during the 15-minute windows.Use the high/low lines to gauge potential breakout targets or reversals.

Keltner Channel StrategyOverview
The Keltner Channel Strategy is a powerful trend-following and mean-reversion system that leverages the Keltner Channels, EMA crossovers, and ATR-based stop-losses to optimize trade entries and exits. This strategy has proven to be highly effective, particularly when applied to Gold (XAUUSD) and other commodities with strong trend characteristics.
📈 How It Works
This strategy incorporates two trading approaches: 1️⃣ Keltner Channel Reversal Trades – Identifies overbought and oversold conditions when price touches the outer bands.
2️⃣ Trend Following Trades – Uses the 9 EMA & 21 EMA crossover, with confirmation from the 50 EMA, to enter trades in the direction of the trend.
🔍 Entry & Exit Criteria
📊 Keltner Channel Entries (Reversal Strategy)
✅ Long Entry: When the price crosses below the lower Keltner Band (potential reversal).
✅ Short Entry: When the price crosses above the upper Keltner Band (potential reversal).
⏳ Exit Conditions:
Long positions close when price crosses back above the mid-band (EMA-based).
Short positions close when price crosses back below the mid-band (EMA-based).
📈 Trend Following Entries (Momentum Strategy)
✅ Long Entry: When the 9 EMA crosses above the 21 EMA, and price is above the 50 EMA (bullish momentum).
✅ Short Entry: When the 9 EMA crosses below the 21 EMA, and price is below the 50 EMA (bearish momentum).
⏳ Exit Conditions:
Long positions close when the 9 EMA crosses back below the 21 EMA.
Short positions close when the 9 EMA crosses back above the 21 EMA.
📌 Risk Management & Profit Targeting
ATR-based Stop-Losses:
Long trades: Stop set at 1.5x ATR below entry price.
Short trades: Stop set at 1.5x ATR above entry price.
Take-Profit Levels:
Long trades: Profit target 2x ATR above entry price.
Short trades: Profit target 2x ATR below entry price.
🚀 Why Use This Strategy?
✅ Works exceptionally well on Gold (XAUUSD) due to high volatility.
✅ Combines reversal & trend strategies for improved adaptability.
✅ Uses ATR-based risk management for dynamic position sizing.
✅ Fully automated alerts for trade entries and exits.
🔔 Alerts
This script includes automated TradingView alerts for:
🔹 Keltner Band touches (Reversal signals).
🔹 EMA crossovers (Momentum trades).
🔹 Stop-loss & Take-profit activations.
📊 Ideal Markets & Timeframes
Best for: Gold (XAUUSD), NASDAQ (NQ), Crude Oil (CL), and trending assets.
Recommended Timeframes: 15m, 1H, 4H, Daily.
⚡️ How to Use
1️⃣ Add this script to your TradingView chart.
2️⃣ Select a 15m, 1H, or 4H timeframe for optimal results.
3️⃣ Enable alerts to receive trade notifications in real time.
4️⃣ Backtest and tweak ATR settings to fit your trading style.
🚀 Optimize your Gold trading with this Keltner Channel Strategy! Let me know how it performs for you. 💰📊

Optimized Auto-Detect Strategy (MA, ATR, Trend, RSI) Overview
This script is designed for traders seeking a trend-following approach that adapts to different currency pairs (e.g., EURUSD, NZDUSD, XAUUSD). It combines moving average crossovers with ATR-based stops, optional trend filters, and RSI filters to help reduce false signals and capture larger moves.
Key Features
1. Auto-Detect Logic
- Automatically applies different moving average periods and ATR multipliers based on the symbol (e.g., XAUUSD, EURUSD, NZDUSD).
- Makes it easy to switch charts without manually adjusting parameters each time.
2. ATR-Based Stop
- Uses the Average True Range (ATR) to set dynamic stop-loss levels, adapting to each market’s volatility.
3. Optional Trend Filter
- Filters out trades if price is below the 200 SMA for longs (and above for shorts), aiming to avoid choppy, range-bound markets.
4. Optional RSI Filter
- Only enters long if RSI is above a certain threshold (e.g., 50), or short if below another threshold, reducing entries during low momentum.
5. Partial Exit & Trailing/Break-Even
- Locks in partial profit at a chosen R:R (e.g., 1:1), then either trails the remaining position or moves the stop to break-even.
- This helps capture additional gains if the trend extends beyond the initial target.
6. Customizable Parameters
- You can toggle on/off each filter (Trend, RSI) and adjust the ATR multiplier, MA periods, partial exit levels, etc.
- Allows easy optimization for different pairs or timeframes.
How to Use
1. Add to Chart: Click “Add to chart” in the Pine Editor.
2. Configure Inputs: In the script’s settings, toggle the filters you want (Trend Filter, RSI Filter, etc.) and set your desired ATR multiplier, RSI thresholds, partial exit ratio, etc.
3. Strategy Tester: Check the performance under the “Strategy Tester” tab. Adjust parameters if needed.
4. Realistic Settings: Consider adding spreads/commissions in the “Properties” tab for more accurate backtests, especially if you trade pairs with higher spreads (like XAUUSD).
Disclaimer
No Guarantee: This script does not guarantee profits. Markets are unpredictable, and results may vary with market conditions.
For Educational Purposes: Always do your own research and forward testing. Past performance does not indicate future results.

Automatic comparison of symbols depending on custom listIn the indicator settings, specify a list of tickers and the corresponding symbol for comparison (e.g. TVC:DXY). Each new list must be on a separate line. The line must begin with the symbol for comparison, then an equal sign (=), and then a list of tickers separated by commas (e.g. OANDA:XAUUSD, OANDA:XAGUSD). If the ticker selected in the chart window is not found in any of the lists, then the symbol from the first list, which is specified before the equal sign, will be used as the symbol for comparison. For example:
TVC:DXY = OANDA:XAUUSD, OANDA:XAGUSD
OANDA:BCOUSD = OANDA:SPX500USD
OANDA:SPX500USD = BINANCE:BTCUSDT
***
Автоматическое сравнение символов в зависимости от настраиваемого списка
В настройках индикатора укажите список тикеров и соответствующий символ для сравнения. Каждый новый список должен быть на отдельной строке. В начале строки должен быть указан символ для сравнения (например, TVC:DXY), затем знак равенства (=) и после него список тикеров, разделенных запятыми (например, OANDA:XAUUSD, OANDA:XAGUSD). Если выбранный в окне графика тикер не будет найден ни в одном из списков, то в качестве символа для сравнения ему будет соответствовать символ из первого списка, который указан перед знаком равенства. Например:
TVC:DXY = OANDA:XAUUSD, OANDA:XAGUSD
OANDA:BCOUSD = OANDA:SPX500USD
OANDA:SPX500USD = BINANCE:BTCUSDT
