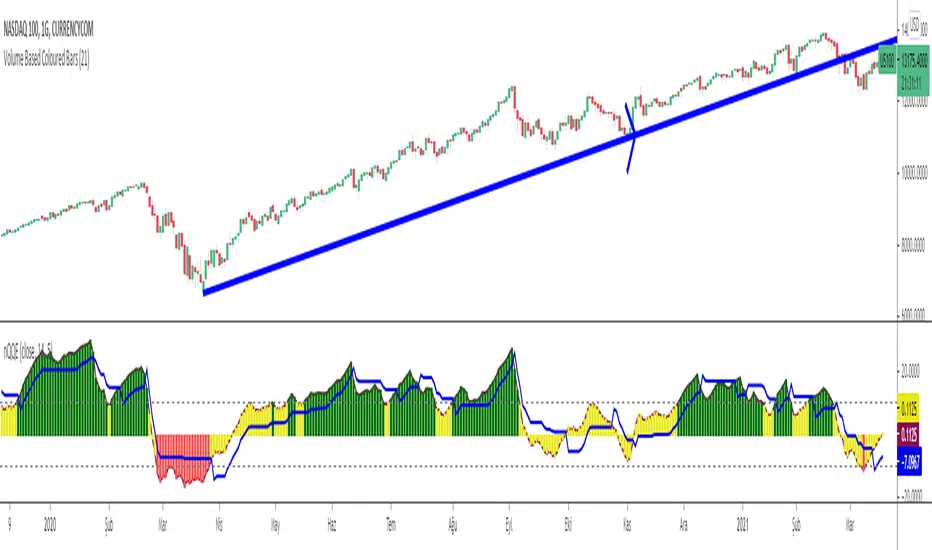
Normalized Quantitative Qualitative Estimation nQQENormalized version of Quantitative Qualitative Estimation QQE:
Normalized QQE tries to overcome the problems of false signals due to RSI divergences on the original QQE indicator.
The main purpose is to determine and ride the trend as far as possible.
So users can identify:
UPTREND : when nQQE Histogram is GREEN (nQQE is above 10)
DOWNTREND : when nQQE Histogram is RED (nQQE is below -10)
SIDEWAYS: when nQQE Histogram is YELLOW (nQQE is between -10 and 10)
Calculation is very simple;
RSI based QQE oscillates between 0-100
nQQE is simply calculated as:
nQQE=QQE-50
to make the indicator fluctuate around 0 level to get more accurate signals.
Various alarms added.
Kıvanç Özbilgiç
ابحث في النصوص البرمجية عن "中海油+10年股价涨幅"
BTC and ETH Long strategy - version 2I wrote my first article in May 2020. See below
BTC and ETH Long strategy - version1
After 6 months, it is now time to check the result of my script for the last 6 months.
XBTUSD (4H): 14/05/2020 --> 22/11/2020 = +78% in 4 trades
ETHXBT (4H): 14/05/2020 --> 22/11/2020 = +21% in 9 trades
ETHUSD (4H): 14/05/2020 --> 22/11/2020 = +90% in 6 trades
Using the signals from this strategy to trade manually has shown that this was a bit frustrating because of the low rate of winning trades.
If you have to enter 100 trades and see 75% of them failing and 25% winning, this is frustrating. For sure the strategy makes good money but it is difficult to hold this mentality.
So, I have reviewed and modified it to get a higher winning rate.
After few days of work, tests and validation, I managed to get a wining rate close to 60%.
The key element was also to decrease the number of trades by using a higher time frame. (4H candles instead of 2H candles).
- Entry in position is based on
MACD, EMA (20), SMA (100), SMA (200) moving up
AND EMA (20) > SMA (100)
AND SMA (100) > SMA (200)
- Exit the position if: Stoploss is reached OR EMA (20) crossUnder SMA (100)
The goal of this new script is to be able to follow the signals manually and only make few trades per years.
I have also validated it against some other altcoins where some are giving very good results.
Here are some results for 2020 (from 01/01/2020 until now (22/11/2020). Those results are the one I get when using 4H candles.
ETH/USD: +144% in 8 trades.
BTC/USD: +120% in 7 trades.
ETH/BTC: +33% in 9 trades.
ICX/USD: +123% in 10 trades.
LINK/USD: +155% in 11 trades.
MLN/USD: +388% in 8 trades.
ADA/USD: +180% in 7 trades.
LINK/BTC: +97% in 10 trades.
The best is that above results are without considering compound effect. If you re-invest all gains done in each new trade, this will give you the below results :)
ETH/USD: +189% in 8 trades.
BTC/USD: +260% in 7 trades.
ETH/BTC: +29% in 9 trades.
ICX/USD: +112% in 10 trades.
LINK/USD: +222% in 11 trades.
MLN/USD: +793% in 8 trades.
ADA/USD: +319% in 7 trades.
LINK/BTC: +103% in 10 trades.
As you can see, the results are good and the number of trades for 11 months is not big, which allows the trader to place orders manually.
But still, I'm lazy :), so, I have also coded this strategy in HaasScript language which allows you to automate this strategy using the HaasOnline software specialized in automated crypto trading.
I hope that this strategy will give you ideas or will be the starting point for your own strategy.
Let me know if you need more details.

Pipe Bottoms Indicator Based on Thomas Bulkowski's TheoriesPipe bottom is a great indicator of short-term bullish reversal trading. Pipe bottoms appear as 2 "spikes" on the chart after a 2 weeks price drop downtrend, which look like 2 parallel lines on the chart. Based on Bulkowski and the definition on his Patternsite, those 2 "spikes" candles can be any shape, whether doji or any other kinds, thus, wicks length or candle bodies are NOT required in this type of trends. However, a wide price range for these 2 spikes compared to other candles that appeared in 2 weeks is required, so I made sure these 2 pipe bottoms have true ranges (candle length) bigger than the average true ranges in the past 10 trading days (14 calendar days).
Then, a large price overlap must be between these 2 pipe bottoms, so I made sure that the high of either candle of the 2 pipe bottoms must be bigger than 40% of the true range added from the low of another candle, which in short, means that the high of the lower candle will at least be around the middle of the higher candle, and that will ensure price overlap. You can make this 50%, 60% or even 70% of the true range to ensure even greater price overlap, but you will find out that the signal amounts will decrease quite a lot after adjusting.
Bulkowski also suggested 1% variation of the bottom price (low) of those 2 candles, I put it 5% (0.05) personally to get more signals since I do not solely rely on this indicator, and I want more pipe bottoms to show up on my chart for screening purposes. So, feel free to adjust that number for the identification of this pattern.
Finally, the way I ensure it has been a downtrend or price drop is by checking if the price today is below the average of the last 10 trading days (14 calendar days), the price of the pipe bottoms must be below the moving averages of the past 10 trading days. I use hl2 here, feel free to change it to close or open as fit your strategy. Also, you can do this by making sure the candle close prices are decreasing in the past 10 trading days, or any other ways to ensure it's been in a downtrend, but for me, this works fine since again, this is just one of the many patterns I use, so I want more indicators to show up.
So, as you can see on the chart. Whenever the pattern fits the indicator, a small white cross will show up under the candle with "Pipe" text next to it. But do NOT rush to buy yet, because in order to satisfy the pipe bottom pattern, the current close price must be higher than the high of the pipe bottom. And you will see green arrowups when a pipe bottom occurred the last candle, and the current close price is above the high of the pipe bottoms, that would be the entry point of this indicator.
Overall it's a good pattern, especially for a trading bullish reversal after a huge price drop. You can adjust many numbers as I mentioned above to fit your needs, but make sure to add this with other indicators for your strategy, using only 1 indicator or pattern along is never a wise thing, especially in trading. Thanks guys, please like and share.

BTC VIP EMA CROSS Buy/Sell (GC & DC)EMA cross 5&10 standard-setting with add on of BUY/SELL signal ( GC & DC) which will make the traders have an indication of buy and sell easily and clearly.
An exponential moving average strategy, or EMA strategy, is used to identify the predominant trend in the market. It can also provide the support and resistance level to execute your trade. Indicators: v4 (default setting), EMA 5 10 Crossover (default setting)
Preferred Time Frame(s):15-Minute, 30-Minute, 1-Hour, 4-Hour, 1-Day
Strategy
Long Entry Rules
Enter a buy in the market if the following indicator or chart pattern takes center stage:
If the blue upward pointing arrow of the EMA 5 10 Crossover custom indicator gets aligned just somewhat below the candlesticks as seen in Fig. 1.0, the market sentiment is said to be bullish, hence a trigger to go long on the pair of interest.
If the light blue line of the custom indicator gets outlined just below price bars as illustrated in Fig. 1.0, price is said to be pushed somewhat higher i.e. a trigger to buy the asset of focus.
Exit Strategy/Take Profit for Buy Entry
Exit or take profit if the following rules or conditions takes precedence:
If the red downward pointing arrow of the EMA 5 10 Crossover custom indicator forms above price bars as depicted in Fig. 1.0 while a buy signal is ongoing in the market, a possible price dip is said to be looming, as such an exit or take profit is advised.
If the red line of the custom indicator forms above the candlestick during a bullish trend, it is a pointer to a possible price dip, hence an exit or take profit is advised.

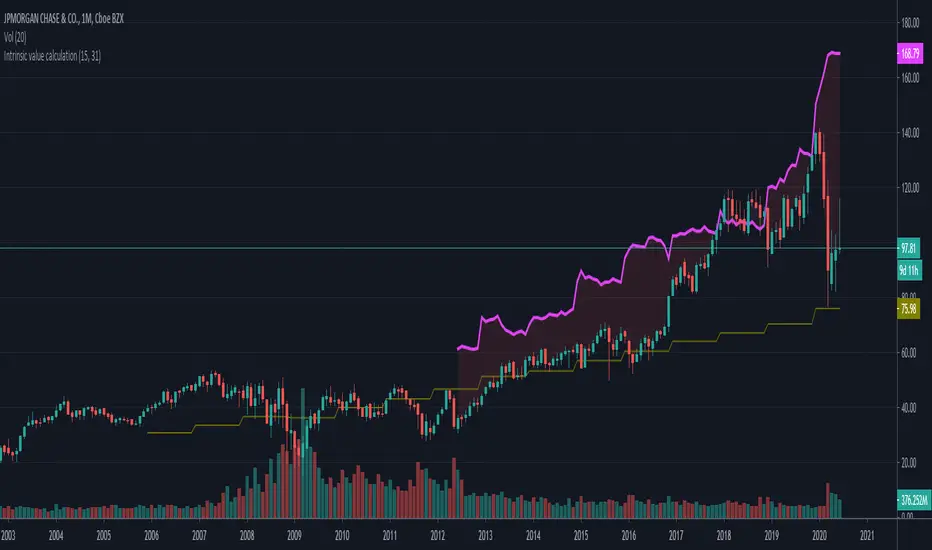
Intrinsic value calculation Intrinsic value calculator based on Warren Buffet's and Ben Graham's work
In value investing determing the true value of a COMPANY instead of a stock price is crucial.
This little indicator shows the "Intrinsic value" of the choosen stock meaning the value of the stock in 10 years time. Calculation is based on historical book value's average annual growth rate and dividends paid.
Since this is about long therm investing, use monthly charts.
"Intrinsic value can be defined simply: It is the discounted value of the cash that can be taken out of a business during its remaining life.”
– Warren Buffett
One way to calculate that is by the growth in per share book value and dividends taken in the forseeable future (10 years) than discount it with the prevailing 10 year note's rate.
In the inputs you have to set 2 variables:
1. How many years back you have the first data for book value per share available?
2. What was the per share book value that year?
(Bookvalue is ploted in olive colour and you can get the oldest one if you move your cursor over the latest data on the left)
CAUTION! You have to reenter it for every stock you analyse as this is stock-specific data!
After setting the input data, you will see the "Intrinsic Value"'s pink curve ploted over the price chart.
If the price is well below the pink line, the company is undervalued and can be a possible applicant for long therm investment.
Margin of safety: when the current price is 50% below the intrinsic value that means a 10% yearly growth potential (100% growth in 10 years) or a 100% margin of safety.
I am a beginer in Pine so please excuse my coding...
If anybody knows hot to extract historical data from 15 years ago, please share it with me, so I can automate the whole calculation without inputs necessary.
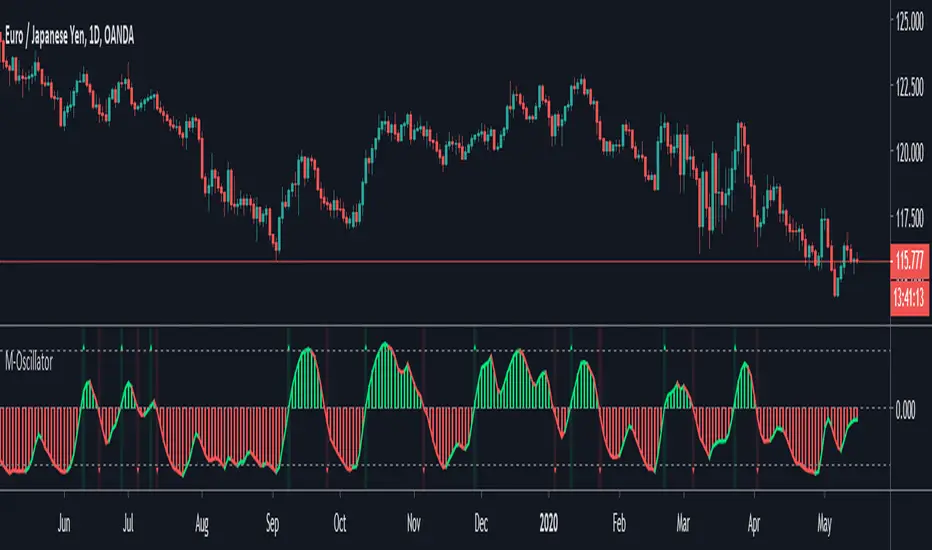
M-OscillatorM-Oscillator developed By Mohamed Fawzy, MFTA, CFTe
as Written in IFTA Journal 2018 Edition
more info : ifta.org
Interpretation
• M-Oscillator is a bounded oscillator that moves between (-14) and (+14),
• Movement above 10 is considered overbought, and movement below -10 is oversold.
Overbought/Oversold rule:
• Buy when the M-Oscillator violates the (-10) level to the downside and crosses back to the upside.
• Sell when the M-Oscillator crosses above the (+10) level and crosses back to the downside.
Crossover on Extreme Levels
• Sell signals are triggered when the M-Oscillator crosses its signal line above (13), which indicates an extreme market condition
• Buy signals are triggered when the M-Oscillator crosses its signal line below (- 13)
2-Period RSI strategy (with filter)2-period RSI strategy backtest described in several books of the trader Larry Connors . This strategy uses a 2 periods RSI , one slow arithmetic moving average and one fast arithmetic moving average.
Entry signal:
- RSI 2 value below oversold level (Larry Connors usually sets oversold to be below 5, but other authors prefer to work below 10 due to the higher number of signals).
- Closing above the slow average (200 periods).
- Entry at closing of candle or opening of next candle.
Exit signal:
- Occurs when the candlestick closes above the fast average (the most common fast average is 5 periods, but some traders also suggest the 10 period average).
Entry Filter (modification made by me):
- Applied an RSI2 arithmetic moving average to smooth out oscillations.
- Entered only when RSI2 is below oversold level and RSI2 moving average is below 30.
* NOTE: In the stocks that I evaluate daily the averages of 4 and 6 periods work very well as a filter.
Comments:
This strategy works very well in Daily charts but can be applied in other chart times as well. As this is a strategy to catch market fluctuations, it presents different results with different stocks.
I have been applying this strategy to the stocks of the Brazilian market (BOVESPA) and have enjoyed the result. Every day I evaluate the stocks that are generating entry signals and choose which one to trade based on the stocks with the highest Profit Value.
The RSI 2 averaging filter probably will reduce profit of the backtests because reduces the number of signals, but the Profit Value will usually increase. For me this was a good thing because without the filter, this strategy usually shows more signals than I have capital to allocate.
Before entering a trade I look at which fast average the paper has the highest Profit Value and then I use this average as my output signal for that trade (this change has greatly improved the result of the outputs).
This strategy does not use Stop Loss because normally Stop Loss decreases effectiveness (profit). In any case, the option to apply a percentage Stop Loss if desired is added in the script. As the strategy does not use stop, extra caution with risk management is advisable. I advise not to allocate more than 20% of the trade capital in the same operation.
I'm still studying ways to improve this strategy, but so far this is the best setup I've found. Suggestions are always welcome and we can test to see if they improve the backtest result.
Good luck and good trades.
================================================
Backtest das estratégia do IFR de 2 períodos descrita em varios livros do trader Larry Connors . Esta estratégia usa um IFR de 2 períodos, uma média movel aritmética lenta e uma média movel aritmética rápida.
Sinal de entrada:
- Valor do IFR 2 abaixo do nível de sobrevenda (Larry Connors usualmente define sobrevenda sendo abaixo de 5, mas outros autores preferem trabalhar abaixo de 10 devido ao maior número de sinais).
- Fechamento acima da média lenta (200 períodos).
- Realizado a compra no fechamento do candle ou na abertura do candle seguinte.
Sinal de saída:
- Ocorre quando o candle fecha acima da média rápida (a média rápida mais comum é a de 5 períodos, mas alguns traders sugerem também a média de 10 períodos).
Filtro para entrada (modificação feita por mim):
- Aplicado uma média móvel aritmética do IFR2 para suavisar as oscilações.
- Realizado a entrada apenas quando o IFR2 está abaixo do nível de sobrevenda e a média móvel do IFR2 está abaixo de 30.
*OBS: nos ativos que avalio diariamente as médias de 4 e 6 períodos funcionam muito bem como filtro.
Comentários:
Esta estratégia funciona muito bem no tempo gráfico Diário mas pode ser aplicada tambem em outros tempos gráficos. Como trata-se de uma estratégia para pegar oscilações do mercado, ela apresenta diferentes resultados com diferentes ativos.
Eu venho aplicando esta estratégia nos ativos do mercado brasileiro (BOVESPA) e tenho gostado do resultado. Diariamente eu avalio os papeis que estão gerando entrada e escolho qual irei realizar o trade baseado nos papeis que apresentam maior Profit Value.
O filtro da média do IFR 2 reduz o lucro nos backtests pois reduz também a quantidade de sinais, mas em compensação o Profit Value irá normalmente aumentar. Para mim isto foi algo positivo pois, sem o filtro, normalmente esta estratégia apresenta mais sinais do que possuo capital para alocar.
Antes de entrar em um trade eu olho em qual média rápida o papel apresenta maior Profit Value e então eu utilizo está média como meu sinal de saída para aquele trade (esta mudança tem melhorado bastante o resultado das saídas).
Está estratégia não utiliza Stop Loss pois normalmente o Stop Loss diminui a eficácia (lucro). De qualquer maneira, foi acrescentado no script a opção de aplicar um Stop Loss percentual caso seja desejado. Como a estratégia não utiliza stop é aconselhável um cuidado redobrado com o gerenciamento de risco. Eu aconselho não alocar mais de 20% do capital de trade em uma mesma operação.
Ainda estou estudando formas de melhorar esta estratégia, mas até o momento está é a melhor configuração que encontrei. Sugestões são sempre bem vindas e podemos testar para verificar se melhoram o resultado do backtest.
Boa sorte e bons trades.

Pinescript v3 Compatibility Framework (v4 Migration Tool)Pinescript v3 Compatibility Framework (v4 Migration Tool)
This code makes most v3 scripts work in v4 with only a few minor changes below. Place the framework code before the first input statement.
You can totally delete all comments.
Pros:
- to port to v4 you only need to make a few simple changes, not affecting the core v3 code functionality
Cons:
- without #include - large redundant code block, but can be reduced as needed
- no proper syntax highlighting, intellisence for substitute constant names
Make the following changes in v3 script:
1. standard types can't be var names, color_transp can't be in a function, rename in v3 script:
color() => color.new()
bool => bool_
integer => integer_
float => float_
string => string_
2. init na requires explicit type declaration
float a = na
color col = na
3. persistent var init (optional):
s = na
s := nz(s , s) // or s := na(s ) ? 0 : s
// can be replaced with var s
var s = 0
s := s + 1
___________________________________________________________
Key features of Pinescript v4 (FYI):
1. optional explicit type declaration/conversion (you still can't cast series to int)
float s
2. persistent var modifier
var s
var float s
3. string series - persistent strings now can be used in cond and output to screen dynamically
4. label and line objects
- can be dynamically created, deleted, modified using get/set functions, moved before/after the current bar
- can be in if or a function unlike plot
- max limit: 50-55 label, and 50-55 line drawing objects in addition to already existing plots - both not affected by max plot outputs 64
- can only be used in the main chart
- can serve as the only output function - at least one is required: plot, barcolor, line, label etc.
- dynamic var values (including strings) can be output to screen as text using label.new and to_string
str = close >= open ? "up" : "down"
label.new(bar_index, high, text=str)
col = close >= open ? color.green : color.red
label.new(bar_index, na, "close = " + tostring(close), color=col, textcolor=color.white, style=label.style_labeldown, yloc=yloc.abovebar)
// create new objects, delete old ones
l = line.new(bar_index, high, bar_index , low , width=4)
line.delete(l )
// free object buffer by deleting old objects first, then create new ones
var l = na
line.delete(l)
l = line.new(bar_index, high, bar_index , low , width=4)

Turtle Trade Channels by KıvanÇ fr3762his trend following system was designed by Dennis Gartman and Bill Eckhart, and relies on breakouts of historical highs and lows to take and close trades: it is the complete opposite to the "buy low and sell high" approach. This trend following system was taught to a group of average and normal individuals, and almost everyone turned into a profitable trader.
The main rule is "Trade an N-day breakout and take profits when an M-day high or low is breached (N must me above M)". Examples:
Buy a 10-day breakout and close the trade when price action reaches a 5-day low.
Go short a 20-day breakout and close the trade when price action reaches a 10-day high.
In this indicator, the red line is the trading line, and the dotted blue line is the exit line. Original system is:
Go long when the trading line crosses below close price
Go short when the trading line rosses above close price
Exit long positions when the price touches the exit line
Exit short positions when the price touches the exit line
Recommended initial stop-loss is ATR * 2 from the opening price. Default system parameters were 20,10 and 55,20.
Original Turtle Rules:
To trade exactly like the turtles did, you need to set up two indicators representing the main and the failsafe system.
Set up the main indicator with TradePeriod = 20 and StopPeriod = 10 (A.k.a S1)
Set up the failsafe indicator with TradePeriod = 55 and StopPeriod = 20 using a different color. (A.k.a S2)
The entry strategy using S1 is as follows
Buy 20-day breakouts using S1 only if last signaled trade was a loss.
Sell 20-day breakouts using S1 only if last signaled trade was a loss.
If last signaled trade by S1 was a win, you shouldn't trade -Irregardless of the direction or if you traded last signal it or not-
The entry strategy using S2 is as follows:
Buy 55-day breakouts only if you ignored last S1 signal and the market is rallying without you
Sell 55-day breakouts only if you ignored last S1 signal and the market is pluging without you
The turtles had a progressive position sizing approach that boosted their winnings. Once a trading decision has been made you should...
Developers: Dennis Gartman and Bill Eckhart
İndikatörü geliştiren: Dennis Gartman and Bill Eckhart

Amazing Crossover System - 100+ pips per day!I got the main concept for this system on another site. While I have made one important change, I must stress that the heart of this system was created by someone else! We must give credit where credit is due!
Y'all know baby pips. @ForexPhantom published about this system and did both back and forward test around 10 years ago.
I found it on the sit and now I put it to code to see how it performs. I assume 10 points spread for every trade. I use Renesource or AxiTrader to get the low spreads.
There are 2 mods, the single trades and constant trading on the direction.
Main concept
Indicators
5 EMA -- YELLOW
10 EMA -- RED
RSI (10 - Apply to Median Price: HL/2) -- One level at 50.
TIME FRAME
1 Hour Only (very important!)
PAIRS
Virtually any pair seems to work as this is strictly technical analysis.
I recommend sticking to the main currencies and avoiding cross currencies (just his preference).
WHEN TO ENTER A TRADE
Enter LONG when the Yellow EMA crosses the Red EMA from underneath.
RSI must be approaching 50 from the BOTTOM and cross 50 to warrant entry.
Enter SHORT when the Yellow EMA crosses the Red EMA from the top.
RSI must be approaching 50 from the TOP and cross 50 to warrant entry.
I've attached a picture which demonstrates all these conditions.
That's it!
f.bpcdn.co

Trend Score by KIVANÇ fr3762Trend Score compares close prices between last close with previous closes by a certain period of time.
It's like momentum but gives a score +1 when close price is equal to or above (defaultly) 10 bars ago and gives a score of -1 when below.
calculation continues from default length to the 2 times of length.
Defaultly (for 10 bars length)
If Trend Score converges to 10; that means there's a strong uptrend
conversely if Trend Score converges to -10; that means a strong downtrend market is on.

JSE Wyckoff Wave Volume Code// The Stock Market Institute (SMI) describes an propriety indicator the "SMI Wyckoff Wave" for US Stocks. This code is an attempt to make a Wyckoff Wave for the Johannesburg Stock Exchange (JSE).
// The JSE Wyckoff Wave is in a separate code. This is the code for the volume of the wave. Please see code for the JSE Wyckoff Wave which goes with this indicator.
//
// The Wave presents a normalized price for the 10 selected stocks (An Index for the 10 stocks).
// The theory is to select stocks that are widely held, market leaders, actively traded and participate in important market moves.
// This is only my attempt to select 10 stocks and a different selection can be made.
// I am not certain how SMI determine their weightings but what I have done it to equalize the Rand value of the stock volumne so that moves are of equal magnitude.
// The then provides a view of the overall condition of the market and volume flow in the market.
//
// I have used the September 2018 price to normalize the stock price for the 10 selected stocks based. The stocks and weightings can be changed periodically depending on the performance and leadership.
//
// Please, let me know if there is a better work around this.
The stocks and their weightings are:
"JSE:BTI"/0.79
"JSE:SHP"/2.87
"JSE:NPN"/0.18
"JSE:AGL"/1.96
"JSE:SOL"/1.0
"JSE:CFR"/4.42
"JSE:MND"/1.40
"JSE:MTN"/7.63
"JSE:SLM"/7.29
"JSE:FSR"/8.25

JSE Wyckoff WaveThe Stock Market Institute (SMI) describes an propriety indicator the "SMI Wyckoff Wave" for US Stocks. This code is an attempt to make a Wyckoff Wave for the Johannesburg Stock Exchange (JSE). Once the wave has been established the volume can also be calculated. Please see code for the JSE Wyckoff Wave Volume which goes with this indicator.
The Wave presents a normalized price for the 10 selected stocks (An Index for the 10 stocks). The theory is to select stocks that are widely held, market leaders, actively traded and participate in important market moves. This is only my attempt to select 10 stocks and a different selection can be made. I am not certain how SMI determine their weightings but what I have done it to equalize the Rand value of the stock so that moves are of equal magnitude. The then provides a view of the overall condition of the market and volume flow in the market.
I have used the September 2018 price to normalize the stock price for the 10 selected stocks based. The stocks and weightings can be changed periodically depending on the performance and leadership.
Most Indecies when constructed assume that all high prices and all low prices happen at the same time and therefor inflate the wicks of the bars. To make the wave more representatives for the SMI Wyckoff Wave the price is determined on the 5 minute timeframe which removes this bias. However, TradingView does not calculate properly when selecting a lower timeframe than in current period. A work around is to call the sma of the highs and add these which provides more realistic tails. Please, let me know if there is a better work around this.
The stocks and their weightings are:
"JSE:BTI"*0.79
"JSE:SHP"*2.87
"JSE:NPN"*0.18
"JSE:AGL"*1.96
"JSE:SOL"*1.0
"JSE:CFR"*4.42
"JSE:MND"*1.40
"JSE:MTN"*7.63
"JSE:SLM"*7.29
"JSE:FSR"*8.25

OHLC Daily Resolution BandsShout out to nPE- for the idea.
Bands made with stdev from 10 day OHLC.
Keeps resolution to daily, so you can use bands as daily pivots for day trading.
Upper band 1=yesterday close + 0.5 std(ohlc,10)
Upper band 1=yesterday close + 1 std(ohlc,10)
Mid=yesterday close
Lower band 1=yesterday close - 0.5 std(ohlc,10)
Lower band 2=yesterday close - 1 std(ohlc,1

XPloRR MA-Buy ATR-Trailing-Stop Long Term Strategy Beating B&HXPloRR MA-Buy ATR-MA-Trailing-Stop Strategy
Long term MA Trailing Stop strategy to beat Buy&Hold strategy
None of the strategies that I tested can beat the long term Buy&Hold strategy. That's the reason why I wrote this strategy.
Purpose: beat Buy&Hold strategy with around 10 trades. 100% capitalize sold trade into new trade.
My buy strategy is triggered by the EMA(blue) crossing over the SMA curve(orange).
My sell strategy is triggered by another EMA(lime) of the close value crossing the trailing stop(green) value.
The trailing stop value(green) is set to a multiple of the ATR(15) value.
ATR(15) is the SMA(15) value of the difference between high and low values.
Every stock has it's own "DNA", so first thing to do is find the right parameters to get the best strategy values voor EMA, SMA and Trailing Stop.
Then keep using these parameter for future buy/sell signals only for that particular stock.
Do the same for other stocks.
Here are the parameters:
Exponential MA: buy trigger when crossing over the SMA value (use values between 11-50)
Simple MA: buy trigger when EMA crosses over the SMA value (use values between 20 and 200)
Stop EMA: sell trigger when Stop EMA of close value crosses under the trailing stop value (use values between 8 and 16)
Trailing Stop #ATR: defines the trailing stop value as a multiple of the ATR(15) value
Example parameters for different stocks (Start capital: 1000, Order=100% of equity, Period 1/1/2005 to now):
BAR(Barco): EMA=11, SMA=82, StopEMA=12, Stop#ATR=9
Buy&HoldProfit: 45.82%, NetProfit: 294.7%, #Trades:8, %Profit:62.5%, ProfitFactor: 12.539
AAPL(Apple): EMA=12, SMA=45, StopEMA=12, Stop#ATR=6
Buy&HoldProfit: 2925.86%, NetProfit: 4035.92%, #Trades:10, %Profit:60%, ProfitFactor: 6.36
BEKB(Bekaert): EMA=12, SMA=42, StopEMA=12, Stop#ATR=7
Buy&HoldProfit: 81.11%, NetProfit: 521.37%, #Trades:10, %Profit:60%, ProfitFactor: 2.617
SOLB(Solvay): EMA=12, SMA=63, StopEMA=11, Stop#ATR=8
Buy&HoldProfit: 43.61%, NetProfit: 151.4%, #Trades:8, %Profit:75%, ProfitFactor: 3.794
PHIA(Philips): EMA=11, SMA=80, StopEMA=8, Stop#ATR=10
Buy&HoldProfit: 56.79%, NetProfit: 198.46%, #Trades:6, %Profit:83.33%, ProfitFactor: 23.07
I am very curious to see the parameters for your stocks and please make suggestions to improve this strategy.

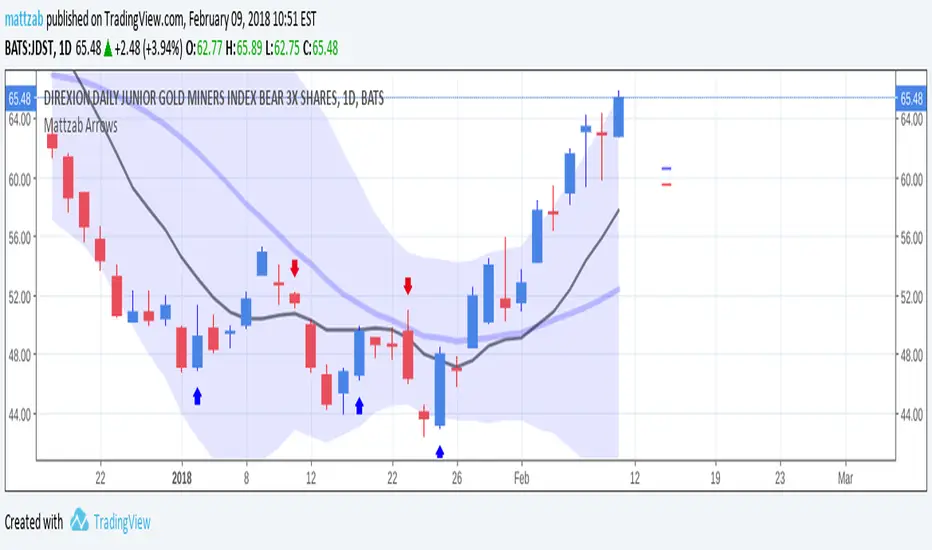
Mattzab ArrowsMattzab Arrows
THE BASICS
Buy and Sell Signal Arrows
Tack Marks to show how close the next opposite arrow might be- showing possible trend reversals
Standard Bollinger Bands
10-Day SMA Line
Configurable
Open Source
THE NITTY GRITTY
For starters, all values listed below can be changed in the settings. Length of time, as well as source, can be changed. For the Hidden EMA, this can be made visible by increasing its transparency.
ARROWS
The buy and sell signal arrows are based on price and MACD histogram.
The MACD settings are as follows: 10 day fast EMA , 20 day slow EMA , 5 day SMA signal smoothing. Instead of close price, we are using the average point of the day's high, low, and close.
For the arrows, current price and yesterday's price are using hl2 for high/low average.
A BUY arrow is created when:
Current Price IS GREATER THAN Previous Price _AND_ Current MACD Histogram IS GREATER THAN Previous MACD Histogram.
Important Note! Because the MACD Histogram repaints, the buy arrows may appear, then disappear later in the day, if the MACD changes. Check on the changelog to see if I've fixed it by the time you're reading this. (TradingView doesn't let you edit the description after it's been posted)
A SELL arrow is created when:
Current Price IS LESS THAN Previous Price _AND_ Current MACD Histogram IS LESS THAN Yesterday's MACD Histogram _AND_ Close Price is below _EITHER_ the Hidden EMA (default set to 4) _OR_ the Visible SMA (Default set to 10, which is the black line).
The hidden EMA can be made visible by increasing it's transparency in the Style tab.
Including the requirement to only sell if the standard conditions are met, PLUS being below one of those moving average lines, helps to prevent false sell arrows and repainting.
TACK MARKS
The Red Tack is the threshold, or barrier, for the next arrow. It will not move. It is based on previous High/Low/Close Price + MACD.
The Blue Tack is the current point in space for our average Price and MACD Delta Values. It will move throughout the day (or hour or minute depending on your resolution). The Blue Tack will give you an indication of how close or how far from the reversal threshold (Red Tack) the ticker is at that point.
While the Blue Tack is ABOVE Red, the most recent signal arrow will be a buy, and we are in a buy/hold period.
While the Blue Tack is BELOW Red, the most recent signal arrow will be a sell, and we are in a sell/wait period.
If the Blue Tack crosses above or below Red, you'll get the next arrow.
MOVING AVERAGE LINES
There are three moving average lines in this indicator.
The first is black, and is by default a 10-Day Simple Moving Average Line.
This black line is a good safeguard against selling too early. This is a good support line and that's how I use it.
The second is invisible, but can be made visible in the Styling, and is by default a 4-Day Exponential Moving Average Line
The third is the blue 20-Day Bollinger Band line.
BOLLINGER BANDS
The Bollinger Bands are unmodified and are just a background indicator for your use. If you prefer not to see the Bollinger Bands , change their transparency to 0% to hide them. I've cleaned up the Bollinger Bands to make the indicator as a whole- easier on the eyes.
Please leave feedback on how the script works for you, if you run into problems, if you have any changes you'd like to see, etc.
MACDouble + RSI (rec. 15min-2hr intrv) Uses two sets of MACD plus an RSI to either long or short. All three indicators trigger buy/sell as one (ie it's not 'IF MACD1 OR MACD2 OR RSI > 1 = buy", its more like "IF 1 AND 2 AND RSI=buy", all 3 match required for trigger)
The MACD inputs should be tweaked depending on timeframe and what you are trading. If you are doing 1, 3, 5 min or real frequent trading then 21/44/20 and 32/66/29 or other high value MACDs should be considered. If you are doing longer intervals like 2, 3, 4hr then consider 9/19/9 and 21/44/20 for MACDs (experiment! I picked these example #s randomly).
Ideal usage for the MACD sets is to have MACD2 inputs at around 1.5x, 2x, or 3x MACD1's inputs.
Other settings to consider: try having fastlength1=macdlength1 and then (fastlength2 = macdlength2 - 2). Like 10/26/10 and 23/48/20. This seems to increase net profit since it is more likely to trigger before major price moves, but may decrease profitable trade %. Conversely, consider FL1=MCDL1 and FL2 = MCDL2 + (FL2 * 0.5). Example: 10/26/10 and 22/48/30 this can increase profitable trade %, though may cost some net profit.
Feel free to message me with suggestions or questions.

Kay_BBandsV3This is the 3rd version of Kay_BBands.
When +DI (Directional Index ) is above -DI , then Upper band will be visible and vice-versa.
This is when the ADX is above the threshold. 28 is the default in this version. I found its more appealing in 5M time frame.
BLUE - ADX under 10
GREEN - Uptrend, ADX over 10
RED - Downtrend, ADX over 10
Use it with another band with setting 20, 0.6 deviation. Prices keeping above or below the 2nd bands upper or lower bounds shows trending conditions.
I didn't know how to update the old script so published it again.
Changes - :
1) Updated default settings for the indicator
2) ADX setting are now DI (28), ADX (10), adx level to check is 10.
3) IMPORTANT one - When DI is up/down, lower/upper band will also have color (more visible that way.)
Play around the settings.. It really eliminates extra indicator checking visually... Please like if you think idea is good.

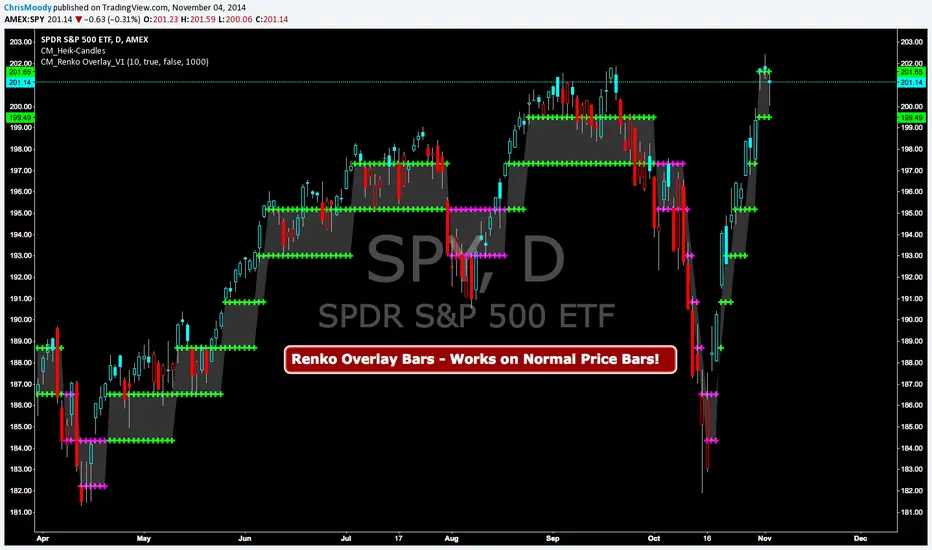
CM Renko Overlay BarsCM_Renko Overlay Bars V1
Overlays Renko Bars on Regular Price Bars.
Default Renko plot is based on Average True Range. Look Back period adjustable in Inputs Tab.
If you Choose to use "Traditional" Renko bars and pick the Size of the Renko Bars the please read below.
Value in Input Tab is multiplied by .001 (To work on Forex)
1 = 10 pips on EURUSD - 1 X .001 = .001 or 10 Pips
10 = .01 or 100 Pips
1000 = 1 point to the left of decimal. 1 Point in Stocks etc.
10000 = 10 Points on Stocks etc.
***V2 will fix this issue.
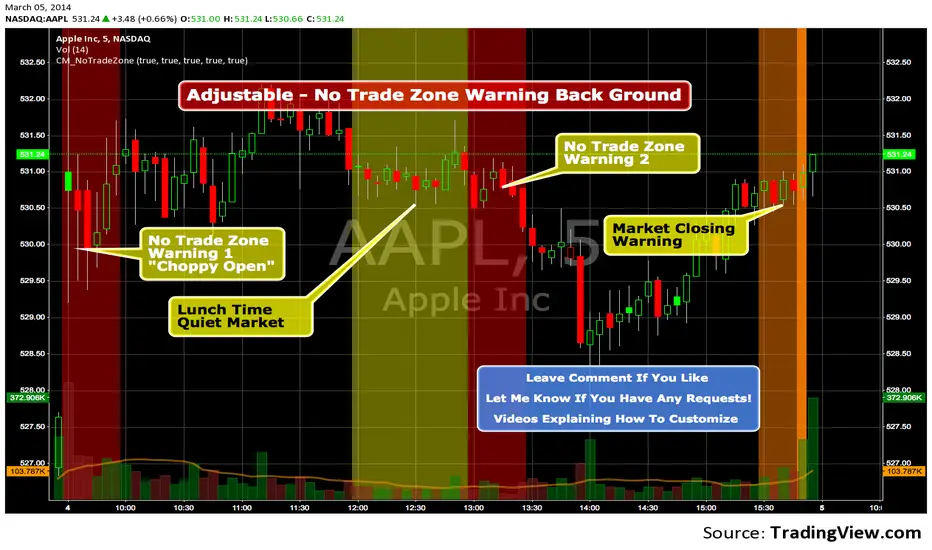
Custom Indicator - No Trade Zone Warning Back Ground Highlights!Years ago I did an analysis of my trades. Every period of the day was profitable except for two. From 10:00-1030, and 1:00 to 1:30. (I was actively Day Trading Futures) Imagine a vertical graph broken down in to 30 minute time segments. I had nice Green bars in every time slot (Showing Net Profits), and HUGE Red Bars from 10 to 10:30 and 1 to 1:30. After analysis I found I made consistent profits at session open, but then I would enter in to bad setups around 10 to make more money. I also found after I took lunch when I came back at 1:00 I would force trades instead of patiently waiting for a great trade setup. I created an indicator that plotted a red background around those times telling me I was not allowed to enter a trade. Profits went up!!! Details on How to adjust times are in 1st Post. You can adjust times and colors to meet your own trading needs.
Trend Following $BTC - Multi-Timeframe Structure + ReversTREND FOLLOWING STRATEGY - MULTI-TIMEFRAME STRUCTURE BREAKOUT SYSTEM
Strategy Overview
This is an enhanced Turtle Trading system designed for cryptocurrency spot trading. It combines Donchian Channel breakouts with multi-timeframe structure filtering and ATR-based dynamic risk management. The strategy trades both long and short positions using reverse signal exits to maximize trend capture.
Core Features
Multi-Timeframe Structure Filtering
The strategy uses Swing High/Low analysis to identify market structure trends. You can customize the structure timeframe (default: 3 minutes) to match your trading style. Only enters trades aligned with the identified trend direction, avoiding counter-trend positions that often lead to losses.
Reverse Signal Exit System
Instead of using fixed stop-losses or time-based exits, this strategy exits positions only when a reverse entry signal triggers. This approach maximizes trend profits and reduces premature exits during normal market retracements.
ATR Dynamic Pyramiding
Automatically adds positions when price moves 0.5 ATR in your favor. Supports up to 2 units maximum (adjustable). This pyramid scaling enhances profitability during strong trends while maintaining disciplined risk management.
Complete Risk Management
Fixed position sizing at 5000 USD per unit. Includes realistic commission fees of 0.06% (Binance spot rate). Initial capital set at 10,000 USD. All backtest parameters reflect real-world trading conditions.
Trading Logic
Entry Conditions
Long Entry: Close price breaks above the 20-period high AND structure trend is bullish (price breaks above Swing High)
Short Entry: Close price breaks below the 20-period low AND structure trend is bearish (price breaks below Swing Low)
Position Scaling
Long positions: Add when price rises 0.5 ATR or more
Short positions: Add when price falls 0.5 ATR or more
Maximum 2 units including initial entry
Exit Conditions
Long Exit: Triggers when short entry signal appears (price breaks 20-period low + structure turns bearish)
Short Exit: Triggers when long entry signal appears (price breaks 20-period high + structure turns bullish)
Default Parameters
Channel Settings
Entry Channel Period: 20 (Donchian Channel breakout period)
Exit Channel Period: 10 (reserved parameter)
ATR Settings
ATR Period: 20
Stop Loss ATR Multiplier: 2.0
Add Position ATR Multiplier: 0.5
Structure Filter
Swing Length: 300 (Swing High/Low calculation period)
Structure Timeframe: 3 minutes
Adjust these based on your trading timeframe and asset volatility
Position Management
Maximum Units: 2 (including initial entry)
Capital Per Unit: 5000 USD
Visualization Features
Background Colors
Light Green: Bullish market structure
Light Red: Bearish market structure
Dark Green: Long position entry
Dark Red: Short position entry
Optional Display Elements (Default: OFF)
Entry and exit channel lines
Structure high/low reference lines
ATR stop-loss indicator
Next position add level
Entry/exit labels
Alert Message Format
The strategy sends notifications with the following format:
Entry: "5m Long EP:90450.50"
Add Position: "15m Add Long 2/2 EP:91000.25"
Exit: "5m Close Long Reverse Signal"
Where the first part shows your current chart timeframe and EP indicates Entry Price
Backtest Settings
Capital Allocation
Initial Capital: 10,000 USD
Per Entry: 5,000 USD (split into 2 potential entries)
Leverage: 0x (spot trading only)
Trading Costs
Commission: 0.06% (Binance spot VIP0 rate)
Slippage: 0 (adjust based on your experience)
Best Use Cases
Ideal Scenarios
Trending markets with clear directional movement
Moderate to high volatility assets
Timeframes from 1-minute to 4-hour charts
Best suited for major cryptocurrencies with good liquidity
Not Recommended For
Highly volatile choppy/ranging markets
Low liquidity small-cap coins
Extreme market conditions or black swan events
Usage Recommendations
Timeframe Guidelines
1-5 minute charts: Use for scalping, consider Swing Length 100-160
15-30 minute charts: Good for short-term trading, Swing Length 50-100
1-4 hour charts: Suitable for swing trading, Swing Length 20-50
Optimization Tips
Always backtest on historical data before live trading
Adjust swing length based on asset volatility and your timeframe
Different cryptocurrencies may require different parameter settings
Enable visualization options initially to understand entry/exit points
Monitor win rate and drawdown during backtesting
Technical Details
Built on Pine Script v6
No repainting - uses proper bar referencing with offset
Prevents lookahead bias with lookahead=off parameter
Strategy mode with accurate commission and slippage modeling
Multi-timeframe security function for structure analysis
Proper position state tracking to avoid duplicate signals
Risk Disclaimer
This strategy is provided for educational and research purposes only. Past performance does not guarantee future results. Backtesting results may differ from live trading due to slippage, execution delays, and changing market conditions. The strategy performs best in trending markets and may experience drawdowns during ranging conditions. Always practice proper risk management and never risk more than you can afford to lose. It is recommended to paper trade first and start with small position sizes when going live.
How to Use
Add the strategy to your TradingView chart
Select your desired timeframe (1m to 4h recommended)
Adjust parameters based on your risk tolerance and trading style
Review backtest results in the Strategy Tester tab
Set up alerts for automated notifications
Consider paper trading before risking real capital
Tags
Trend Following, Turtle Trading, Donchian Channel, Structure Breakout, ATR, Cryptocurrency, Spot Trading, Risk Management, Pyramiding, Multi-Timeframe Analysis
---
Strategy Name: Trend Following BTC
Version: v1.0
Pine Script Version: v6
Last Updated: December 2025

Trend Following $ZEC - Multi-Timeframe Structure Filter + Revers# Trend Following CRYPTOCAP:ZEC - Strategy Guide
## 📊 Strategy Overview
Trend Following CRYPTOCAP:ZEC is an enhanced Turtle Trading system designed for cryptocurrency spot trading, combining Donchian Channel breakouts, multi-timeframe structure filtering, and ATR-based dynamic risk management for both long and short positions.
---
## 🎯 Core Features
1. Multi-Timeframe Structure Filtering
- Uses Swing High/Low to identify market structure
- Customizable structure timeframe (default: 1 minute)
- Only enters trades in the direction of the trend, avoiding counter-trend positions
2. Reverse Signal Exit
- No fixed stop-loss or fixed-period exits
- Exits only when a reverse entry signal triggers
- Maximizes trend profits, reduces premature exits
3. ATR Dynamic Pyramiding
- Adds positions when price moves 0.5 ATR in favorable direction
- Supports up to 2 units maximum (adjustable)
- Pyramid scaling to enhance profitability
4. Complete Risk Management
- Fixed position size (5000 USD per unit)
- Commission fee 0.06% (Binance spot rate)
- Initial capital 10,000 USD
---
## 📈 Trading Logic
Entry Conditions
✅ Long Entry:
- Close price breaks above 20-period high
- Structure trend is bullish (price breaks above Swing High)
✅ Short Entry:
- Close price breaks below 20-period low
- Structure trend is bearish (price breaks below Swing Low)
Add Position Conditions
- Long: Price rises ≥ 0.5 ATR
- Short: Price falls ≥ 0.5 ATR
- Maximum 2 units including initial entry
Exit Conditions
- Long Exit: When short entry signal triggers (price breaks 20-period low + structure turns bearish)
- Short Exit: When long entry signal triggers (price breaks 20-period high + structure turns bullish)
---
## ⚙️ Parameter Settings
Channel Settings
- Entry Channel Period: 20 (Donchian Channel breakout period)
- Exit Channel Period: 10 (reserved parameter, actually uses reverse signal exit)
ATR Settings
- ATR Period: 20
- Stop Loss ATR Multiplier: 2.0 (reserved parameter)
- Add Position ATR Multiplier: 0.5
Structure Filter
- Swing Length: 160 (Swing High/Low calculation period)
- Structure Timeframe: 1 minute (can change to 5/15/60, etc.)
Position Management
- Maximum Units: 2 (including initial entry)
- Capital Per Unit: 5000 USD
---
## 🎨 Visualization Features
Background Colors
- Light Green: Bullish structure
- Light Red: Bearish structure
- Dark Green: Long entry
- Dark Red: Short entry
Optional Display (Default: OFF)
- Entry/exit channel lines
- Structure high/low lines
- ATR stop-loss line
- Next add position indicator
- Entry/exit labels
---
## 📱 Alert Message Format
Strategy sends notifications on entry/exit with the following format:
- Entry: `1m Long EP:428.26`
- Add Position: `15m Add Long 2/2 EP:429.50`
- Exit: `1m Close Long Reverse Signal`
Where:
- `1m`/`15m` = Current chart timeframe
- `EP` = Entry Price
---
## 💰 Backtest Settings
Capital Allocation
- Initial Capital: 10,000 USD
- Per Entry: 5,000 USD (split into 2 entries)
- Leverage: 0x (spot trading)
Trading Costs
- Commission: 0.06% (Binance spot VIP0)
- Slippage: 0
---
## 🎯 Use Cases
✅ Best Scenarios
- Trending markets
- Moderate volatility assets
- 1-minute to 4-hour timeframes
⚠️ Not Suitable For
- Highly volatile choppy markets
- Low liquidity small-cap coins
- Extreme market conditions (black swan events)
---
## 📊 Usage Recommendations
Timeframe Suggestions
| Timeframe | Trading Style | Suggested Parameter Adjustment |
|-----------|--------------|-------------------------------|
| 1-5 min | Scalping | Swing Length 100-160 |
| 15-30 min | Short-term | Swing Length 50-100 |
| 1-4 hour | Swing Trading | Swing Length 20-50 |
Optimization Tips
1. Adjust swing length based on backtest results
2. Different coins may require different parameters
3. Recommend backtesting on 1-minute chart first before live trading
4. Enable labels to observe entry/exit points
---
## ⚠️ Risk Disclaimer
1. Past Performance Does Not Guarantee Future Results
- Backtest data is for reference only
- Live trading may be affected by slippage, delays, etc.
2. Market Condition Changes
- Strategy performs better in trending markets
- May experience frequent stops in ranging markets
3. Capital Management
- Do not invest more than you can afford to lose
- Recommend setting total capital stop-loss threshold
4. Commission Impact
- Frequent trading accumulates commission fees
- Recommend using exchange discounts (BNB fee reduction, etc.)
---
## 🔧 Troubleshooting
Q: No entry signals?
A: Check if structure filter is too strict, adjust swing length or timeframe
Q: Too many labels displayed?
A: Turn off "Show Labels" option in settings
Q: Poor backtest performance?
A:
1. Check if the coin is suitable for trend-following strategies
2. Adjust parameters (swing length, channel period)
3. Try different timeframes
Q: How to set alerts?
A:
1. Click "Alert" in top-right corner of chart
2. Condition: Select "Strategy - Trend Following CRYPTOCAP:ZEC "
3. Choose "Order filled"
4. Set notification method (Webhook/Email/App)
---
## 📞 Contact Information
Strategy Name: Trend Following CRYPTOCAP:ZEC
Version: v1.0
Pine Script Version: v6
Last Updated: December 2025
---
## 📄 Copyright Notice
This strategy is for educational and research purposes only.
All risks of using this strategy for live trading are borne by the user.
Commercial use without authorization is prohibited.
---
## 🎓 Learning Resources
To understand the strategy principles in depth, recommended reading:
- "The Complete TurtleTrader" - Curtis Faith
- "Trend Following" - Michael Covel
- TradingView Pine Script Official Documentation
---
Happy Trading! Remember to manage your risk 📈

Liquidity Heatmap [Eˣ]💧 Liquidity Heatmap - Free Indicator
Overview
The Liquidity Heatmap reveals where stop losses are clustered in the market - the hidden liquidity zones that smart money targets. This indicator automatically identifies Buy-Side Liquidity (BSL) above price and Sell-Side Liquidity (SSL) below price, showing you exactly where institutional traders are likely to hunt for stops before major moves.
━━━━━━━━━━━━━━━━━━━━━━━━━━━━
🎯 What This Indicator Does
Identifies Liquidity Zones:
• Buy-Side Liquidity (BSL) - Stop losses from SHORT positions clustered above price
• Sell-Side Liquidity (SSL) - Stop losses from LONG positions clustered below price
• Automatically clusters nearby levels into high-probability zones
• Shows liquidity strength (1-5+) - higher numbers = more stops = bigger target
• Removes swept liquidity in real-time as price takes out stops
Visual Display:
• 🔴 Red Zones Above Price = Buy-Side Liquidity (shorts' stops)
• 🟢 Green Zones Below Price = Sell-Side Liquidity (longs' stops)
• Thicker/Darker Zones = Higher liquidity concentration
• BSL/SSL Labels = Show exact strength count
• Triangle Markers = Liquidity sweep alerts (when price takes stops)
Smart Features:
• Auto-removes old liquidity (customizable lookback period)
• Clusters nearby levels to reduce noise
• Tracks liquidity strength and age
• Updates in real-time as new swing points form
• Alerts when major liquidity zones are swept
━━━━━━━━━━━━━━━━━━━━━━━━━━━━
📊 How To Use This Indicator
Understanding Liquidity Concepts
What is Liquidity?
Liquidity refers to clusters of stop loss orders sitting in the market. These stops represent:
• Long traders' stop losses (below support) = Sell-Side Liquidity
• Short traders' stop losses (above resistance) = Buy-Side Liquidity
Why Does This Matter?
• Institutions NEED liquidity to fill large orders
• Price often "sweeps" liquidity zones before reversing
• Major liquidity = major target for smart money
• Understanding liquidity = understanding market maker behavior
The Liquidity Cycle:
1. Retail traders place stops at obvious levels (swing highs/lows)
2. Smart money identifies these clusters
3. Price is pushed to sweep the stops (liquidity grab)
4. Institutions fill their orders with this liquidity
5. Price reverses in the opposite direction
━━━━━━━━━━━━━━━━━━━━━━━━━━━━
💡 Trading Strategies
Strategy 1: Liquidity Sweep Reversals
Best For: Swing trading, catching reversals
Timeframes: 15min, 1H, 4H, Daily
Entry Setup:
1. Identify strong Sell-Side Liquidity (SSL) zone below price
2. Wait for price to sweep down into the SSL zone
3. Look for rejection/reversal candle pattern (pin bar, engulfing)
4. Enter LONG after sweep and reversal confirmation
5. Stop loss: Below the swept liquidity zone
6. Target: Opposite liquidity zone or key resistance
Why It Works: Smart money sweeps stops to fill buy orders, then pushes price higher
Example:
• SSL zone at $45,000 with strength 3
• Price drops to $44,950, sweeps the SSL
• Strong bullish reversal candle forms
• Enter long at $45,100
• Target: BSL zone at $47,000
Strategy 2: Liquidity-to-Liquidity Runs
Best For: Day trading, scalping
Timeframes: 5min, 15min, 1H
Entry Setup:
1. Price sweeps Sell-Side Liquidity below and reverses up
2. Identify Buy-Side Liquidity zone above
3. Enter LONG targeting the BSL zone above
4. Exit near/at the BSL zone (don't wait for sweep)
5. Stop loss: Below recent swing low
Why It Works: Price moves from liquidity pool to liquidity pool
Variation - Reverse for Shorts:
• BSL sweep above → Look for SSL zone below
• Enter short targeting lower liquidity
Strategy 3: Liquidity Avoidance (Stop Placement)
Best For: Improving win rate on existing strategies
Timeframes: All
Rules:
1. NEVER place stops exactly at obvious liquidity zones
2. Place stops beyond the liquidity zone with buffer
3. Or place stops before the liquidity zone (tighter, riskier)
4. Monitor liquidity strength - avoid zones with strength 3+
Why It Works: Market makers hunt obvious stop clusters
Example:
• Trading long, swing low at $100 (SSL zone, strength 4)
• Bad: Stop at $99.50 (will get swept)
• Better: Stop at $98.50 (beyond the liquidity)
• Alternative: Stop at $100.50 (tighter, before sweep zone)
Strategy 4: Confluence Trading
Best For: High probability setups
Timeframes: 1H, 4H, Daily
Entry Setup:
1. Find liquidity zone that aligns with:
• Major support/resistance level
• Fibonacci retracement (0.618, 0.786)
• Trendline
• Round psychological number ($50,000, $2,000, etc)
2. Wait for sweep of this high-confluence zone
3. Enter on reversal with multiple confirmations
4. Larger position size justified by confluence
Why It Works: Multiple factors = institutional interest = higher probability
━━━━━━━━━━━━━━━━━━━━━━━━━━━━
⚙️ Settings Explained
Core Settings
Swing Detection Length (Default: 10)
• Number of bars left/right to identify swing highs and lows
• Lower values (5-8): More sensitive, more liquidity zones, more noise
• Higher values (12-20): Less sensitive, only major swings, cleaner chart
• Recommended: 8-10 for intraday, 10-15 for swing trading
Liquidity Lookback Bars (Default: 100)
• How many historical bars to track liquidity zones
• Lower values (50-75): Shows only recent liquidity
• Higher values (100-200): Shows longer-term liquidity clusters
• Zones older than this are automatically removed
• Recommended: 100-150 for most timeframes
Zone Proximity % (Default: 0.5)
• Percentage threshold to group nearby levels into single zone
• Lower values (0.2-0.4): Keeps levels separate, more zones
• Higher values (0.6-1.0): Aggressive clustering, fewer zones
• Recommended: 0.4-0.6 for crypto, 0.3-0.5 for forex, 0.5-0.8 for stocks
Visualization Settings
Show Buy-Side Liquidity
• Toggle ON/OFF red zones above price
• Turn OFF if only interested in downside liquidity
Show Sell-Side Liquidity
• Toggle ON/OFF green zones below price
• Turn OFF if only interested in upside liquidity
Show Liquidity Labels
• Toggle BSL/SSL labels with strength numbers
• Turn OFF for cleaner chart appearance
• Keep ON to see exact liquidity strength
Display Style
• Boxes: Filled rectangular zones (best for visualizing strength)
• Lines: Horizontal dashed lines (minimal, clean look)
• Both: Boxes + Lines (maximum visibility)
Color Intensity
• Low: 85% transparency (subtle, less distracting)
• Medium: 75% transparency (balanced visibility)
• High: 65% transparency (bold, maximum visibility)
━━━━━━━━━━━━━━━━━━━━━━━━━━━━
📱 Info Panel Guide
Located in the top-right corner, the info panel provides real-time liquidity statistics:
Buy-Side Zones
• Count of active BSL zones above current price
• Higher number = More upside targets for price
Sell-Side Zones
• Count of active SSL zones below current price
• Higher number = More downside targets for price
Total Zones
• Combined count of all active liquidity
• Useful for gauging overall market structure
Nearest BSL
• Distance in % to closest Buy-Side Liquidity above
• Example: +2.5% means BSL is 2.5% above current price
• Quick reference for next upside target
Nearest SSL
• Distance in % to closest Sell-Side Liquidity below
• Example: -1.8% means SSL is 1.8% below current price
• Quick reference for next downside target
Liquidity Bias
• ⬆️ Bullish : More BSL than SSL (upside targets dominate)
• ⬇️ Bearish : More SSL than BSL (downside targets dominate)
• ↔️ Balanced: Equal liquidity on both sides (range-bound)
━━━━━━━━━━━━━━━━━━━━━━━━━━━━
🎓 Understanding Liquidity Strength
What Do The Numbers Mean?
Strength 1 : Single swing point
• Light liquidity, minor target
• Can be ignored in trending markets
• Useful in ranging/choppy conditions
Strength 2-3 : Moderate liquidity cluster
• Multiple nearby swing points merged
• Decent target for intraday moves
• Watch for potential sweeps
Strength 4-5 : Strong liquidity cluster
• Major cluster of stops
• High-probability target for institutions
• Expect reactions when swept
Strength 6+ : Extreme liquidity pool
• Massive stop cluster (rare)
• Critical zone - high probability of sweep
• Often marks major support/resistance
• Ideal for confluence setups
━━━━━━━━━━━━━━━━━━━━━━━━━━━━
📱 Alert Setup
This indicator includes 2 powerful alert types:
1. Buy-Side Liquidity Sweep
• Triggers when price sweeps BSL zone above
• Shows potential bullish reversal opportunity
• Often precedes upward continuation after sweep
2. Sell-Side Liquidity Sweep
• Triggers when price sweeps SSL zone below
• Shows potential bearish reversal opportunity
• Often precedes downward continuation after sweep
To Set Up Alerts:
1. Click the "Alert" button (clock icon) in TradingView
2. Condition: Select "Liquidity Heatmap"
3. Choose alert type: BSL Sweep or SSL Sweep
4. Configure notification method (push, email, webhook)
5. Click "Create"
Pro Tip: Set alerts for both BSL and SSL sweeps to catch opportunities in both directions
━━━━━━━━━━━━━━━━━━━━━━━━━━━━
💎 Pro Tips & Best Practices
✅ DO:
• Wait for confirmation - Don't enter immediately on sweep, wait for reversal pattern
• Combine with trend - SSL sweeps in uptrends = higher probability longs
• Check multiple timeframes - 1H liquidity + 4H liquidity = strongest zones
• Monitor strength - Focus on zones with strength 3+
• Use proper risk management - Liquidity sweeps can go further than expected
• Watch for re-sweeps - Sometimes liquidity zones get swept multiple times
• Consider volume - High volume sweeps = stronger reversal potential
⚠️ DON'T:
• Don't fade strong trends - In strong trends, sweeps often continue rather than reverse
• Don't overtrade - Not every sweep is a tradeable setup
• Don't ignore context - Check broader market conditions and news
• Don't use alone - Combine with price action, support/resistance, and other analysis
• Don't place stops at liquidity - Your stops will be hunted
• Don't expect perfection - Some sweeps fail, some zones never get hit
🎯 Best Timeframes:
• Scalping: 5min, 15min (fast moves, frequent sweeps)
• Day Trading: 15min, 1H (balanced view)
• Swing Trading: 1H, 4H, Daily (major liquidity zones)
• Position Trading: 4H, Daily, Weekly (institutional liquidity)
🔥 Best Markets:
• Crypto (high volatility, frequent liquidity grabs)
• Forex (EUR/USD, GBP/USD - liquid pairs)
• Futures (ES, NQ, CL - high liquidity contracts)
• Stocks (large caps with high volume)
⏰ Best Times:
• Market opens (high volatility = liquidity hunting)
• Before/after major news events
• Session overlaps (London/NY for forex)
• First hour and last hour of trading
━━━━━━━━━━━━━━━━━━━━━━━━━━━━
🚀 What Makes This Different?
Unlike basic pivot indicators, the Liquidity Heatmap:
• Institutional Perspective - Shows where smart money hunts stops
• Dynamic Clustering - Automatically groups nearby levels for clarity
• Strength Tracking - Not just where, but HOW MUCH liquidity exists
• Auto-Cleanup - Removes swept and old liquidity automatically
• Visual Clarity - Instant understanding of market structure
• Actionable - Clear targets and reversal zones for trading
• Real-Time Updates - Adapts as market structure evolves
Based On Professional Concepts:
• Order flow analysis
• Market maker behavior
• Institutional trading techniques
• Liquidity engineering principles
━━━━━━━━━━━━━━━━━━━━━━━━━━━━
📈 Common Liquidity Patterns
Pattern 1: The Double Sweep
• Price sweeps SSL below, reverses up
• Price sweeps BSL above, reverses down
• Back to original range
• Trading: Fade the second sweep for mean reversion
Pattern 2: The Cascade
• Multiple SSL zones stacked below
• Price sweeps first zone, continues to next
• Chain reaction of stop losses triggering
• Trading: Ride the momentum to lowest zone
Pattern 3: The Fake-Out
• Price approaches liquidity but doesn't quite sweep
• Reverses before hitting the zone
• "Scared money" didn't wait for full sweep
• Trading: Wait for actual sweep, don't anticipate
Pattern 4: The Absorption
• Price sweeps major liquidity zone (strength 5+)
• No reversal, just consolidation
• Institutions absorbed all liquidity
• Trading: Wait for breakout direction, likely continuation
━━━━━━━━━━━━━━━━━━━━━━━━━━━━
📈 Upgrade Your Trading Arsenal
This free indicator gives you institutional-level liquidity analysis. Want more?
🔥 Check out my premium scripts for:
• Automated entry signals with liquidity confirmation
• Multi-timeframe liquidity analysis
• Advanced stop loss management that avoids liquidity zones
• Backtested strategies with performance tracking
• Custom alerts for high-probability setups
• And much more...
👉 Visit my profile to see all available tools!
━━━━━━━━━━━━━━━━━━━━━━━━━━━━
📝 Important Notes
• Liquidity analysis is one piece of the puzzle - use with other analysis methods
• Not all liquidity zones get swept - some remain untouched
• Market conditions change - adapt your strategy accordingly
• Always use proper position sizing and risk management
• Liquidity sweeps can be violent - use appropriate stop losses
• Practice on demo accounts before trading with real capital
• Past liquidity patterns don't guarantee future price action
Disclaimer: This indicator is for educational purposes. Trading involves risk. Always do your own research and never risk more than you can afford to lose.
━━━━━━━━━━━━━━━━━━━━━━━━━━━━
🙏 Support This Work
If you find this indicator valuable:
• ⭐ Give it a thumbs up
• 💬 Share your best liquidity sweep trades in the comments
• 🔔 Follow for more free professional-grade tools
• 🚀 Share with traders who need to understand liquidity
Got questions? Drop a comment and I'll help you master liquidity trading!
━━━━━━━━━━━━━━━━━━━━━━━━━━━━
Developed with ❤️ for traders who want to think like institutions
━━━━━━━━━━━━━━━━━━━━━━━━━━━━
Version History
• v1.0 - Initial release with dynamic liquidity detection and clustering
