Fib,Guppy Multiple MA(FGMMA)(A/D & Volume Weight,SMA,EMA)[cI8DH]Features:
- 3 + 12 MAs (12 is chosen because Guppy has 12 MAs)
- MA types can be set to Simple, Exponential, Weighted, and Smoothed
- Volume weight can be applied to all available MAs (the built-in VWMA uses Simple MA)
- It is possible to count in only effective portions of the volume in the equation by using Accum/Dist Volume Weight
- Secondary smoothing (useful when volume weight is enabled)
- Predefined MA sets based on Fibonacci sequence (2,3,5,8,.., 377), Guppy (3,5,8,10,12,15 &30,35,40,45,50,60), and cI8DH (2,3,5,8,12,17 & 30,34,39,45,52,60)
Recommended settings:
- hlc3 as input source captures all the essential information encapsulated in a candle. I'd use hlc3 as the default option. In uptrend, "low" and in downtrend, "high" might give more relevant results when using MAs for structural analysis of a market. For commonly used MAs (EMA20, SMA50,100,200), "close" should be used due to their self-fulfilling prophecy effect.
- When you have volume weight above 0, you may want to use secondary smoothing.
- Try not to use Simple MA for smaller lengths (below 20). Sharp changes in the past (right before the period specified by the length) will affect the current value of MA dramatically leading to confusion.
- I am using the first 3 MAs for SMA 50,100,200. You can disable them from the MA type selector all at once when using Fib or Guppy ribbons.
MA-based analysis:
There are different ways of structuring a market. Geometrical (trend lines, channels, fans, patterns, etc) and Fib retracement-based structuring is very common among traders. MAs give an alternative way of analyzing markets. MA ribbons such as Guppy (6 slow and 6 fast-moving MAs) are popular for analyzing market flow. IMO default Guppy sets are a bit random as the numbers do not have an elegant sequence. So I proposed my sets based on increasing sequene spacing (+1). These two MA ribbons are good for market flow analysis but the spacing of the MAs are not ideal for structuring a market. Ribbons based on the Fib sequence is a better choice for structuring a market. This is the equivalent of Fib channels but in a more dynamic form. Among other things, MA Fib ribbon can be used to assess market momentum and to compare different stages of a market. Here are two "educational-only" examples:
Notes:
- Smoothed MA with length L = Exponential MA with length 2*L-1
- Read the background section in my ADP indicator to understand how A/D Volume is calculated
ابحث في النصوص البرمجية عن "科创50和科创100区别"

Moving Average Exponential x 4I get tired of using multiple EMAs to overlay the ones I use most commonly (the 50/100/200). This tool adds four EMAs in one indicator (50/100/200/400) by default, and they can be adjusted any way you like, just like the normal EMA tool.

DECL: 3 X Moving Average (50, 100 and 200 day)Basic Moving Average with 3 different intervals. Default: 50 day (blue), 100 day (red) and 200 day (purple)

Simple and Exponential Moving AveragesThis script graphs 5 SMAs (20, 50, 100, 150, 200) and 5 EMAs (20, 50, 100, 150, 200). The first group uses blue and orange colors whereas the second one uses green and red. When a bar closes below a moving average, either orange or red will be used depending on which type of moving average and which period. In bullish mode, we show blue and green. Moving average periods are configurable, and you can hide the MAs you don't want.

Psych Level ScreenerThis Script is intended for Pine Screener and is not designed as a indicator!!!
Pine Screener is something TradingView has recently added and is still only a Beta version.
Pine Screener itself is currently only available to members that are Premium and above.
What it does:
This screener will actively look for tickers that are close to Pysch level in your watchlist.
Psych level here refers to price levels that are round numbers such as 50,100,1000.
Users can specify the offset from a psych level (in %) and scanner will scan for tickers that are within the offset. For example if offset is set at 5% then it will scan for tickers that are within +/-5% of a ticker. (for $100 psych level it will scan for ticker in $95-105 range)
Once scan is completed you will be able to see:
- Current price of ticker
- Closest psych level for that ticker
- % and $ move required for it to hit that psych level
- Ticker's day range and Average range (with % of average range completed for the day)
- Ticker volume and average volume
Setting up:
www.tradingview.com
Above link will help you guide how to setup Pine screener.
Use steps below to guide you the setup for this specific screener:
1. Open Pine Screener (open new tab, select screener the "Pine")
2. At the top, click on "Choose Indicator" and select "Psych Level Screener"
3. At the top again, click "Indicator Psych Level Screener" and select settings.
4. Change setting to your needs. Hit Apply when done.
a)"% offset from Psych Level" will scan for any stocks in your watchlist which are +/- from the offset you chose for any given psych level. Default is 5. (e.g. If offset is 5%, it will scan for stocks that are between $95-$105 vs $100 psych level, $190-$210 for $200 psych level and so on)
b) ATR length is number of previous trading days you want to include in your calculation. Moving Average Type is calculation method.
c) Rvol length is number of previous trading days you want to include in your calculation.
5. On top left, click "Price within specified offset of Psych. Level" and select true. Then select "Scan" which is located at the top next to "Indicator Psych Level Screener". This will filter out all the stock that meets the condition.
6. At the end of the column on the right there is a "+" symbol. From there you can add/remove columns. 30min/1hr/4hr/1D Trend are disabled by default so if this is needed please enable them.
7. You can change the order of ticker by ascending and descending order of each column label if needed. Just click on the arrow that comes up when you move the cursor to any of the column items.
8. You can specify advanced filter settings based on the variables in the column. (e.g., set price range of stock to filter out further) To do so, click on the column variable name in interest, located above the screener table (or right below "scan") and select "manual setup".
How to read the column:
Current Price: Shows current price of the ticker when scan was done. Currently Pine Screener does NOT support pre/post-hours data so no PM and AH price.
Psych Level: Psych level the current price is near to.
% to Psych Level: Price movement in % necessary to get to the Psych level.
$ to Psych Level: Price movement in $ necessary to get to the Psych level.
DTR: Daily True Range of the stock. i.e. High - Low of the ticker on the day.
ATR: Average True Range of stock in the last x days, where x is a value selected in the setting. (See step 3 in Previous section)
DTR vs ATR: Amount of DTR a ticker has done in % with respect to ATR. (e.g., 90% means DTR is 90% of ATR)
Vol.: Volume of a ticker for the day. Currently Pine Screener does NOT support pre/post-hours data so no PM and AH volume.
Avg. Vol: Average volume of a ticker in the last x days, where x is a value selected in the setting. (See step 3 in Previous section)
Rvol: Relative volume in percentage, measured by the ratio of day's volume and average volume.
30min/1hr/4hr/1D Trend: Trend status to see if the chart is Bullish or Bearish on each of the time frame. Bullishness or Bearishness is defined by the price being over or under the 34/50 cloud on each of the time frame. Output of 1 is Bullish, -1 is Bearish. 0 means price is sitting inside the 34/50 cloud. Currently Pine Screener does NOT support pre/post-hours data so 34/50 cloud is based on regular trading hours data ONLY.
Some things user should be aware of:
- Pine Screener itself is currently only available to TradingView members with Premium Subscription and above. (I can't to anything about this as this is NOT set by me, I have no control) For more info: www.tradingview.com
- The Pine Screener itself is a Beta version and this screener can stop working anytime depending on changes made by TradingView themselves. (Again I cannot control this)
- Pine Screener can only run on Watchlists for now. (as of 03/31/2025) You will have to prepare your own watchlists. In a Watchlist no more than 1000 tickers may be added. (This is TradingView rules)
- Psych level included are currently 50 to 1500 in steps of 50. If you need a specific number please let me know. Will add accordingly.
- Unfortunately this screener does not update automatically, so please hit "scan" to get latest screener result.
- I cannot add 10min trend to the column as Pine Screener does NOT support 10min timeframe as of now. (03/31/2025)
- This code is only meant for Pine Screener. I do NOT recommend using this as an indicator.
- Currently Pine Screener does NOT support pre/post-hours data. So data such as Price, Volume and EMA values are based on market hours data ONLY! (If I'm wrong about this please correct me / let me know and will make look into and make changes to the code)
Other useful links about Pine Screener:
Quick overview of the Screener’s functionality: www.tradingview.com
what do you need to know before you start working? : www.tradingview.com
These links will go over the setting up with GIFs so is easier to understand.
-----------------------------------------------------------------------------------------------------------------
If there are other column variables that you think is worth adding please let me know! Will try add it to the screener!
If you have any questions let me know as well, will reply soon as I can!
Have a good trading day and hope it helps!

Smart Disparity IndexThe Smart Disparity Index (SDI) is an optimized version of the Disparity Index indicator invented by Steve Nison (book "Beyond Candlesticks").
According to Steve Nison, "The disparity index (or disparity ratio), compares, as a percentage, the latest close to a chosen moving average", which means that the indicator gives the difference in % between the closing price and a simple moving average.
The calculation formula is therefore as follows:
Disparity Index = 100 x (closing_price - simple_moving_average) / simple_moving_average
In order to optimize the calculation, I replaced the closing price with the 6-period exponential moving average (EMA6) which, according to many years of experience, allows prices to be smoothed by eliminating excesses.
Formula for calculating the Smart Disparity Index:
SDI = 100 x (EMA6 - simple_moving_average) / simple_moving_average
The provided script displays the SDI for the 20, 50, 100 and 200 periods.
From my point of view, I recommend using the SDI50 as a priority:
SDI50 = 100 x (EMA6 - SMA50) / SMA50
In the chart, we can see the SDI50 (in purple) is on a long-term support (in green), this indicates a probability of a Bitcoin rise in the coming months.
The SDI can also be used as a momentum type indicator.

Enhanced Market Structure StrategyATR-Based Risk Management:
Stop Loss: 2 ATR from entry (configurable)
Take Profit: 3 ATR from entry (configurable)
Dynamic Position Sizing: Based on ATR stop distance and max risk percentage
Advanced Signal Filters:
RSI Filter:
Long trades: RSI < 70 and > 40 (avoiding overbought)
Short trades: RSI > 30 and < 60 (avoiding oversold)
Volume Filter:
Requires volume > 1.2x the 20-period moving average
Ensures institutional participation
MACD Filter (Optional):
Long: MACD line above signal line and rising
Short: MACD line below signal line and falling
EMA Trend Filter:
50-period EMA for trend confirmation
Long trades require price above rising EMA
Short trades require price below falling EMA
Higher Timeframe Filter:
Uses 4H/Daily EMA for multi-timeframe confluence
Enhanced Entry Logic:
Regular Entries: IDM + BOS + ALL filters must pass
Sweep Entries: Failed breakouts with tighter stops (1.6 ATR)
High-Probability Focus: Only trades when multiple confirmations align
Visual Improvements:
Detailed Entry Labels: Show entry, stop, target, and risk percentage
SL/TP Lines: Visual representation of risk/reward
Filter Status: Bar coloring shows when all filters align
Comprehensive Statistics: Real-time performance metrics
Key Strategy Parameters:
pinescript// Recommended Settings for Different Markets:
// Forex (4H-Daily):
// - CHoCH Period: 50-75
// - ATR SL: 2.0, ATR TP: 3.0
// - All filters enabled
// Crypto (1H-4H):
// - CHoCH Period: 30-50
// - ATR SL: 2.5, ATR TP: 4.0
// - Volume filter especially important
// Indices (4H-Daily):
// - CHoCH Period: 50-100
// - ATR SL: 1.8, ATR TP: 2.7
// - EMA and MACD filters crucial
Expected Performance Improvements:
Win Rate: 55-70% (improved filtering)
Profit Factor: 2.0-3.5+ (better risk/reward with ATR)
Reduced Drawdown: Stricter filters reduce false signals
Consistent Risk: ATR-based stops adapt to volatility
This enhanced version provides much more robust signal filtering while maintaining the core market structure edge, resulting in higher-probability trades with consistent risk management.

All SMAs Bullish/Bearish Screener (Enhanced)All SMAs Bullish/Bearish Screener Enhanced: Uncover High-Conviction Trend Alignments with Confidence
Description:
Are you ready to elevate your trading from mere guesswork to precise, data-driven decisions? The "All SMAs Bullish/Bearish Screener Enhanced" is not just another indicator; it's a sophisticated, yet user-friendly, trend-following powerhouse designed to cut through market noise and pinpoint high-probability trading opportunities. Built on the foundational strength of comprehensive Moving Average confluence and fortified with critical confirmation signals from Momentum, Volume, and Relative Strength, this script empowers you to identify truly robust trends and manage your trades with unparalleled clarity.
The Power of Multi-Factor Confluence: Beyond Simple Averages
In the unpredictable world of financial markets, true strength or weakness is rarely an isolated event. It's the harmonious alignment of multiple technical factors that signals a high-conviction move. While our original "All SMAs Bullish/Bearish Screener" intelligently identified stocks where price was consistently above or below a full spectrum of Simple Moving Averages (5, 10, 20, 50, 100, 200), this Enhanced version takes it a crucial step further.
We've integrated a powerful three-pronged confirmation system to filter out weaker signals and highlight only the most compelling setups:
Momentum (Rate of Change - ROC): A strong trend isn't just about price direction; it's about the speed and intensity of that movement. Positive momentum confirms that buyers are still aggressively pushing price higher (for bullish signals), while negative momentum validates selling pressure (for bearish signals).
Volume: No trend is truly trustworthy without the backing of smart money. Above-average volume accompanying an "All SMAs" alignment signifies strong institutional participation and conviction behind the move. It separates genuine trend starts from speculative whims.
Relative Strength Index (RSI): This versatile oscillator ensures the trend isn't just "there," but that it's developing healthily. We use RSI to confirm a bullish bias (above 50) or a bearish bias (below 50), adding another layer of confidence to the direction.
When the price aligns above ALL six critical SMAs, and is simultaneously confirmed by robust positive momentum, healthy volume, and a bullish RSI bias, you have an exceptionally strong "STRONGLY BULLISH" signal. This confluence often precedes sustained upward moves, signaling prime accumulation phases. Conversely, a "STRONGLY BEARISH" signal, where price is below ALL SMAs with negative momentum, confirming volume, and a bearish RSI bias, indicates powerful distribution and potential for significant downside.
How to Use This Enhanced Screener:
Add to Chart: Go to TradingView's Pine Editor, paste the script, and click "Add to Chart."
Customize Parameters: Fine-tune the lengths of your SMAs, RSI, Momentum, and Volume averages via the indicator's settings. Experiment to find what best suits your trading style and the assets you trade.
Choose Your Timeframe Wisely:
Daily (1D) and 4-Hour (240 min) are highly recommended. These timeframes cut through intraday noise and provide more reliable, actionable signals for swing and position trading.
Shorter timeframes (e.g., 15min, 60min) can be used by advanced day traders for very short-term entries, but be aware of increased volatility and noise.
Visual Confirmation:
Green/Red Triangles: Appear on your chart, indicating confirmed bullish or bearish signals.
Background Color: The chart background will subtly turn lime green for "STRONGLY BULLISH" and red for "STRONGLY BEARISH" conditions.
On-Chart Status Table: A clear table displays the current signal status ("STRONGLY BULLISH/BEARISH," or "SMAs Mixed") for immediate feedback.
Set Up Alerts (Your Primary Screener Tool): This is the game-changer! Create custom alerts on TradingView based on the "Confirmed Bullish Trade" and "Confirmed Bearish Trade" conditions. Receive instant notifications (email, pop-up, mobile) for any stock in your watchlist that meets these stringent criteria. This allows you to scan the entire market effortlessly and act decisively.
Strategic Stop-Loss Placement: The Trader's Lifeline
Even the most robust signals can fail. Protecting your capital is paramount. For this trend-following strategy, your stop-loss should be placed where the underlying trend structure is broken.
For a "STRONGLY BULLISH" Trade: Place your stop-loss just below the most recent significant swing low (higher low). This is the last point where buyers stepped in to support the price. If price breaks below this, your bullish thesis is invalidated.
For a "STRONGLY BEARISH" Trade: Place your stop-loss just above the most recent significant swing high (lower high). If price breaks above this, your bearish thesis is invalidated.
Alternatively, consider placing your stop-loss just below the 20-period SMA (for bullish trades) or above the 20-period SMA (for bearish trades). A significant close beyond this intermediate-term average often indicates a critical shift in momentum. Always ensure your chosen stop-loss adheres to your pre-defined risk per trade (e.g., 1-2% of capital).
Disciplined Profit Booking: Maximizing Gains
Just as important as knowing when you're wrong is knowing when to take profits.
Trailing Stop-Loss: As your trade moves into profit, trail your stop-loss upwards (for longs) or downwards (for shorts). You can trail it using:
Previous Swing Lows/Highs: Move your stop to just below each new higher low (for longs) or just above each new lower high (for shorts).
A Moving Average (e.g., 10-period or 20-period SMA): If price closes below your chosen trailing SMA, exit. This allows you to ride the trend while protecting accumulated profits.
Target Levels: Identify potential resistance levels (for longs) or support levels (for shorts) using pivot points, previous highs/lows, or Fibonacci extensions. Consider taking partial profits at these levels and letting the rest run with a trailing stop.
Loss of Confluence: If the "STRONGLY BULLISH/BEARISH" condition ceases to be met (e.g., RSI crosses below 50, or volume drops significantly), this can be a signal to reduce or exit your position, even if your stop-loss hasn't been hit.
The "All SMAs Bullish/Bearish Screener Enhanced" is your comprehensive partner in navigating the markets. By combining robust trend identification with critical confirmation signals and disciplined risk management, you're equipped to make smarter, more confident trading decisions. Add it to your favorites and unlock a new level of precision in your trading journey!
#PineScript #TradingView #SMA #MovingAverage #TrendFollowing #StockScreener #TechnicalAnalysis #Bullish #Bearish #QQQ #Momentum #Volume #RSI #SPY #TradingStrategy #Enhanced #Signals #Analysis #DayTrading #SwingTrading

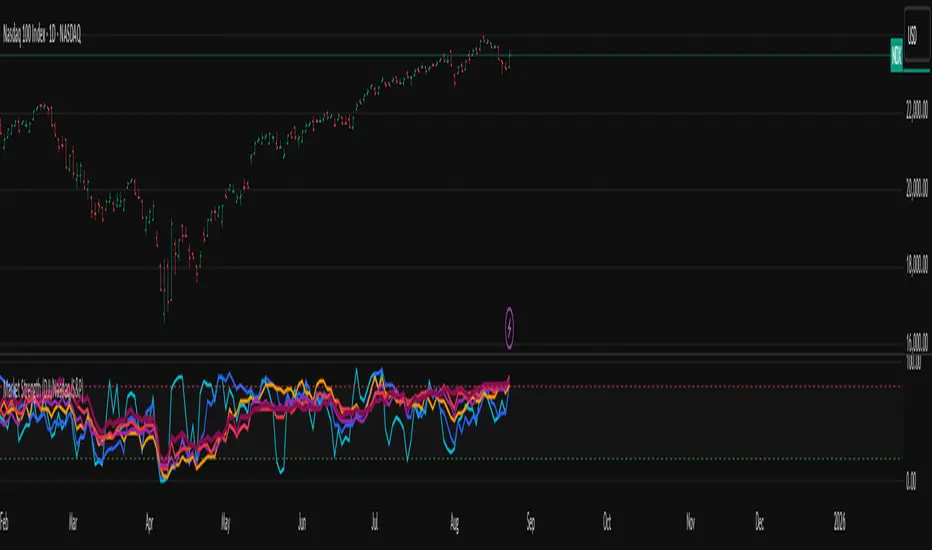
Market Internal Strength (DJI/Nasdaq/S&P)Market Health Dow, Nasdaq & S\&P 500 Breadth
Track the true internal health of the US market's three most important indices the Dow Jones Industrial Average (DJI), the Nasdaq 100 (NDX), and the S\&P 500 (SPX).
Price action alone can be deceiving. A rising index might be driven by only a handful of mega-cap stocks, masking underlying weakness. This indicator provides a crucial look "under the hood" to measure the market's true breadth.
It visualizes the percentage of stocks within each index that are trading above their key moving averages (5, 20, 50, 100, 150, and 200-day). This allows you to instantly gauge whether a market trend is broadly supported by the majority of its constituent stocks.
Key Features
* Covers 3 Major US Indices Seamlessly switch your analysis between the Dow Jones, Nasdaq 100, and S\&P 500.
* Complete Breadth Picture Six MA periods offer a full view, from short-term momentum (5D, 20D) to the long-term institutional trend (150D, 200D).
* Fully Customizable Toggle the visibility of any line and adjust overbought/oversold levels to fit your personal strategy.
How to Use
1. Extreme Readings (Overbought/Oversold)
* Above 80% Signals a very strong, potentially overbought market. Caution is advised as a pullback could be near.
* Below 20% Signals a deeply oversold market, often indicating capitulation and potential buying opportunities.
2. Divergence (Powerful Warning Signal)
* Bearish The index price makes a new high, but this indicator makes a lower high. This warns that the rally is not broad-based and may be losing steam.
* Bullish The index price makes a new low, but this indicator makes a higher low. This suggests internal strength is building and a bottom may be forming.
3. Trend Confirmation
When the long-term lines (150D, 200D) remain high (e.g., \> 50%), the primary market trend is healthy and confirmed.
HILo Ema Squeeze BandsThis indicator combines uses ema to identify price squeeze before a big move.
The ema gets initialised at new high low. It used 3 ema's lengths. For result use x, 2x ,4x ie 50, 100, 200 or 100,200,400 and so on . On more volatile asset use a higher settings like 100,200,400. The inner band is divided into 4 zones, which can give support resistance. As you use it you will become aware of subtle information that it can give at times. Like you may be able to find steps at which prices move, when the market is trending
Just like in Bollinger bands, in a trending market the price stays within sd=1 and sd=2 so does in the inner band the price will remain in band1 and band2. But Bollinger band cannot print steps this indicator shows steps

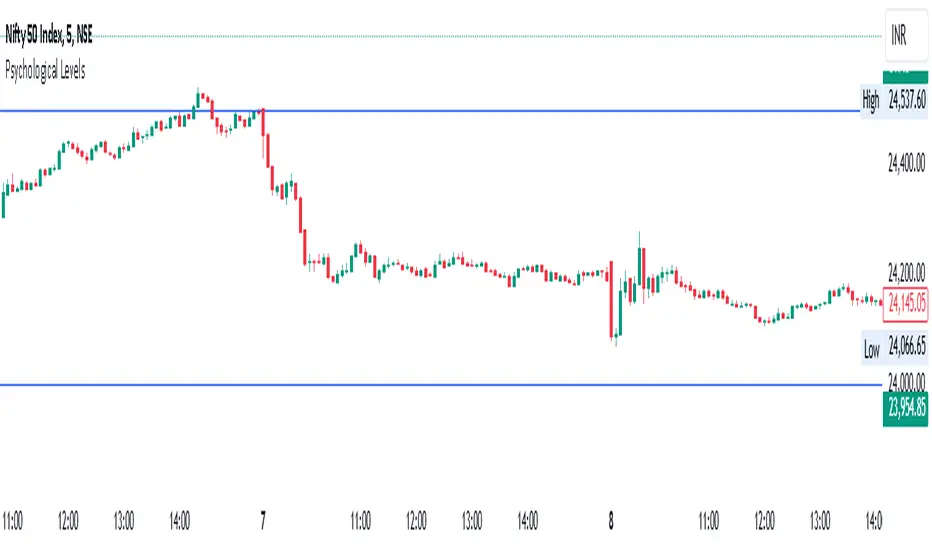
Psych LevelWhat it shows:
This indicator will show a horizontal line at a psychological value which can be user defined. (Psychological values are round numbers, like 10,50,100,1000 and so on...)
At these Psychological value there are often limit orders placed for both buying and selling and can often act as support and resistances.
Therefore it is useful to pre-draw these levels beforehand and this indicator will speed up the process doing so by adjusting few different settings and draw them automatically.
How to use it:
At these Psychological value there are often limit orders placed for both buying and selling and can often act as support and resistances. This is often the case when you look at limit orders at such levels on bookmap or level 2 data.
At these psychological levels it can be set as a target of your trade or as risk levels when taking a trade in either of direction. Obviously this alone shouldn't dictate the trade you should take but can be a valuable info to supplement your trade.
On the chart it is clear to see these psychological level lines are acting as resistances/supports.
Key settings:
Interval: Interval levels will be drawn for, between the minimum and maximum values inputted by the user. Minimum value allowed is 1.
Min. value: Minimum value of Psychological level that will be drawn. Minimum value allowed is 1.
Max value: Maximum value of Psychological level that will be drawn. Minimum value allowed is 1.
Line colour: Colour of line drawn.
Line width: Width of line drawn.
Line style: Style of line drawn, either solid, dotted or dashed.
Label offset: Offset of where where label will be, measured from current bar. Offset of 0 will be drawn at current bar location, any positive number will move to the right by the set amount.
Text Colour: Colour of label text
Text size: Size of label text
Example: Chart here shows setting for minimum value as 100, maximum value as 140 and interval as 5. In this setting lines will be automatically drawn at: 100,105,110,115,120,125,130,145 and 140.
The flexibility of user defined max/min and interval values allows to be accommodated for price with different price tags, including stocks under $10.
----------------------------------------------------------------------
If anything is not clear please let me know!

Advanced Physics Financial Indicator Each component represents a scientific theory and is applied to the price data in a way that reflects key principles from that theory.
Detailed Explanation
1. Fractal Geometry - High/Low Signal
Concept: Fractal geometry studies self-similar patterns that repeat at different scales. In markets, fractals can be used to detect recurring patterns or turning points.
Implementation: The script detects pivot highs and lows using ta.pivothigh and ta.pivotlow, representing local turning points in price. The fractalSignal is set to 1 for a pivot high, -1 for a pivot low, and 0 if there is no signal. This logic reflects the cyclical, self-similar nature of price movements.
Practical Use: This signal is useful for identifying local tops and bottoms, allowing traders to spot potential reversals or consolidation points where fractal patterns emerge.
2. Quantum Mechanics - Probabilistic Monte Carlo Simulation
Concept: Quantum mechanics introduces uncertainty and probability into systems, much like how future price movements are inherently uncertain. Monte Carlo simulations are used to model a range of possible outcomes based on random inputs.
Implementation: In this script, we simulate 100 random outcomes by generating a random number between -1 and 1 for each iteration. These random values are stored in an array, and the average of these values is calculated to represent the Quantum Signal.
Practical Use: This probabilistic signal provides a sense of randomness and uncertainty in the market, reflecting the possibility of price movement in either direction. It simulates the market’s chaotic nature by considering multiple possible outcomes and their average.
3. Thermodynamics - Efficiency Ratio Signal
Concept: Thermodynamics deals with energy efficiency and entropy in systems. The efficiency ratio in financial terms can be used to measure how efficiently the price is moving relative to volatility.
Implementation: The Efficiency Ratio is calculated as the absolute price change over n periods divided by the sum of absolute changes for each period within n. This ratio shows how much of the price movement is directional versus random, mimicking the concept of efficiency in thermodynamic systems.
Practical Use: A high efficiency ratio suggests that the market is trending smoothly (high efficiency), while a low ratio indicates choppy, non-directional movement (low efficiency, or high entropy).
4. Chaos Theory - ATR Signal
Concept: Chaos theory studies how complex systems are highly sensitive to initial conditions, leading to unpredictable behavior. In markets, chaotic price movements can often be captured through volatility indicators.
Implementation: The script uses a very long ATR period (1000) to reflect slow-moving chaos over time. The Chaos Signal is computed by measuring the deviation of the current price from its long-term average (SMA), normalized by ATR. This captures price deviations over time, hinting at chaotic market behavior.
Practical Use: The signal measures how far the price deviates from its long-term average, which can signal the degree of chaos or extreme behavior in the market. High deviations indicate chaotic or volatile conditions, while low deviations suggest stability.
5. Network Theory - Correlation with BTC
Concept: Network theory studies how different components within a system are interconnected. In markets, assets are often correlated, meaning that price movements in one asset can influence or be influenced by another.
Implementation: This indicator calculates the correlation between the asset’s price and the price of Bitcoin (BTC) over 30 periods. The Network Signal shows how connected the asset is to BTC, reflecting broader market dynamics.
Practical Use: In a highly correlated market, BTC can act as a leading indicator for other assets. A strong correlation with BTC might suggest that the asset is likely to move in line with Bitcoin, while a weak or negative correlation might indicate that the asset is moving independently.
6. String Theory - RSI & MACD Interaction
Concept: String theory attempts to unify the fundamental forces of nature into a single framework. In trading, we can view the RSI and MACD as interacting forces that provide insights into momentum and trend.
Implementation: The script calculates the RSI and MACD and combines them into a single signal. The formula for String Signal is (RSI - 50) / 100 + (MACD Line - Signal Line) / 100, normalizing both indicators to a scale where their contributions are additive. The RSI represents momentum, and MACD shows trend direction and strength.
Practical Use: This signal helps in detecting moments where momentum (RSI) and trend strength (MACD) align, giving a clearer picture of the asset's direction and overbought/oversold conditions. It unifies these two indicators to create a more holistic view of market behavior.
7. Fluid Dynamics - On-Balance Volume (OBV) Signal
Concept: Fluid dynamics studies how fluids move and flow. In markets, volume can be seen as a "flow" that drives price movement, much like how fluid dynamics describe the flow of liquids.
Implementation: The script uses the OBV (On-Balance Volume) indicator to track the cumulative flow of volume based on price changes. The signal is further normalized by its moving average to smooth out fluctuations and make it more reflective of price pressure over time.
Practical Use: The Fluid Signal shows how the flow of volume is driving price action. If the OBV rises significantly, it suggests that there is strong buying pressure, while a falling OBV indicates selling pressure. It’s analogous to how pressure builds in a fluid system.
8. Final Signal - Combining All Physics-Based Indicators
Implementation: Each of the seven physics-inspired signals is combined into a single Final Signal by averaging their values. This approach blends different market insights from various scientific domains, creating a comprehensive view of the market’s condition.
Practical Use: The final signal gives you a holistic, multi-dimensional view of the market by merging different perspectives (fractal behavior, quantum probability, efficiency, chaos, correlation, momentum/trend, and volume flow). This approach helps traders understand the market's dynamics from multiple angles, offering deeper insights than any single indicator.
9. Color Coding Based on Signal Extremes
Concept: The color of the final signal plot dynamically reflects whether the market is in an extreme state.
Implementation: The signal color is determined using percentiles. If the Final Signal is in the top 55th percentile of its range, the signal is green (bullish). If it is between the 45th and 55th percentiles, it is orange (neutral). If it falls below the 45th percentile, it is red (bearish).
Practical Use: This visual representation helps traders quickly identify the strength of the signal. Bullish conditions (green), neutral conditions (orange), and bearish conditions (red) are clearly distinguished, simplifying decision-making.

Multiple Colored Moving AveragesMULTIPLE COLORED MOVING AVERAGES - USER GUIDE
DISCLAIMER
----------
Both the code and this documentation were created heavily using artificial intelligence. I'm lazy...
This indicator was inspired by repo32's "Moving Average Colored EMA/SMA" indicator. *
What is this indicator?
-----------------------
This is a TradingView indicator that displays up to 4 different moving averages on your chart simultaneously. Each moving average can be customized with different calculation methods, colors, and filtering options.
Why would I use multiple moving averages?
-----------------------------------------
- See trend direction across different timeframes at once
- Identify support and resistance levels
- Spot crossover signals between fast and slow MAs
- Reduce false signals with filtering options
- Compare how different MA types react to price action
What moving average types are available?
----------------------------------------
11 different types:
- SMA: Simple average, equal weight to all periods
- EMA: Exponential, more weight to recent prices
- WMA: Weighted, linear weighting toward recent data
- RMA: Running average, smooth like EMA
- DEMA: Double exponential, reduced lag
- TEMA: Triple exponential, even less lag
- HMA: Hull, fast and smooth combination
- VWMA: Volume weighted, includes volume data
- LSMA: Least squares, based on linear regression
- TMA: Triangular, double-smoothed
- ZLEMA: Zero lag exponential, compensated for lag
How do I set up the indicator?
------------------------------
Each MA has these settings:
- Enable/Disable: Turn each MA on or off
- Type: Choose from the 11 calculation methods
- Length: Number of periods (21, 50, 100, 200 are common)
- Smoothing: 0-10 levels of extra smoothing
- Noise Filter: 0-5% to ignore small changes
- Colors: Bullish (rising) and bearish (falling) colors
- Line Width: 1-5 pixels thickness
What does the smoothing feature do?
-----------------------------------
Smoothing applies extra calculations to make the moving average line smoother. Higher levels reduce noise but make the MA respond slower to price changes. Use higher smoothing in choppy markets, lower smoothing in trending markets.
What is the noise filter?
--------------------------
The noise filter ignores small percentage changes in the moving average. For example, a 0.3% filter will ignore any MA movement smaller than 0.3%. This helps eliminate false signals from minor price fluctuations.
When should I use this indicator?
---------------------------------
- Trend analysis: See if market is going up, down, or sideways
- Entry timing: Look for price bounces off MA levels
- Exit signals: Watch for MA slope changes or crossovers
- Support/resistance: MAs often act as dynamic levels
- Multi-timeframe analysis: Use different lengths for different perspectives
What are some good settings to start with?
-------------------------------------------
Conservative approach:
- MA 1: EMA 21 (short-term trend)
- MA 2: SMA 50 (medium-term trend)
- MA 3: SMA 200 (long-term trend)
- Low noise filtering (0.1-0.3%)
Active trading:
- MA 1: HMA 9 (very responsive)
- MA 2: EMA 21 (short-term)
- MA 3: EMA 50 (medium-term)
- Minimal or no smoothing
How do I interpret the colors?
------------------------------
Each MA changes color based on its direction:
- Bullish color: MA is rising (upward trend)
- Bearish color: MA is falling (downward trend)
- Gray: MA is flat or unchanged
What should I look for in crossovers?
-------------------------------------
- Golden Cross: Fast MA crosses above slow MA (bullish signal)
- Death Cross: Fast MA crosses below slow MA (bearish signal)
- Multiple crossovers in same direction can confirm trend changes
- Wait for clear separation between MAs after crossover
How do I use MAs for support and resistance?
---------------------------------------------
- In uptrends: MAs often provide support when price pulls back
- In downtrends: MAs may act as resistance on rallies
- Multiple MAs create support/resistance zones
- Stronger levels where multiple MAs cluster together
Can I use this with other indicators?
-------------------------------------
Yes, it works well with:
- Volume indicators for confirmation
- RSI or MACD for timing entries
- Bollinger Bands for volatility context
- Price action patterns for setup confirmation
What if I get too many signals?
-------------------------------
- Increase smoothing levels
- Raise noise filter percentages
- Use longer MA periods
- Focus on major crossovers only
- Wait for multiple MA confirmation
What if signals are too slow?
-----------------------------
- Reduce smoothing to 0
- Lower noise filter values
- Switch to faster MA types (HMA, ZLEMA, DEMA)
- Use shorter periods
- Focus on the fastest MA only
Which MA types work best in different markets?
----------------------------------------------
Trending markets: EMA, DEMA, TEMA (responsive to trends)
Choppy markets: SMA, TMA, HMA with smoothing (less whipsaws)
High volatility: Use higher smoothing and noise filtering
Low volatility: Use minimal filtering for better responsiveness
Do I need all the advanced features?
------------------------------------
No. Start with basic settings:
- Choose MA type and length
- Set colors you prefer
- Leave smoothing at 0
- Leave noise filter at 0
Add complexity only if needed to improve signal quality.
How do I know if my settings are working?
-----------------------------------------
- Backtest on historical data
- Paper trade the signals first
- Adjust based on market conditions
- Keep a trading journal to track performance
- Be willing to modify settings as markets change
Can I save different configurations?
------------------------------------
Yes, save different indicator templates in TradingView for:
- Different trading styles (scalping, swing trading)
- Different market conditions (trending, ranging)
- Different instruments (stocks, forex, crypto)

Adaptive Multi-TF Indicator Table with Presets giua64📌 Script Name:
Adaptive Multi-Timeframe Indicator Table with Presets — giua64
📄 Description:
This script displays an adaptive multi-timeframe dashboard that summarizes the signals of three key technical indicators:
Moving Averages (MAs), Relative Strength Index (RSI), and MACD.
It provides a fast and visually intuitive overview of market conditions across five timeframes (5m, 15m, 30m, 1h, 4h), helping traders quickly identify potential directional biases (e.g., bullish, bearish, or neutral) based on either predefined presets or fully manual settings.
🧰 Preset Configurations:
You can choose between four trading styles, each with optimized indicator parameters:
Scalping
• MAs: 5 / 10 (Fast), 20 / 50 (Slow)
• RSI: 7 periods | Overbought: 70 | Oversold: 30
• MACD: 5 / 13 | Signal: 3
Intraday
• MAs: 9 / 21 (Fast), 50 / 100 (Slow)
• RSI: 14 periods | Overbought: 60 | Oversold: 40
• MACD: 12 / 26 | Signal: 9
Swing
• MAs: 10 / 20 (Fast), 50 / 200 (Slow)
• RSI: 14 periods | Overbought: 65 | Oversold: 35
• MACD: 12 / 26 | Signal: 9
Manual
• Full custom control over all indicator settings.
🛠️ All settings can be customized manually from the options panel, including the exact MA periods, RSI thresholds, and MACD structure.
🧠 How It Works:
For each timeframe, the script evaluates:
MA crossover status (two levels):
The first symbol refers to the crossover of the fast MAs
The second symbol refers to the crossover of the slow MAs
🟢 = Bullish crossover
🔴 = Bearish crossover
➖ = Flat or no clear signal
RSI Direction:
↑ = RSI above upper threshold (potential overbought)
↓ = RSI below lower threshold (potential oversold)
→ = RSI in neutral range
MACD Line vs Signal Line:
↑ = MACD line is above signal line (bullish)
↓ = MACD line is below signal line (bearish)
→ = Flat or neutral signal
Each signal is assigned a numerical score. These are aggregated per timeframe to compute a combined score that reflects the directional bias for that specific time window.
🧠 Adaptive Logic by Asset:
This script is designed to be universally compatible across all asset types — including forex, crypto, stocks, indices, and commodities.
Thanks to its multi-timeframe nature and flexible indicator presets, the script automatically adjusts its behavior based on the asset selected, ensuring relevant analysis without requiring manual recalibration.
🧾 Summary Table Output:
At the bottom of the dashboard, a combined sentiment is displayed for:
3TF → 5m, 15m, 30m
4TF → Adds 1h
5TF → Adds 4h
Each row shows:
Signal → LONG / SHORT / NEUTRAL
Confidence (%) → Based on score aggregation and signal consistency
📌 Customization Options:
Table Position: Left, Right, or Center
Text Size: Small, Normal, or Large
Full Manual Configuration: All MA, RSI, and MACD parameters can be adjusted as needed
⚠️ Disclaimer:
This script is for educational and analytical purposes only.
It does not constitute financial advice or guarantee any trading results.
Always do your own research and apply responsible risk management.

DECODE Moving Average ToolkitDECODE Moving Average Toolkit: Your All-in-One MA Analysis Powerhouse!
This versatile indicator is designed to be your go-to solution for analysing trends, identifying potential entry/exit points, and staying ahead of market movements using the power of Moving Averages (MAs).
Whether you're a seasoned trader or just starting out, the Decode MAT offers a comprehensive suite of features in a user-friendly package.
Key Features:
Multiple Moving Averages: Visualize up to 10 Moving Averages simultaneously on your chart.
Includes 5 Exponential Moving Averages (EMAs) and 5 Simple Moving Averages (SMAs).
Easily toggle the visibility of each MA and customize its length to suit your trading style and the asset you're analyzing.
Dynamic MA Ribbons: Gain a clearer perspective on trend direction and strength with 5 configurable MA Ribbons.
Each ribbon is formed between a corresponding EMA and SMA (e.g., EMA 20 / SMA 20).
The ribbon color changes to indicate bullish (e.g., green) or bearish (e.g., red) sentiment, providing an intuitive visual cue.
Toggle ribbon visibility with a single click.
Powerful Crossover Alerts: Never miss a potential trading opportunity with up to 5 customizable MA Crossover Alerts.
Define your own fast and slow MAs for each alert from any of the 10 available MAs.
Receive notifications directly through TradingView when your specified MAs cross over or cross under.
Optionally display visual symbols (e.g., triangles ▲▼) directly on your chart at the exact crossover points for quick identification.
Highly Customizable:
Adjust the source price (close, open, etc.) for all MA calculations.
Fine-tune the appearance (colors, line thickness) of every MA line, ribbon, and alert symbol to match your charting preferences.
User-Friendly Interface: All settings are neatly organized in the indicator's input menu, making configuration straightforward and intuitive.
How Can You Use the Decode MAT in Your Trading?
This toolkit is incredibly versatile and can be adapted to various trading strategies:
Trend Identification:
Use longer-term MAs (e.g., 50, 100, 200 period) to identify the prevailing market trend. When prices are consistently above these MAs, it suggests an uptrend, and vice-versa.
Observe the MA ribbons: A consistently green ribbon can indicate a strong uptrend, while a red ribbon can signal a downtrend. The widening or narrowing of the ribbon can also suggest changes in trend momentum.
Dynamic Support & Resistance:
Shorter-term MAs (e.g., 10, 20 period EMAs) can act as dynamic levels of support in an uptrend or resistance in a downtrend. Look for price pullbacks to these MAs as potential entry opportunities.
Crossover Signals (Entries & Exits):
Golden Cross / Death Cross: Configure alerts for classic crossover signals. For example, a 50-period MA crossing above a 200-period MA (Golden Cross) is often seen as a long-term bullish signal. Conversely, a 50-period MA crossing below a 200-period MA (Death Cross) can be a bearish signal.
Shorter-Term Signals: Use crossovers of shorter-term MAs (e.g., EMA 10 crossing EMA 20) for more frequent, shorter-term trading signals. A fast MA crossing above a slow MA can signal a buy, while a cross below can signal a sell.
Use the on-chart symbols for quick visual confirmation of these crossover events.
Confirmation Tool:
Combine the Decode MAT with other indicators (like RSI, MACD, or volume analysis) to confirm signals and increase the probability of successful trades. For instance, a bullish MA crossover combined with an oversold RSI reading could strengthen a buy signal.
Multi-Timeframe Analysis:
Apply the toolkit across different timeframes to get a broader market perspective. A long-term uptrend on the daily chart, confirmed by a short-term bullish crossover on the 1-hour chart, can provide a higher-confidence entry.
The DECODE Moving Average Toolkit empowers you to tailor your MA analysis precisely to your needs.

A.K Dynamic EMA/SMA / MTF S&R Zones Toolkit with AlertsThe A.K Dynamic EMA/SMA / MTF Support & Resistance Zones Toolkit is a powerful all-in-one technical analysis tool designed for traders who want a clean yet comprehensive market view. Whether you're scalping lower timeframes or swing trading higher timeframes, this indicator gives you both the structure and signals to take action with confidence.
Key Features:
✅ Customizable EMA/SMA Suite
Display key Exponential and Simple Moving Averages including 5, 9, 20, 50, 100, and 200 EMAs, plus optional 50 SMA for trend filtering. Each line can be toggled individually and color-customized.
✅ Multi-Timeframe Support & Resistance Zones
Automatically detects dynamic S/R zones on key timeframes (5min, 15min, 30min, 1H, 4H, 1D) using swing highs/lows. Zones are color-coded by strength and whether they're broken or active, providing a clear visual roadmap for price reaction levels.
✅ Zone Strength & Break Detection
Distinguishes between strong and weak zones based on price proximity and reaction depth, with visual shading and automatic label updates when a level is broken.
✅ Price Action-Based Buy/Sell Signals
Generates BUY signals when bullish candles react to strong support (supply) zones, and SELL signals when bearish candles react to strong resistance (demand) zones. All logic is adjustable — including candle body vs wick detection, tolerance range, and strength thresholds.
✅ Alerts Engine
Built-in TradingView alerts for price touching support/resistance or triggering buy/sell signals. Perfect for automation or hands-free monitoring.
✅ Optional Candle & Trend Filters
Highlight bullish/bearish candles visually for additional confirmation.
Optional RSI display and 50-period SMA trend filter to guide directional bias.
🧠 Use Case Scenarios:
Identify dynamic supply & demand zones across multiple timeframes.
Confirm trend direction with EMAs and SMA filters.
React quickly to clean BUY/SELL signals based on actual price interaction with strong zones.
Customize it fully to suit scalping, day trading, or swing trading strategies.
📌 Recommended Settings:
Use default zone transparency (65%) and offset (250 bars) for optimal visual clarity.
Enable alerts to get notified when price enters key S/R levels or when a trade signal occurs.
Combine this tool with your entry/exit plan for better decision-making under pressure.
💡 Pro Tip: Add this indicator to a clean chart and let the zones + EMAs guide your directional bias. Use alerts to avoid screen-watching and improve discipline.
Created by:
Version: Pine Script v6
Platform: TradingView

Chandelier Exit with ZLSMA SwiftEdgeChandelier Exit with ZLSMA
Overview
The "Chandelier Exit with ZLSMA" indicator is a powerful trading tool designed to identify trend reversals and high-probability entry points in financial markets. By combining the volatility-based Chandelier Exit with the low-lag Zero Lag Least Squares Moving Average (ZLSMA), this indicator provides clear Buy and Sell signals, enhanced with a unique signal strength score to help traders prioritize high-quality opportunities. Visual enhancements, including dynamic color coding, background highlights, and trend arrows, make it intuitive and visually appealing for both novice and experienced traders.
What It Does
This indicator generates Buy and Sell signals when a trend reversal is detected by the Chandelier Exit, but only if the price crosses the ZLSMA for the first time in the direction of the trend. Each signal is accompanied by a percentage score (0-100%) that measures its strength based on price movement and momentum. The indicator overlays directly on the price chart, displaying:
Buy/Sell labels with signal strength (e.g., "Buy (85%)").
A ZLSMA line that changes color (green for bullish, red for bearish) to indicate trend direction.
Background highlights to mark signal candles.
Trend arrows to visually confirm signal points.
How It Works
The indicator combines two complementary components:
Chandelier Exit:
Uses the Average True Range (ATR) to create dynamic trailing stop levels (long_stop and short_stop) that adapt to market volatility.
Signals a Buy when the price crosses above the short stop (indicating a potential uptrend) and a Sell when it crosses below the long stop (indicating a potential downtrend).
Default settings use an ATR period of 1 and a multiplier of 2.0 for high sensitivity to short-term price movements.
Zero Lag LSMA (ZLSMA):
A low-lag moving average based on linear regression, designed to reduce delay compared to traditional moving averages.
Acts as a trend filter: Buy signals are only generated when the price closes above ZLSMA for the first time, and Sell signals when it closes below for the first time.
Default length of 50 balances smoothness with responsiveness.
Signal Strength Score:
Each signal is assigned a score (0-100%) based on:
Distance to ZLSMA (60% weight): How far the price is from ZLSMA, normalized by ATR. Larger distances indicate stronger breakouts.
Candlestick size (40% weight): The size of the signal candle, normalized by ATR. Larger candles suggest stronger momentum.
A high score (e.g., >80%) indicates a robust signal, while a low score (e.g., <50%) suggests caution.
Visual Features:
The ZLSMA line changes color (green for bullish, red for bearish) to reflect the trend.
Signal candles are highlighted with a subtle green (Buy) or red (Sell) background.
Tiny triangular arrows appear below Buy signals and above Sell signals for clear visual confirmation.
Why Combine Chandelier Exit and ZLSMA?
The Chandelier Exit excels at identifying trend reversals through volatility-based stops, but it can generate false signals in choppy markets due to its sensitivity (especially with a short ATR period of 1). The ZLSMA addresses this by acting as a trend filter, ensuring signals are only triggered when the price confirms a trend by crossing the ZLSMA for the first time. This combination reduces noise and focuses on high-probability setups. The signal strength score further enhances decision-making by quantifying the conviction behind each signal, making the indicator feel intuitive and "smart."
How to Use
Setup:
Add the indicator to your chart in TradingView.
Adjust inputs in the settings panel:
ATR Period (default: 1): Controls the sensitivity of Chandelier Exit. Increase for smoother signals.
ATR Multiplier (default: 2.0): Sets the distance of stop levels from price extremes.
ZLSMA Length (default: 50): Adjusts the smoothness of the ZLSMA line. Shorter lengths (e.g., 20-30) are more responsive; longer lengths (e.g., 50-100) are smoother.
Use Close Price for Extremums (default: true): Determines whether Chandelier Exit uses closing prices or high/low prices for calculations.
Interpreting Signals:
Buy Signal: A green "Buy (X%)" label appears below a candle when the price crosses above the Chandelier Exit short stop and closes above ZLSMA for the first time. The percentage indicates signal strength (higher = stronger).
Sell Signal: A red "Sell (X%)" label appears above a candle when the price crosses below the Chandelier Exit long stop and closes below ZLSMA for the first time.
Use the ZLSMA line’s color (green for bullish, red for bearish) to confirm the overall trend.
Prioritize signals with high strength scores (e.g., >70%) for better reliability.
Trading Considerations:
Combine signals with other analysis (e.g., support/resistance, volume) for confirmation.
Test the indicator on a demo account or use TradingView’s Strategy Tester to evaluate performance.
Be cautious with the default ATR period of 1, as it is highly sensitive and may generate frequent signals in volatile markets.
What Makes It Unique
This indicator stands out due to its thoughtful integration of Chandelier Exit and ZLSMA, creating a synergy that balances sensitivity with reliability. The first-cross filter ensures signals are triggered only at the start of potential trends, reducing false positives. The signal strength score adds a layer of intelligence, helping traders assess the quality of each signal without needing external tools. Visual enhancements, such as dynamic ZLSMA coloring, background highlights, and trend arrows, make the indicator user-friendly and visually engaging, appealing to traders seeking a modern, intuitive tool.
Limitations and Notes
The short ATR period (1) makes the indicator highly sensitive, which suits short-term traders but may produce noise in sideways markets. Increase the ATR period for smoother signals.
The signal strength score is a heuristic based on price movement and momentum, not a predictive model. Use it as a guide, not a definitive predictor.
Always backtest the indicator on your preferred market and timeframe to ensure it aligns with your trading strategy.

Combined EMA/Smiley & DEM System## 🔷 General Overview
This script creates an advanced technical analysis system for TradingView, combining multiple Exponential Moving Averages (EMAs), Simple Moving Averages (SMAs), dynamic Fibonacci levels, and ATR (Average True Range) analysis. It presents the results clearly through interactive, real-time tables directly on the chart.
---
## 🔹 Indicator Structure
The script consists of two main parts:
### **1. EMA & SMA Combined System with Fibonacci**
- **Purpose:**
Provides visual insights by comparing multiple EMA/SMA periods and identifying significant dynamic price levels using Fibonacci ratios around a calculated "Golden" line.
- **Components:**
- **Moving Averages (MAs)**:
- 20 EMAs (periods from 20 to 400)
- 20 SMAs (also from 20 to 400)
- **Golden Line:**
Calculated as the average of all EMAs and SMAs.
- **Dynamic Fibonacci Levels:**
Key ratios around the Golden line (0.5, 0.618, 0.786, 1.0, 1.272, 1.414, 1.618, 2.0) dynamically adjust based on market conditions.
- **Fibonacci Labels:**
Labels are shown next to Fibonacci lines, indicating their numeric value clearly on the chart.
- **Table (Top Right Corner):**
- Displays:
- **Input:** EMA/SMA periods sorted by their current average price levels.
- **AVG:** The average of corresponding EMA & SMA pairs.
- **EMA & SMA Values:** Individual EMA/SMA values clearly marked.
- **Dynamic Highlighting:** Highlights the row whose average (EMA+SMA)/2 is closest to the current price, helping identify immediate price action significance.
- **Sorting Logic:**
Each EMA/SMA pair is dynamically sorted based on their average values. Color coding (red/green) is used:
- **Green:** EMA/SMA pairs with shorter periods when their average is lower.
- **Red:** EMA/SMA pairs with longer periods when their average is lower.
- **Star (⭐):** Represents the "Golden" average clearly.
---
### **2. DEM System (Dynamic EMA/ATR Metrics)**
- **Purpose:**
Provides detailed ATR statistics to assess market volatility clearly and quickly.
- **Components:**
- **Moving Averages:**
- SMA lines: 25, 50, 100, 200.
- **Bollinger Bands:**
- Based on 20-period SMA of highs and standard deviation of lows.
- **ATR Analysis:**
- ATR calculations for multiple periods (1-day, 10, 20, 30, 40, 50).
- **ATR Premium:** Average ATR of all calculated periods, providing an overarching volatility indicator.
- **ATR Table (Bottom Right Corner):**
- Displays clearly structured ATR values and percentages relative to the current close price:
- Columns: **ATR Period**, **Value**, and **% of Close**.
- Rows: Each specific ATR (1D, 10, 20, 30, 40, 50), plus ATR premium.
- The ATR premium is highlighted in yellow to signify its importance clearly.
---
## 🔹 Key Features and Logic Explained
- **Dynamic EMA/SMA Sorting:**
The script computes the average of each EMA/SMA pair and sorts them dynamically on each bar, highlighting their relative importance visually. This allows traders to easily interpret the strength of current support/resistance levels based on moving averages.
- **Closest EMA/SMA Pair to Current Price:**
Calculates the absolute difference between the current price and all EMA/SMA averages, highlighting the closest one for quick reference.
- **Fibonacci Ratios:**
- Dynamically calculated Fibonacci levels based on the "Golden" EMA/SMA average give clear visual guidance for potential targets, supports, and resistances.
- Labels are continuously updated and placed next to levels for clarity.
- **ATR Volatility Analysis:**
- Provides immediate insight into market volatility with absolute and relative (percentage-based) ATR values.
- ATR premium summarizes volatility across multiple timeframes clearly.
---
## 🔹 Practical Use Case:
- Traders can quickly identify support/resistance and critical price zones through EMA/SMA and Fibonacci combinations.
- Useful in assessing immediate volatility, guiding stop-loss and take-profit levels through detailed ATR metrics.
- The dynamic highlighting in tables provides intuitive, real-time decision support for active traders.
---
## 🔹 How to Use this Script:
1. **Adjust EMA & SMA Lengths** from indicator settings if different periods are preferred.
2. **Monitor dynamic Fibonacci levels** around the "Golden" average to identify possible reversal or continuation points.
3. **Check EMA/SMA table:** Rows highlighted indicate immediate significance concerning current market price.
4. **ATR table:** Use volatility metrics for better risk management.
---
## 🔷 Conclusion
This advanced Pine Script indicator efficiently combines multiple EMAs, SMAs, dynamic Fibonacci retracement levels, and volatility analysis using ATR into a comprehensive real-time analytical tool, enhancing traders' decision-making capabilities by providing clear and actionable insights directly on the TradingView chart.

Phase Cross Strategy with Zone### Introduction to the Strategy
Welcome to the **Phase Cross Strategy with Zone and EMA Analysis**. This strategy is designed to help traders identify potential buy and sell opportunities based on the crossover of smoothed oscillators (referred to as "phases") and exponential moving averages (EMAs). By combining these two methods, the strategy offers a versatile tool for both trend-following and short-term trading setups.
### Key Features
1. **Phase Cross Signals**:
- The strategy uses two smoothed oscillators:
- **Leading Phase**: A simple moving average (SMA) with an upward offset.
- **Lagging Phase**: An exponential moving average (EMA) with a downward offset.
- Buy and sell signals are generated when these phases cross over or under each other, visually represented on the chart with green (buy) and red (sell) labels.
2. **Phase Zone Visualization**:
- The area between the two phases is filled with a green or red zone, indicating bullish or bearish conditions:
- Green zone: Leading phase is above the lagging phase (potential uptrend).
- Red zone: Leading phase is below the lagging phase (potential downtrend).
3. **EMA Analysis**:
- Includes five commonly used EMAs (13, 26, 50, 100, and 200) for additional trend analysis.
- Crossovers of the EMA 13 and EMA 26 act as secondary buy/sell signals to confirm or enhance the phase-based signals.
4. **Customizable Parameters**:
- You can adjust the smoothing length, source (price data), and offset to fine-tune the strategy for your preferred trading style.
### What to Pay Attention To
1. **Phases and Zones**:
- Use the green/red phase zone as an overall trend guide.
- Avoid taking trades when the phases are too close or choppy, as it may indicate a ranging market.
2. **EMA Trends**:
- Align your trades with the longer-term trend shown by the EMAs. For example:
- In an uptrend (price above EMA 50 or EMA 200), prioritize buy signals.
- In a downtrend (price below EMA 50 or EMA 200), prioritize sell signals.
3. **Signal Confirmation**:
- Consider combining phase cross signals with EMA crossovers for higher-confidence trades.
- Look for confluence between the phase signals and EMA trends.
4. **Risk Management**:
- Always set stop-loss and take-profit levels to manage risk.
- Use the phase and EMA zones to estimate potential support/resistance areas for exits.
5. **Whipsaws and False Signals**:
- Be cautious in low-volatility or sideways markets, as the strategy may generate false signals.
- Use additional indicators or filters to avoid entering trades during unclear market conditions.
### How to Use
1. Add the strategy to your chart in TradingView.
2. Adjust the input settings (e.g., smoothing length, offsets) to suit your trading preferences.
3. Enable the strategy tester to evaluate its performance on historical data.
4. Combine the signals with your own analysis and risk management plan for best results.
This strategy is a versatile tool, but like any trading method, it requires proper understanding and discretion. Always backtest thoroughly and trade with discipline. Let me know if you need further assistance or adjustments to the strategy!

Moving Averages Ribbon (7 EMAs/SMAs)This Indicator provides a combination which is suitable for visualizing many Simple Moving Averages (SMAs) and Exponential Moving Averages (EMAs). There are 7 possible periods 5,9,20,50,100,200,250. There is a possibility to show only EMAs or only SMAs or both. EMAs have thinner curves by default, to be able to distinguish them from SMAs. Additionally, there are highlighted channels between the MAs of the highs and the MAs of the lows, showing a channel of specific moving averages. It comes with a presetting showing EMAs 5,9,20,50,200 and SMAs 9,20,50,200, while the MA channels are only visible for 9 and 50.
EMAs:
SMAs:
Both
MultiMA-v5 - Multiple Moving Average indicatorsMultiple Moving Average indicators (MultiMA)
This script is drawing several Moving Average (MA) indicators for different lengths and timeframes in the main chart pane.
MultiMA can be controlled as a single entity, which makes it very comfortable and space saving tool.
Each particular MA graph can be enabled or disabled and also marked with the corresponding text label.
MultiMA includes EMA (Exponential Moving Average) and SMA (Simple Moving Average).
The list of the lengths/timeframes are:
1) both EMA and SMA:
for 1 hour, 4 hours, 1 day, 1 week timeframes and
for 20, 50, 100 and 200 lengths.
(excluding EMA/SMA 200 1 hour as they overlap with EMA/SMA 50 4 hours)
2) EMA only:
1 minute 33, 84, 163 lengths,
5 minutes 50, 84, 115, 144, 163 lengths,
30 minutes 84, 163 lengths.

Awesome Indicator# Moving Average Ribbon with ADR% - Complete Trading Indicator
## Overview
The **Moving Average Ribbon with ADR%** is a comprehensive technical analysis indicator that combines multiple analytical tools to provide traders with a complete picture of price trends, volatility, relative performance, and position sizing guidance. This multi-faceted indicator is designed for both swing and positional traders looking for data-driven entry and exit signals.
## Key Components
### 1. Moving Average Ribbon System
- **4 Customizable Moving Averages** with default periods: 13, 21, 55, and 189
- **Multiple MA Types**: SMA, EMA, SMMA (RMA), WMA, VWMA
- **Color-coded visualization** for easy trend identification
- **Flexible configuration** allowing users to modify periods, types, and colors
### 2. Average Daily Range Percentage (ADR%)
- Calculates the average daily volatility as a percentage
- Uses a 20-period simple moving average of (High/Low - 1) * 100
- Helps traders understand the stock's typical daily movement range
- Essential for position sizing and stop-loss placement
### 3. Volume Analysis (Up/Down Ratio)
- Analyzes volume distribution over the last 55 periods
- Calculates the ratio of volume on up days vs down days
- Provides insight into buying vs selling pressure
- Values > 1 indicate more buying volume, < 1 indicate more selling volume
### 4. Absolute Relative Strength (ARS)
- **Dual timeframe analysis** with customizable reference points
- **High ARS**: Performance relative to benchmark from a high reference point (default: Sep 27, 2024)
- **Low ARS**: Performance relative to benchmark from a low reference point (default: Apr 7, 2025)
- Uses NSE:NIFTY as default comparison symbol
- Color-coded display: Green for outperformance, Red for underperformance
### 5. Relative Performance Table
- **5 timeframes**: 1 Week, 1 Month, 3 Months, 6 Months, 1 Year
- Shows stock performance **relative to benchmark index**
- Formula: (Stock Return - Index Return) for each period
- **Color coding**:
- Lime: >5% outperformance
- Yellow: -5% to +5% relative performance
- Red: <-5% underperformance
### 6. Dynamic Position Allocation System
- **6-factor scoring system** based on price vs EMAs (21, 55, 189)
- Evaluates:
- Price above/below each EMA
- EMA alignment (21>55, 55>189, 21>189)
- **Allocation recommendations**:
- 100% allocation: Score = 6 (all bullish signals)
- 75% allocation: Score = 4
- 50% allocation: Score = 2
- 25% allocation: Score = 0
- 0% allocation: Score = -2, -4, -6 (bearish signals)
## Display Tables
### Performance Table (Top Right)
Shows relative performance vs benchmark across multiple timeframes with intuitive color coding for quick assessment.
### Metrics Table (Bottom Right)
Displays key statistics:
- **ADR%**: Average Daily Range percentage
- **U/D**: Up/Down volume ratio
- **Allocation%**: Recommended position size
- **High ARS%**: Relative strength from high reference
- **Low ARS%**: Relative strength from low reference
## How to Use This Indicator
### For Trend Analysis
1. **Moving Average Ribbon**: Look for price above ascending MAs for bullish trends
2. **MA Alignment**: Bullish when shorter MAs are above longer MAs
3. **Color coordination**: Use consistent color scheme for quick visual analysis
### For Entry/Exit Timing
1. **Performance Table**: Enter when showing consistent outperformance across timeframes
2. **Volume Analysis**: Confirm entries with U/D ratio > 1.5 for strong buying
3. **ARS Values**: Look for positive ARS readings for relative strength confirmation
### For Position Sizing
1. **Allocation System**: Use the recommended allocation percentage
2. **ADR% Consideration**: Adjust position size based on volatility
3. **Risk Management**: Lower allocation in high ADR% stocks
### For Risk Management
1. **ADR% for Stop Loss**: Set stops at 1-2x ADR% below entry
2. **Relative Performance**: Reduce positions when consistently underperforming
3. **Volume Confirmation**: Be cautious when U/D ratio deteriorates
## Best Practices
### Timeframe Recommendations
- **Intraday**: Use lower MA periods (5, 13, 21, 55)
- **Swing Trading**: Default settings work well (13, 21, 55, 189)
- **Position Trading**: Consider higher periods (21, 50, 100, 200)
### Market Conditions
- **Trending Markets**: Focus on MA alignment and relative performance
- **Sideways Markets**: Rely more on ADR% for range trading
- **Volatile Markets**: Reduce allocation percentage regardless of signals
### Customization Tips
1. Adjust reference dates for ARS calculation based on significant market events
2. Change comparison symbol to sector-specific indices for better relative analysis
3. Modify MA periods based on your trading style and market characteristics
## Technical Specifications
- **Version**: Pine Script v6
- **Overlay**: Yes (plots on price chart)
- **Real-time Updates**: Yes
- **Data Requirements**: Minimum 252 bars for complete calculations
- **Compatible Timeframes**: All standard timeframes
## Limitations
- Performance calculations require sufficient historical data
- ARS calculations depend on selected reference dates
- Volume analysis may be less reliable in low-volume stocks
- Relative performance is only as good as the chosen benchmark
This indicator is designed to provide a comprehensive analysis framework rather than simple buy/sell signals. It's recommended to use this in conjunction with your overall trading strategy and risk management rules.

Psychological Levels- Rounding Numbers Psychological Levels Indicator
Overview:
The Psychological Levels Indicator automatically identifies and plots significant price levels based on psychological thresholds, which are key areas where market participants often focus their attention. These levels act as potential support or resistance zones due to human behavioral tendencies to round off numbers. This indicator dynamically adjusts the levels based on the stock's price range and ensures seamless visibility across the chart.
Key Features:
Dynamic Step Sizes:
The indicator adjusts the levels dynamically based on the stock price:
For prices below 500: Levels are spaced at 10.
For prices between 500 and 3000: Levels are spaced at 50, 100, and 1000.
For prices between 3000 and 10,000: Levels are spaced at 100 and 1000.
For prices above 10,000: Levels are spaced at 500 and 1000.
Extended Visibility:
The plotted levels are extended across the entire chart for improved visualization, ensuring traders can easily monitor these critical zones over time.
Customization Options:
Line Color: Choose the color for the levels to suit your charting style.
Line Style: Select from solid, dashed, or dotted lines.
Line Width: Adjust the thickness of the lines for better clarity.
Clean and Efficient Design:
The indicator only plots levels relevant to the visible chart range, avoiding unnecessary clutter and ensuring a clean workspace.
How It Works:
It calculates the relevant step sizes based on the price:
Smaller step sizes for lower-priced stocks.
Larger step sizes for higher-priced stocks.
Primary, secondary, and (if applicable) tertiary levels are plotted dynamically:
Primary Levels: The most granular levels based on the stock price.
Secondary Levels: Higher-order levels for broader significance.
Tertiary Levels: Additional levels for lower-priced stocks to enhance detail.
These levels are plotted across the chart, allowing traders to visualize key psychological areas effortlessly.
Use Cases:
Day Trading: Identify potential intraday support and resistance levels.
Swing Trading: Recognize key price zones where trends may pause or reverse.
Long-Term Investing: Gain insights into significant price zones for entry or exit strategies.