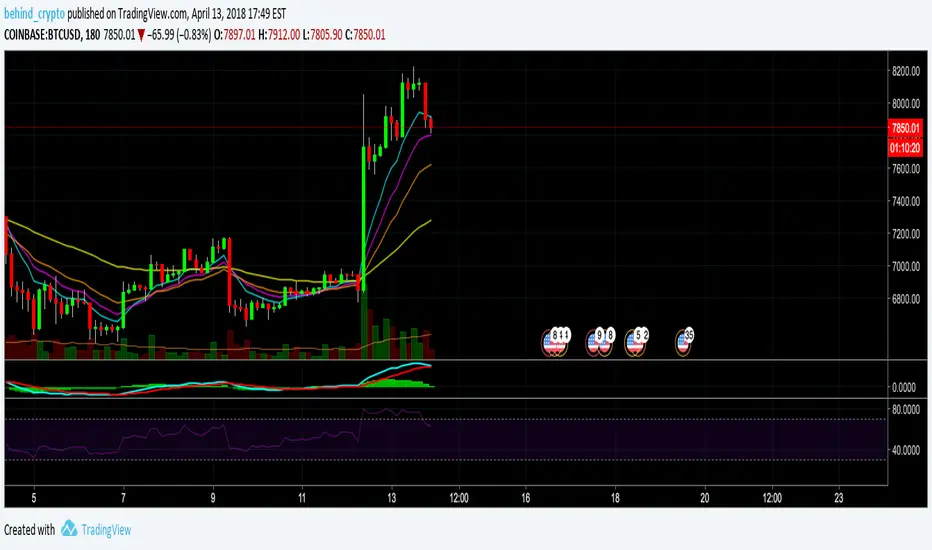
ALL Philakone's EMA's (8,13,21,55,100, 200)These are Philakone's EMA's. I added the 100 day in there as I didn't see that anyone had done that.
The 100 might be the same color as the 200 looking at the code, I changed it on my chart, but just make sure you check the colors.
ابحث في النصوص البرمجية عن "细算江西救护车家长倒赚了四万三+-医疗花费13万(家长视频)++医保报"

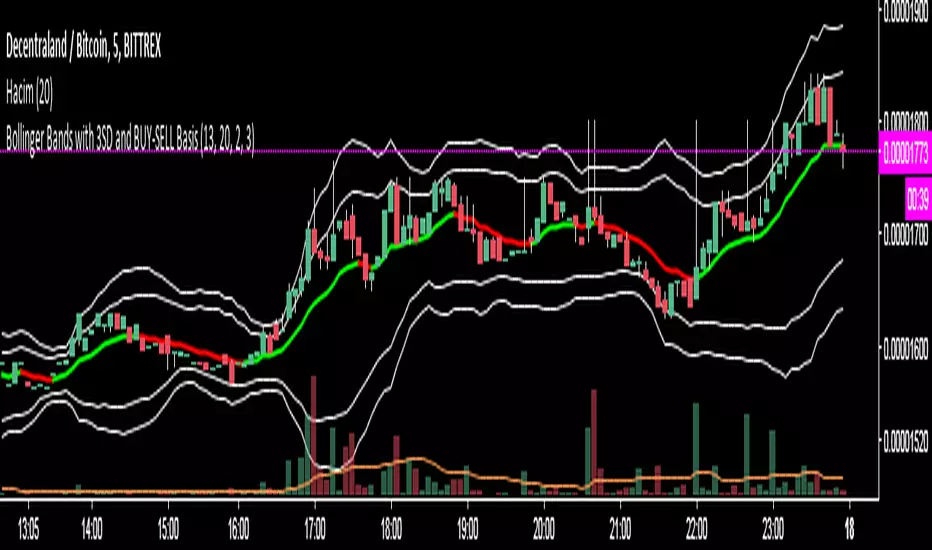
Bollinger Bands with 3SD and BUY-SELL Basis*The white lines(both inner and outer ones) are from original Bollinger Bands (calculated as SMA20+SD and SMA20-SD).
*Inner lines are calculated with 2 Standard Deviation ( as classical Bollinger Bands ) and outer ones are with 3 Standard Deviation.
*3 SD calculation is important because, it is useful to investigate further the volatility.
*Classical Bollinger Bands Basis is included in calculations to obtain the bands, but the basis isn't plotted (SMA20).
*For Basis, a-13 bar EMA line is added which tells "BUY" when GREEN, and which tells "SELL" when RED.
*Generally, this code is good to further investigate the volatility especially by the help of 3SD lines. It is particularly important for crypto currencies which are generally highly volatile. On the other hand, the basis will tell BUY-SELL points and BUY-SELL points can be confirmed further, by investigating classical Bollinger Bands rules and anticipate about the volatility.
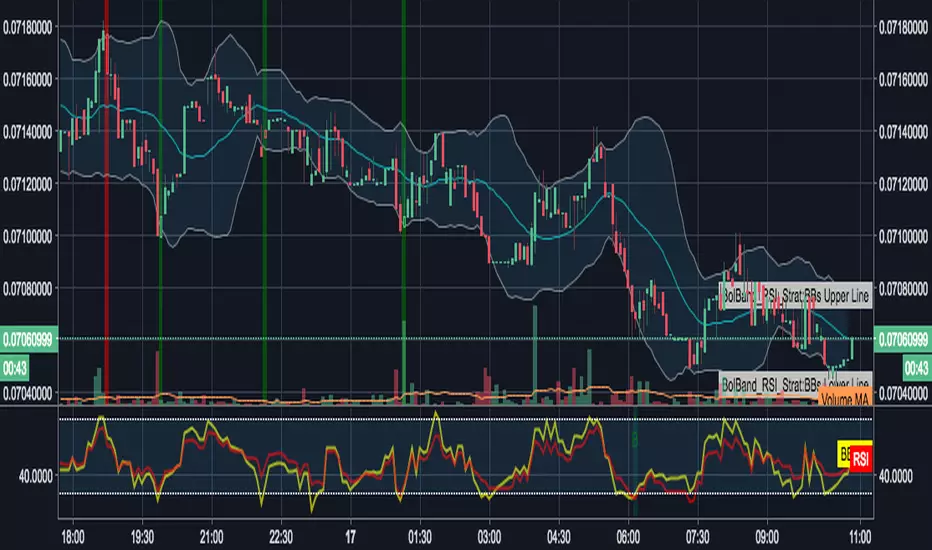
Bollinger Bands + RSI Double Strategy (by SlumdogTrader)
// SlumdogTrader's Bollinger Bands + RSI Double Strategy - Profit Trailer
//
// Version 1.0
// Script by SlumdogTrader on July Fri 13(!), 2018.
//
// This strategy uses a normalise Bollinger Bands + RSI.
//
// Bollinger Band triggers
// SELL - when the price is above the upper band.
// BUY - when the price is below the lower band.
//
// RSI triggers
// SELL - when the price is above 55.
// BUY - when the price is below 45.
//
// This simple strategy only triggers when
// both the BB and the RSI
// indicators, at the same time, are in
// a overbought or oversold condition.
//
// Visit my TradingView work at:
// www.tradingview.com
//
// Visit my website at:
// www.slumdogtrader.com
Fibonacci EMAFibonacci EMAs (8,13,21,34,55) and Slow EMAs (100,200) for trend as well as S/R determination
Tylers Volume Weighted MACD EMAI use this script to find divergence in price. It's just a volume weighted MACD that uses an exponential moving average as the signal. My setting is always on (5,13,8).


[f(x)] Bollinger Donchian RemixThis is my version of a mixture of Bollinger and Donchian (BB/DC Remix)
It is a modified fork of Dolchian/Bollinger Hybrid by Ricardo Santos ( DBH.V0)
this is the two pictures comparing it.
Made this Fork because Santos' code starts getting chopping with my type of settings.
His time input is 24, but mine varies between 13 and 21.
You really notice in scalping and sometimes intraday timeframes with my settings.
His also differ from mine based on the trendline, where he modifies his Simple Moving Average, which is default color is black, and I use the the default one, which the default color is red.
Also you can change the trendline type input (open,close,hl2,etc...) to tailor your preference.
Note: Default is close, Santos use hl2, I use ohlc4.

Philakone EMA (8,13,21,55,200)Philakone's EMAs all in one indicator, including his recently added 200 line he uses in his recent analysis. :)

Ice Yolo RSI Public//Created By ChrisMoody on 8/15/2014
//Uploaded By Iceberg on 6/13/2018
//This script allovvs you to set up to 3 different length RSI at the same time. I usually use tvvo.
//Chris removed his script and someone asked mine. I simplified a lot of lines.
//This script shovvs highlighted background vvhen your First RSI is in oversold or overbought zone, and flashes vvhen
//it crosses the lines. You can use it to check crossings or bounces of different lengths too.
//The settings highly depends on your Timeframe AND trading style. So make sure they match you as you like. I don't recommend using
//the default ones! Thanks for using, and thanks again Chris Moody!

MA Cross + KillzonesCombines oscarvs' BTC Killzones with four EMAs and the trader's 13/49 golden cross as well as the investor's 50/200 golden cross. Note that the killzones highlight the first two hours of market action in each of the three main crypto markets, so this time period will have to be adjusted for daylight savings time in April and in November.


Simple profitable trading strategyThis strategy has three components.
Philakones EMAs are a sequence of five fibonacci EMAs. They range from 55 candles (green) to 8 candles (red) in length. A strong trend or breakout is marked by the emas appearing in sequence of their length from 8 to 55 or vice versa. These EMAs are also used to signal an exit. Only two EMAs are used for exit signals - when the 13 EMA crosses over/under the 55 EMA.
RSI gives a bullish signal when 40 > rsi > 70. Exit signals are oversold (30) or overbought (70)
Stochastics give a bullish signal when stoch < 80 and an exit signal when > 95.
Results include 3 ticks of slippage and taker fees of .002. Provides a pretty smooth equity curve with a 73% win rate and beats buy and hold by than 10x (returns about 60x overall) since start of 2017.

Bitmex Liquidation levels VWMA'sThis script creates multiple MA's that signal likely price boundaries and trends. They are volume-weighted moving averages multiplied with Bitmex's liquidation level multiplicator.
Do not buy green MA touch and do not sell red MA touches.
//Recommended settings:
//M3: len = 300
//M5: len = 100
//M15: len = 50-75
//m30: len = 35
//h1: len = 13
//h4: len = 7
//h12: len = 3

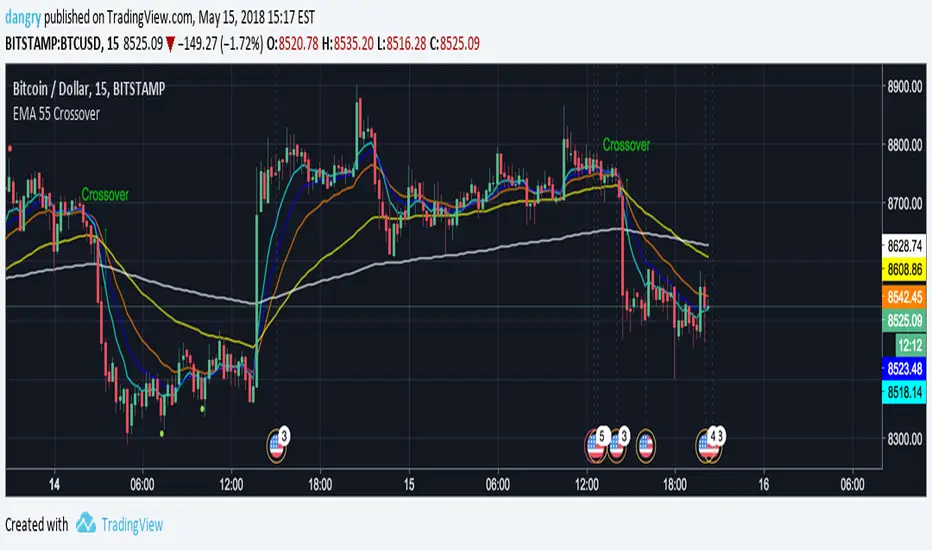
EMA 55 CrossoverBasically what this does is to flag when EMA 55 crosses over EMA 8, 13, 21, and 200. This strategy was described by @Philakone on this tweet , but I'm not really sure if this is the correct strategy he described.

Philakone style four Moving AveragesThis script provides 4 moving averages (8, 13, 21, and 55) consistent with Philakone's moving average tutorial.

FIB EMAs4 EMAs for the FIB numbers - 8, 13, 21 and 55
Can be used as a single indicator, so can have e.g. MACD and RSI also available
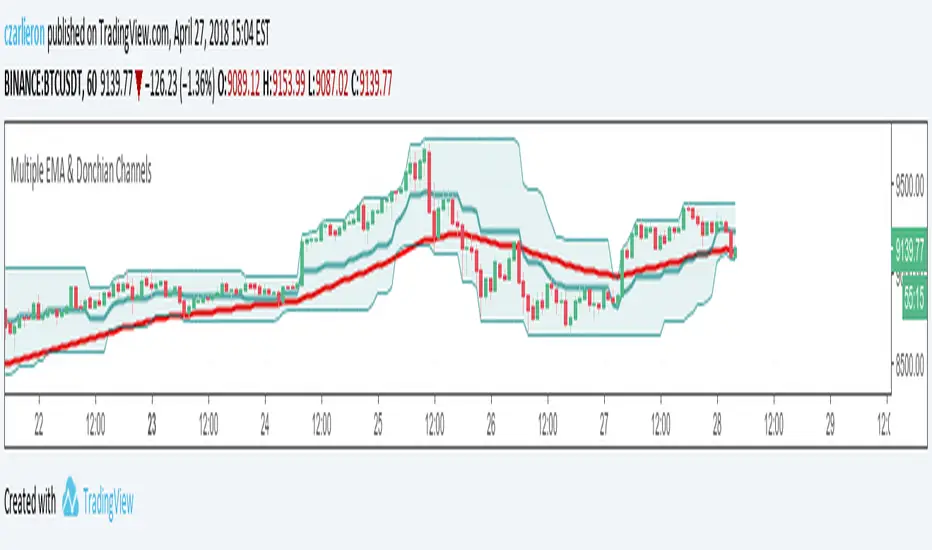
My Multiple EMA with Donchian ChannelsDonchian Channels with EMA's 8, 13, 21, 34, 55, 89 (fib numbers). Everything is configurable.
Moving Averages Bundle (EMA/SMA)Ver.4 (4/25/18)
EMA and SMA indicators ALL in one!
Default: SMA (20, 50, 100, 200) or EMA (8, 13, 21, 55)
Save your TV indicator use counts by using SMA/EMA
Functionality all in one indicator:
1) Toggle between Exponential or Simple moving averages.
2) Customize and or input your very own MA's by simply changing the input options from default.
3) Change color combos.
4) Turn off/on only the SMA/EMA's that you require.

Moving Average Exponential (Zio EMA 6)6 time frames of ema 8, 13, 21, 55, 100, 200 combined in 1 indicator

Fibonacci Exponential Moving Averages ( EMA )Here you can have 4 EMA on one indicator. The inputs are for 8, 13, 21 and 55 previous open&close which are from Fibonacci sequence.
How to : To use the script, click on "Add to Favourite Scripts", then load the script from Indicators on the Chart.
Fibonacci Exponential Moving Averages ( EMA )
Have 8, 13, 21 and 55 EMA on one indicator ! enjoy :)
R.N