Multi Scanner Plot & Table V1Here's how to interpret each column in the table:
Price vs MAs:
What it shows: Where the current price is relative to the short-term (e.g., 20-period) and long-term (e.g., 50-period) Simple Moving Averages (SMAs) calculated on your current chart's timeframe.
Interpretation:
Above Both (Green background): Price is above both the short and long MAs. Generally considered a bullish sign for the current trend.
Below Both (Red background): Price is below both MAs. Generally considered a bearish sign.
Mixed (Gray background): Price is between the two MAs (e.g., above the short but below the long, or vice-versa). Indicates indecision or a potential trend change.
RSI Value:
What it shows: The actual numerical value of the Relative Strength Index (RSI) calculated on your current chart's timeframe.
Interpretation: Just the raw RSI number (e.g., 65.32). The background is always gray. You compare this value to standard overbought/oversold levels (like 70/30) or the levels defined in the script's inputs.
RSI Status:
What it shows: Interprets the RSI Value based on the Overbought/Oversold levels set in the script's inputs (default 70/30). Calculated on your current chart's timeframe.
Interpretation:
Overbought (Red background): RSI is above the overbought level (e.g., > 70). Suggests the asset might be due for a pullback or reversal downwards. Red indicates a potentially bearish condition.
Oversold (Green background): RSI is below the oversold level (e.g., < 30). Suggests the asset might be due for a bounce or reversal upwards. Green indicates a potentially bullish condition.
Neutral (Gray background): RSI is between the oversold and overbought levels.
Last Sig Price:
What it shows: The price level where the last "SIG NOW" Buy or Sell signal occurred on your current chart's timeframe.
Interpretation: Helps you see the entry price of the most recent short-term signal generated by this script. The background color matches the signal type: Green for the last Buy signal, Red for the last Sell signal. N/A if no signal has occurred yet.
SIG NOW:
What it shows: This is the main short-term signal generated by the script based on conditions on your current chart's timeframe. It combines the "Price vs MAs" status and specific RSI conditions (price must be above/below both MAs and RSI must be within a certain range defined in the inputs).
Interpretation:
BUY (Green background): The specific buy conditions are met right now. (Price above both MAs AND RSI is strong but not necessarily overbought).
SELL (Red background): The specific sell conditions are met right now. (Price below both MAs AND RSI is weak but not necessarily oversold).
NEUTRAL (Gray background): Neither the Buy nor the Sell conditions are currently met.
ALERT:
What it shows: Flags unusual volume activity on the current bar compared to the recent average volume (calculated on your current chart's timeframe).
Interpretation:
SPIKE (Yellow background, black text): Current volume is significantly higher than the recent average (defined by the Volume Spike Multiplier). Can indicate strong interest or a potential climax.
DUMP (Purple background): Current volume is significantly lower than the recent average (defined by the Volume Dump Multiplier). Can indicate fading interest.
NONE (Gray background): Volume is within the normal range for the lookback period.
SD$:
What it shows: The price level where the last Volume Spike or Dump occurred on your current chart's timeframe.
Interpretation: Shows the price associated with the most recent significant volume event. The background color indicates the type of the last event: Green if the last event was a Spike, Red if the last event was a Dump. N/A if no Spike/Dump has occurred yet.
BB Value (%B):
What it shows: This relates to Bollinger Bands, but specifically calculated on a Higher Timeframe (HTF) that you can set in the inputs (e.g., Daily BBs while viewing an Hourly chart). It shows the Bollinger Band Percent B (%B) value for that HTF. %B measures where the HTF closing price is relative to the HTF upper and lower bands.
Interpretation:
Value > 1: HTF price closed above the HTF upper Bollinger Band.
Value < 0: HTF price closed below the HTF lower Bollinger Band.
Value between 0 and 1: HTF price closed within the HTF Bollinger Bands (e.g., 0.5 is exactly on the middle band).
The background is always gray.
LTS (Long Term Signal):
What it shows: A signal derived only from the Higher Timeframe (HTF) Bollinger Bands.
Interpretation:
BUY (Green background): The HTF price closed above the HTF upper Bollinger Band (see BB Value > 1). Considered a strong bullish signal from the higher timeframe perspective.
SELL (Red background): The HTF price closed below the HTF lower Bollinger Band (see BB Value < 0). Considered a strong bearish signal from the higher timeframe perspective.
NEUTRAL (Gray background): The HTF price closed within the HTF Bollinger Bands.
How to Understand Bollinger Bands and Signals in this Context:
Bollinger Bands are primarily used for the Long Term Signal (LTS) column. This script calculates BBs on a higher timeframe (you choose which one, or it defaults to the chart's timeframe if left blank).
The "LTS" signal triggers:
A BUY when the price on that higher timeframe closes above its upper Bollinger Band. This often indicates strong momentum or a potential breakout.
A SELL when the price on that higher timeframe closes below its lower Bollinger Band. This often indicates strong negative momentum or a potential breakdown.
The "BB Value" column gives you the raw %B number from that same higher timeframe, showing you exactly where the price is relative to the bands (is it just barely above/below, or way outside?).
The script does not directly use Bollinger Bands from the current chart timeframe for the "SIG NOW" or other table signals. The main short-term signals ("SIG NOW") rely on Moving Averages and RSI on the current timeframe. The LTS provides a longer-term perspective using HTF Bollinger Bands.
In summary: Look at the table to quickly gauge:
Short-term trend (Price vs MAs).
Short-term momentum (RSI Status, SIG NOW).
Recent short-term entry points (Last Sig Price).
Current volume anomalies (ALERT).
Long-term strength/weakness based on HTF Bollinger Bands (LTS, BB Value).
Combine these pieces of information to get a more rounded view of the current market conditions according to this specific script's logic.
ابحث في النصوص البرمجية عن "足球日本vs中国"

Easy MA SignalsEasy MA Signals
Overview
Easy MA Signals is a versatile Pine Script indicator designed to help traders visualize moving average (MA) trends, generate buy/sell signals based on crossovers or custom price levels, and enhance chart analysis with volume-based candlestick coloring. Built with flexibility in mind, it supports multiple MA types, crossover options, and customizable signal appearances, making it suitable for traders of all levels. Whether you're a day trader, swing trader, or long-term investor, this indicator provides actionable insights while keeping your charts clean and intuitive.
Configure the Settings
The indicator is divided into three input groups for ease of use:
General Settings:
Candlestick Color Scheme: Choose from 10 volume-based color schemes (e.g., Sapphire Pulse, Emerald Spark) to highlight high/low volume candles. Select “None” for TradingView’s default colors.
Moving Average Length: Set the MA period (default: 20). Adjust for faster (lower values) or slower (higher values) signals.
Moving Average Type: Choose between SMA, EMA, or WMA (default: EMA).
Show Buy/Sell Signals: Enable/disable signal plotting (default: enabled).
Moving Average Crossover: Select a crossover type (e.g., MA vs VWAP, MA vs SMA50) for signals or “None” to disable.
Volume Influence: Adjust how volume impacts candlestick colors (default: 1.2). Higher values make thresholds stricter.
Signal Appearance Settings:
Buy/Sell Signal Shape: Choose shapes like triangles, arrows, or labels for signals.
Buy/Sell Signal Position: Place signals above or below bars.
Buy/Sell Signal Color: Customize colors for better visibility (default: green for buy, red for sell).
Custom Price Alerts:
Custom Buy/Sell Alert Price: Set specific price levels for alerts (default: 0, disabled). Enter a non-zero value to enable.
Set Up Alerts
To receive notifications (e.g., sound, popup, email) when signals or custom price levels are hit:
Click the Alert button (alarm clock icon) in TradingView.
Select Easy MA Signals as the condition and choose one of the four alert types:
MA Crossover Buy Alert: Triggers on MA crossover buy signals.
MA Crossover Sell Alert: Triggers on MA crossover sell signals.
Custom Buy Alert: Triggers when price crosses above the custom buy price.
Custom Sell Alert: Triggers when price crosses below the custom sell price.
Enable Play Sound and select a sound (e.g., “Bell”).
Set the frequency (e.g., Once Per Bar Close for confirmed signals) and create the alert.
Analyze the Chart
Moving Average Line: Displays the selected MA with color changes (green for bullish, red for bearish, gray for neutral) based on price position relative to the MA.
Buy/Sell Signals: Appear as shapes or labels when crossovers or custom price levels are hit.
Candlestick Colors: If a color scheme is selected, candles change color based on volume strength (high, low, or neutral), aiding in trend confirmation.
Why Use Easy MA Signals?
Easy MA Signals is designed to simplify technical analysis while offering advanced customization. It’s ideal for traders who want:
A clear visualization of MA trends and crossovers.
Flexible signal generation based on MA crossovers or custom price levels.
Volume-enhanced candlestick coloring to identify market strength.
Easy-to-use settings with tooltips for beginners and pros alike.
This script is particularly valuable because it combines multiple features into one indicator, reducing chart clutter and providing actionable insights without overwhelming the user.
Benefits of Easy MA Signals
Highly Customizable: Supports SMA, EMA, and WMA with adjustable lengths.
Offers multiple crossover options (VWAP, SMA10, SMA20, etc.) for tailored strategies.
Custom price alerts allow precise targeting of key levels.
Volume-Based Candlestick Coloring: 10 unique color schemes highlight volume strength, helping traders confirm trends.
Adjustable volume influence ensures adaptability to different markets.
Flexible Signal Visualization: Choose from various signal shapes (triangles, arrows, labels) and positions (above/below bars).
Customizable colors improve visibility on any chart background.
Alert Integration: Built-in alert conditions for crossovers and custom prices support sound, email, and app notifications.
Easy setup for real-time trading decisions.
User-Friendly Design: Organized input groups with clear tooltips make configuration intuitive.
Suitable for beginners and advanced traders alike.
Example Use Cases
Swing Trading with MA Crossovers:
Scenario: A trader wants to trade Bitcoin (BTC/USD) on a 4-hour chart using an EMA crossover strategy.
Setup:
Set Moving Average Type to EMA, Length to 20.
Set Moving Average Crossover to “MA vs SMA50”.
Enable Show Buy/Sell Signals and choose “arrowup” for buy, “arrowdown” for sell.
Select “Emerald Spark” for candlestick colors to highlight volume surges.
Usage: Buy when the EMA20 crosses above the SMA50 (green arrow appears) and volume is high (dark green candles). Sell when the EMA20 crosses below the SMA50 (red arrow). Set alerts for real-time notifications.
Scalping with Custom Price Alerts:
Scenario: A day trader monitors Tesla (TSLA) on a 5-minute chart and wants alerts at specific support/resistance levels.
Setup:
Set Custom Buy Alert Price to 150.00 (support) and Custom Sell Alert Price to 160.00 (resistance).
Use “labelup” for buy signals and “labeldown” for sell signals.
Keep Moving Average Crossover as “None” to focus on price alerts.
Usage: Receive a sound alert and label when TSLA crosses 150.00 (buy) or 160.00 (sell). Use volume-colored candles to confirm momentum before entering trades.
When NOT to Use Easy MA Signals
High-Frequency Trading: Reason: The indicator relies on moving averages and volume, which may lag in ultra-fast markets (e.g., sub-second trades). High-frequency traders may need specialized tools with real-time tick data.
Alternative: Use order book or market depth indicators for faster execution.
Low-Volatility or Sideways Markets:
Reason: MA crossovers and custom price alerts can generate false signals in choppy, range-bound markets, leading to whipsaws.
Alternative: Use oscillators like RSI or Bollinger Bands to trade within ranges.
This indicator is tailored more towards less experienced traders. And as always, paper trade until you are comfortable with how this works if you're unfamiliar with trading! We hope you enjoy this and have great success. Thanks for your interested in Easy MA Signals!

Stochastic Overlay - Regression Channel (Zeiierman)█ Overview
The Stochastic Overlay – Regression Channel (Zeiierman) is a next-generation visualization tool that transforms the traditional Stochastic Oscillator into a dynamic price-based overlay.
Instead of leaving momentum trapped in a lower subwindow, this indicator projects the Stochastic oscialltor directly onto price itself — allowing traders to visually interpret momentum, overbought/oversold conditions, and market strength without ever taking their eyes off price action.
⚪ In simple terms:
▸ The Bands = The Stochastic Oscillator — but on price.
▸ The Midline = Stochastic 50 level
▸ Upper Band = Stochastic Overbought Threshold
▸ Lower Band = Stochastic Oversold Threshold
When the price moves above the midline → it’s the same as the oscillator moving above 50
When the price breaks above the upper band → it’s the same as Stochastic entering overbought.
When the price reaches the lower band →, think of it like Stochastic being oversold.
This makes market conditions visually intuitive. You’re literally watching the oscillator live on the price chart.
█ How It Works
The indicator layers 3 distinct technical elements into one clean view:
⚪ Stochastic Momentum Engine
Tracks overbought/oversold conditions and directional strength using:
%K Line → Momentum of price
%D Line → Smoothing filter of %K
Overbought/Oversold Bands → Highlight potential reversal zones
⚪ Volatility Adaptive Bands
Dynamic bands plotted above and below price using:
ATR * Stochastic Scaling → Creates wider bands during volatile periods & tighter bands in calm conditions
Basis → Moving average centerline (EMA, SMA, WMA, HMA, RMA selectable)
This means:
→ In strong trends: Bands expand
→ In consolidations: Bands contract
⚪ Regression Channel
Projects trend direction with different models:
Logarithmic → Captures non-linear growth (perfect for crypto or exponential stocks)
Linear → Classic regression fit
Adaptive → Dynamically adjusts sensitivity
Leading → Projects trend further ahead (aggressive mode)
Channels include:
Midline → Fair value trend
Upper/Lower Bounds → Deviation-based support/resistance
⚪ Heatmap - Bull & Bear Power Strength
Visual heatmeter showing:
% dominance of bulls vs bears (based on close > or < Band Basis)
Automatic normalization regardless of timeframe
Table display on-chart for quick visual insight
Dynamic highlighting when extreme levels are reached
⚪ Trend Candlestick Coloring
Bars auto-color based on trend filter:
Above Basis → Bullish Color
Below Basis → Bearish Color
█ How to Use
⚪ Trend Trading
→ Use Band direction + Regression Channel to identify trend alignment
→ Longs favored when price holds above the Basis
→ Shorts favored when price stays below the Basis
→ Use the Bull & Bear heatmap to asses if the bulls or the bears are in control.
⚪ Mean Reversion
→ Look for price to interact with Upper or Lower Band extremes
→ Stochastic reaching OB/OS zones further supports reversals
⚪ Momentum Confirmation
→ Crossovers between %K and %D can confirm continuation or divergence signals
→ Especially powerful when happening at band boundaries
⚪ Strength Heatmap
→ Quickly visualize current buyer vs seller control
→ Sharp spikes in Bull Power = Aggressive buying
→ Sharp spikes in Bear Power = Heavy selling pressure
█ Why It Useful
This is not a typical Stochastic or regression tool. The tool is designed for traders who want to:
React dynamically to price volatility
Map momentum into volatility context
Use adaptive regression channels across trend styles
Visualize bull vs bear power in real-time
Follow trends with built-in reversal logic
█ Settings
Stochastic Settings
Stochastic Length → Period of calculation. Higher = smoother, Lower = faster signals.
%K Smoothing → Smooths the Stochastic line itself.
%D Smoothing → Smooths the moving average of %K for slower signals.
Stochastic Band
Band Length → Length of the Moving Average Basis.
Volatility Multiplier → Controls band width via ATR scaling.
Band Type → Choose MA type (EMA, SMA, WMA, HMA, RMA).
Regression Channel
Regression Type → Logarithmic / Linear / Adaptive / Leading.
Regression Length → Number of bars for regression calculation.
Heatmap Settings
Heatmap Length → Number of bars to calculate bull/bear dominance.
-----------------
Disclaimer
The content provided in my scripts, indicators, ideas, algorithms, and systems is for educational and informational purposes only. It does not constitute financial advice, investment recommendations, or a solicitation to buy or sell any financial instruments. I will not accept liability for any loss or damage, including without limitation any loss of profit, which may arise directly or indirectly from the use of or reliance on such information.
All investments involve risk, and the past performance of a security, industry, sector, market, financial product, trading strategy, backtest, or individual's trading does not guarantee future results or returns. Investors are fully responsible for any investment decisions they make. Such decisions should be based solely on an evaluation of their financial circumstances, investment objectives, risk tolerance, and liquidity needs.

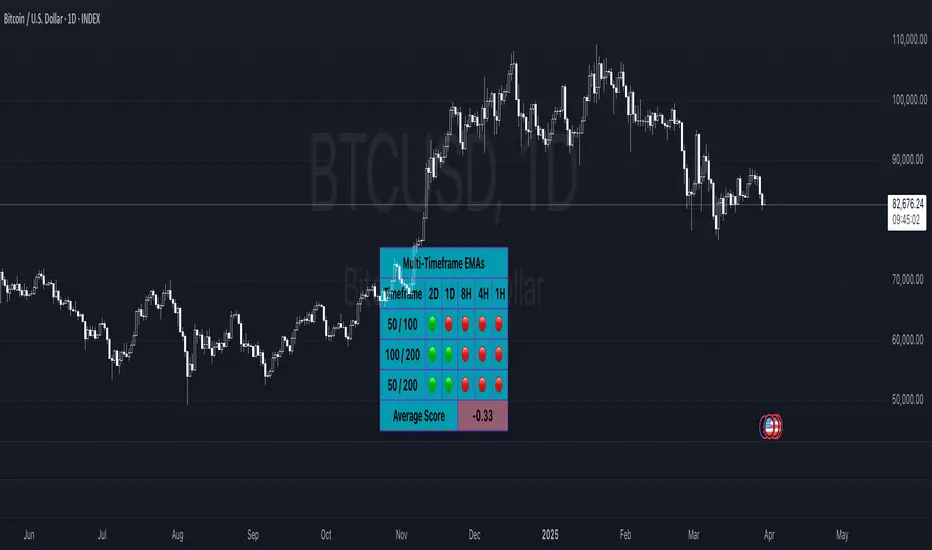
Multi-Timeframe EMAsMulti Timeframe EMA's
The 'Multi-Timeframe EMA Band Comparison' indicator is a tool designed to analyze trend direction across multiple timeframes using Exponential Moving Averages. it calculates the 50, 100, and 200 period EMAs for fiver user defined timeframes and compares their relationships to provide a visual snapshot of bullish or bearish momentum.
How it Works:
EMA Calculations: For each selected timeframe, the indicator computes the 50, 100, and 200 period EMAs based on the closing price.
Band Comparisons: Three key relationships are evaluated:
50 EMA vs 100 EMA
100 EMA vs 200 EMA
50 EMA vs 200 EMA
Scoring System: Each comparison is assigned a score:
🟢 (Green Circle): The shorter EMA is above the longer EMA, signaling bullish momentum.
🔴 (Red Circle): The shorter EMA is below the longer EMA, signaling bearish momentum.
⚪️ (White Circle): The EMAs are equal or data is unavailable (rare).
Average Score:
An overall average score is calculated across all 15 comparisons ranging from 1 to -1, displayed with two decimal places and color coded.
Customization:
This indicator is fully customizable from the timeframe setting to the color of the table. The only specific part that is not changeable is the EMA bands.
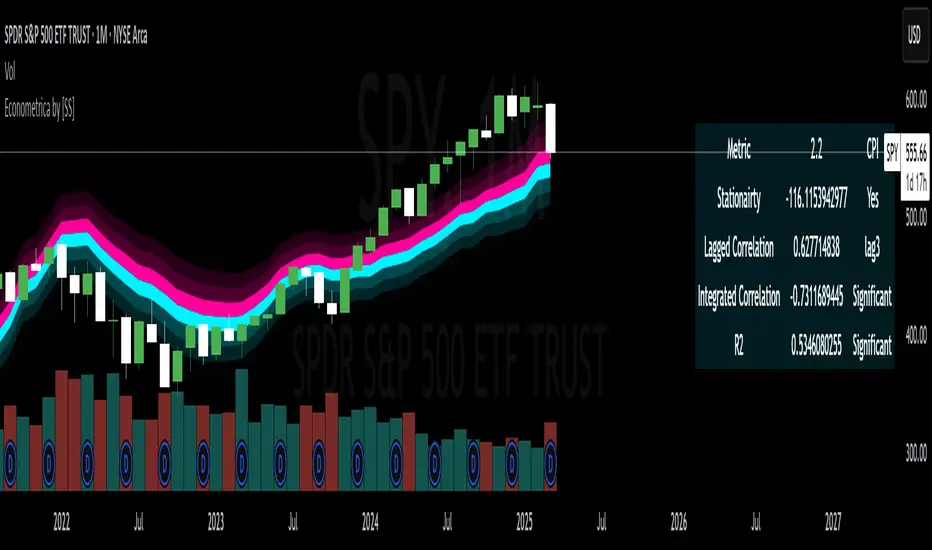
Econometrica by [SS]This is Econometrica, an indicator that aims to bridge a big gap between the resources available for analysis of fundamental data and its impact on tickers and price action.
I have noticed a general dearth of available indicators that offer insight into how fundamentals impact a ticker and provide guidance on how they these economic factors influence ticker behaviour.
Enter Econometrica. Econometrica is a math based indicator that aims to co-integrate and model indicator price action in relation to critical economic metrics.
Econometrica supports the following US based economic data:
CPI
Non-Farm Payroll
Core Inflation
US Money Supply
US Central Bank Balance Sheet
GDP
PCE
Let's go over the functions of Econometrica.
Creating a Regression Cointegrated Model
The first thing Econometrica does is creates a co-integrated regression, as you see in the main chart, predicting ticker value ranges from fundamental economic data.
You can visualize this in the main chart above, but here are some other examples:
SPY vs Core Inflation:
BA vs PCE:
QQQ vs US Balance Sheet:
The band represents the anticipated range the ticker should theoretically fall in based on the underlying economic value. The indicator will breakdown the relationship between the economic indicator and the ticker more precisely. In the images above, you can see how there are some metrics provided, including Stationairty, lagged correlation, Integrated Correlation and R2. Let's discuss these very briefly:
Stationarity: checks to ensure that the relationship between the economic indicator and ticker is stationary. Stationary data is important for making unbiased inferences and projections, so having data that is stationary is valuable.
Lagged Correlation: This is a very interesting metric. Lagged correlation means whether there is a delay in the economic indicator and the response of the ticker. Typically, you will observed a lagged correlation between an economic indicator and price of a ticker, as it can take some time for economic changes to reach the market. This lagged correlation will provide you with how long it takes for the economic indicator to catch up with the ticker in months.
Integrated Correlation: This metric tells you how good of a fit the regression bands are in relation to the ticker price. A higher correlation, means the model is better at consistent and accurate information about the anticipated range for the ticker in relation to the economic indicator.
R2: Provides information on the variance and degree of model fit. A high R2 value means that the model is capable of explaining a large amount of variance between the economic indicator and the ticker price action.
Explaining the Relationship
Owning to the fact that the indicator is a bit on the mathy side (it has to be to do this kind of task), I have included ability for the indicator to explain and make suggestions based on the underlying data. It can assess the model's fit and make suggestions for tweaking. It can also explain the implications of the data being presented in the model.
Here is an example with QQQ and the US Balance Sheet:
This helps to simplify and interpret the results you are looking at.
Forecasting the Economic Indicator
In addition to assessing the economic indicator's impact on the ticker, the indicator is also capable of forecasting out the economic indicator over the next 25 releases.
Here is an example of the CPI forecast:
Overall use of the indicator
The indicator is meant to bridge the gap between Technical Analysis and Fundamental Analysis.
Any trader who is attune to fundamentals would benefit from this, as this provides you with objective data on how and to what extent fundamental and economic data impacts tickers.
It can help affirm hypothesis and dispel myths objectively.
It also omits the need from having to perform these types of analyses outside of Tradingview (i.e. in excel, R or Python), as you can get the data in just a few licks of enabling the indicator.
Conclusion
I have tried to make this indicator as user friendly as possible. Though it uses a lot of math, it is fairly straight forward to interpret.
The band plotted can be considered the fair market value or FMV of the ticker based on the underlying economic data, provided the indicator tells you that the relationship is significant (and it will blatantly give you this information verbatim, you don't have to interpret the math stuff).
This is US economic data only. It does not pull economic data from other countries. You can absolutely see how US economic data impacts other markets like the TSX, BANKNIFTY, NIFTY, DAX etc. but the indicator is only pulling US economic data.
That is it!
I hope you enjoy it and find this helpful!
Thanks everyone and safe trades as always 🚀🚀🚀
STRX - Correlation DominationThis indicator displays the correlation among three selected assets (for example, Gold, Dollar Index, and Nasdaq) on a custom timeframe. A table positioned at the top-right corner of the chart lets you quickly see the correlation between:
Asset 1 vs Asset 2
Asset 1 vs Asset 3
Asset 2 vs Asset 3
Correlations are calculated using the Pearson correlation function (ta.correlation). If the correlation is greater than or equal to 0.4, the value appears in green (strong positive correlation). If it is less than or equal to -0.4, it appears in red (strong negative correlation). Otherwise, it is displayed in yellow (weak correlation).
Multi-asset and multi-timeframe: Compare up to three instruments at once on your chosen timeframe.
Customizable period: Use the “Correlation Period” setting to adjust the correlation calculation window.
Clear table format: The results are immediately visible in an easy-to-read table.
Disclaimer: This script is provided solely for educational and informational purposes. It does not constitute a recommendation or an invitation to invest. Use it as an additional resource and always conduct thorough market analysis before opening any trading positions. Past performance does not guarantee future results.

ICT Professional Accumulation DistributionICT Professional Accumulation Distribution (ICT AD) provides a x-ray view into market accumulation and distribution. You can literally see the institutions at work.
The indicator consists of two cumulative lines derived from:
Cumulative change from open to close
Cumulative change from previous close to new open
By overlaying these two cumulative lines, you can detect real meaningful divergence that is narrative based not mathematically derived. You're seeing the real works of algorithms in play working in this area.
These divergences are only useful at extremes (topping or bottoming formations), not while trending. It will probably confirm your suspicion about making a important high or low.
This works on all timeframes but is most impactful on the daily.
How to use:
Method 1:
Enable the option for "Show Open vs Close."
Calculate the shift by subtracting the "Open vs Close" line value from the ICT Accumulation/Distribution (AD) line value.
Look for divergences between the two cumulative lines.
Method 2:
Switch the chart's display mode to "Line View" (representing the Open vs Close).
look for divergences between the line chart and the ICT AD line.

BTC x M2 Divergence (Weekly)### Why the "M2 Money Supply vs BTC Divergence with Normalized RSI" Indicator Should Work
IMPORTANT
- Weekly only indicator
- Combine it with BTC Halving Cycle Profit for better results
The "M2 Money Supply vs BTC Divergence with Normalized RSI" indicator leverages the relationship between macroeconomic factors (M2 money supply) and Bitcoin price movements, combined with technical analysis tools like RSI, to provide actionable trading signals. Here's a detailed rationale on why this indicator should be effective:
1. **Macroeconomic Influence**:
- **M2 Money Supply**: Represents the total money supply, including cash, checking deposits, and easily convertible near money. Changes in M2 reflect liquidity in the economy, which can influence asset prices, including Bitcoin.
- **Bitcoin Sensitivity to Liquidity**: Bitcoin, being a digital asset, often reacts to changes in liquidity conditions. An increase in money supply can lead to higher asset prices as more money chases fewer assets, while a decrease can signal tightening conditions and lower prices.
2. **Divergence Analysis**:
- **Economic Divergence**: The indicator calculates the divergence between the percentage changes in M2 and Bitcoin prices. This divergence can highlight discrepancies between Bitcoin's price movements and broader economic conditions.
- **Market Inefficiencies**: Large divergences may indicate inefficiencies or imbalances that could lead to price corrections or trends. For example, if M2 is increasing (indicating more liquidity) but Bitcoin is not rising proportionately, it might suggest a potential upward correction in Bitcoin's price.
3. **Normalization and Smoothing**:
- **Normalized Divergence**: Normalizing the divergence to a consistent scale (-100 to 100) allows for easier comparison and interpretation over time, making the signals more robust.
- **Smoothing with EMA**: Applying Exponential Moving Averages (EMAs) to the normalized divergence helps to reduce noise and identify the underlying trend more clearly. This double-smoothed divergence provides a clearer signal by filtering out short-term volatility.
4. **RSI Integration**:
- **RSI as a Momentum Indicator**: RSI measures the speed and change of price movements, indicating overbought or oversold conditions. Normalizing the RSI and incorporating it into the divergence analysis helps to confirm the strength of the signals.
- **Combining Divergence with RSI**: By using RSI in conjunction with divergence, the indicator gains an additional layer of confirmation. For instance, a bullish divergence combined with an oversold RSI can be a strong buy signal.
5. **Dynamic Zones and Sensitivity**:
- **Good DCA Zones**: Highlighting zones where the divergence is significantly positive (good DCA zones) indicates periods where Bitcoin might be undervalued relative to economic conditions, suggesting good buying opportunities.
- **Red Zones**: Marking zones with extremely negative divergence, combined with RSI confirmation, identifies potential market tops or bearish conditions. This helps traders avoid buying into overbought markets or consider selling.
- **Peak Detection**: The sensitivity setting for detecting upside down peaks allows for early identification of potential market bottoms, providing timely entry points for traders.
6. **Visual Cues and Alerts**:
- **Clear Visualization**: The plots and background colors provide immediate visual feedback, making it easier for traders to spot significant conditions without deep analysis.
- **Alerts**: Built-in alerts for key conditions (good DCA zones, red zones, sell signals) ensure traders can act promptly based on the indicator's signals, enhancing the practicality of the tool.
### Conclusion
The "M2 Money Supply vs BTC Divergence with Normalized RSI" indicator integrates macroeconomic data with technical analysis to offer a comprehensive view of Bitcoin's market conditions. By analyzing the divergence between M2 money supply and Bitcoin prices, normalizing and smoothing the data, and incorporating RSI for momentum confirmation, the indicator provides robust signals for identifying potential buying and selling opportunities. This holistic approach increases the likelihood of capturing significant market movements and making informed trading decisions.

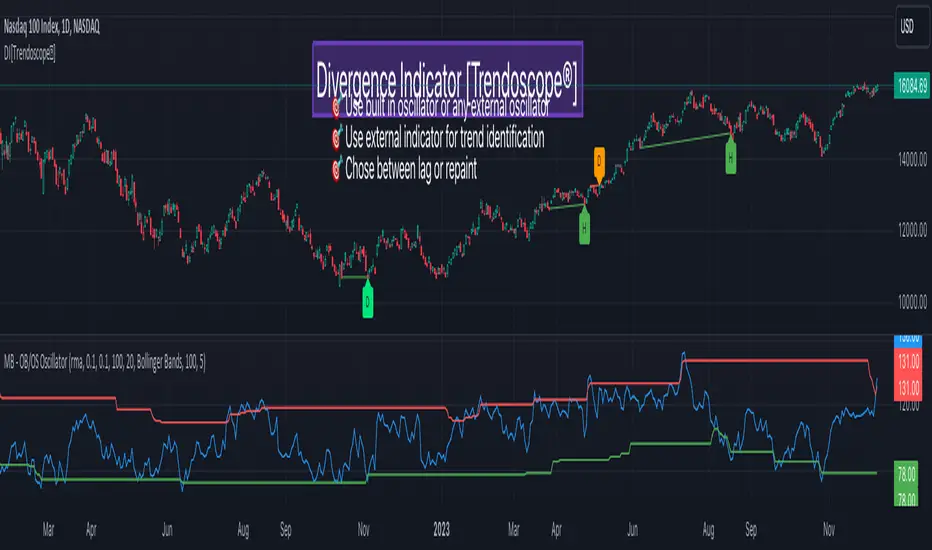
Divergence Indicator [Trendoscope®]🎲 New Divergence Indicator by Trendoscope
Our latest Divergence Indicator revolutionizes the way traders identify market trends and potential reversals. Built upon the robust foundation of the Zigzag Trend Divergence Detector and inline with our recent implementation of the Divergence Goggles indicator, this tool is designed to be intuitive yet powerful, making it an essential addition to any trader's toolkit.
We received several queries on extending the Divergence Goggles to last N bars instead of using an interactive widget. Though it is possible, we thought the better approach is to enable the indicator to use any oscillator and trend indicator in order to define the divergence.
🎯 Key Features
Flexible Oscillator Integration : Choose from a wide range of built-in oscillators or import your own, including options like the innovative Multiband Oscillator. This versatility extends to using volume indicators like OBV for divergence calculations, broadening the scope of analysis.
Trend Identification Versatility : Utilize built-in methods like Zigzag and MA Difference, or integrate external trend indicators. Our system adapts to various methods, ensuring you have the right tools for precise trend identification.
Customizable Zigzag Sensitivity : Adjust the Zigzag based on your chosen oscillator's sensitivity to ensure divergence lines are accurate and visually coherent.
Repainting vs. Delayed Signals : Tailor the indicator to your strategy by choosing between immediate repainting signals and slightly delayed but more stable signals.
🎯 Understanding Divergence: Key Rules
Bullish Divergence
Happens only in downtrend
Observed on Pivot Lows
Price makes lower low whereas oscillator makes higher low, indicating weakness and possible reversal
Bearish Divergence
Happens only in uptrend
Observed on Pivot Highs
Price makes higher high whereas oscillator makes lower high, indicating weakness and possible reversal
Bullish Hidden Divergence
Happens only in uptrend
Observed on Pivot Lows
Price makes higher low, whereas indicator makes lower low due to price consolidation. In bullish trend, this is considered as bullish as the price gets a breather and get ready to surge further.
Bearish Hidden Divergence
Happens only in downtrend
Observed on Pivot Highs
Price makes lower high whereas oscillator makes higher high due to price consolidation. In bearish trend, this is considered as bearish as the price gets a breather and get ready to fall further.
🎯 Visual Insights: Divergence and Hidden Divergence
For a clearer understanding, refer to our visual guides:
🎲 Using the Divergence Indicator: A Step-by-Step Guide
🎯 Step 1 - Selecting the Oscillator
Customize your analysis by choosing from a variety of oscillators or importing your preferred one. Options are available to select a range of built-in oscillators and the loopback length. However, if the oscillator that user want to use is not in the list, they can simply load the oscillator from the indicator library and use it as an external signal.
In our current example, we are using a custom oscillator called - Multiband Oscillator
This also means, the indicator option is not limited to oscillators. Users can even make use of volume indicators such as OBV for the calculation of divergence.
🎯 Step 2 - Choosing the Trend Identification Method
Select from our built-in methods or integrate an external indicator to accurately identify market trends. Trend is one of the key parameters of divergence type identification. Trend can be identified mathematically by various methods. Some of them are as simple as above or below 200 moving average and some can follow trend based indicators such as supertrend and others can be very complex.
To cater for a wider audience, here too we have provided the option to use an external trend indicator. The simple condition for the external trend indicator is that it should return positive value for uptrend and negative value for downtrend.
Other than that, we also have 2 built in trend identification methods.
Zigzag - The trend is defined by the starting pivot of divergence line. If the starting pivot is Higher High or Higher Low, then it is considered uptrend. And if the starting pivot is either Lower Low or Lower High, then we consider it as downtrend.
MA Difference - In this case, the difference between the moving average of pivots joining the divergence line will determine the trend. It is considered uptrend if the moving average increased from starting pivot to ending pivot of the divergence line, and it is considered downtrend if the moving average decreased from starting pivot to the ending pivot of the divergence line.
🎯 Step 3 - Adjusting Zigzag Sensitivity
Fine-tune the Zigzag to match the oscillator's sensitivity, ensuring divergence lines are accurate and visually coherent.
🎯 Step 4 - Managing Repainting
Understand the implications of repainting in the last pivot of the Zigzag and choose between immediate or delayed signals based on your trading strategy. The last pivot of the zigzag repaint by design. This is not necessarily a bad thing. Users can just choose not to use the last pivot, but instead use the last but one for all the calculations. But, this also means, the signals will be delayed.
Indicator provides option to use repainting signal vs delayed signal. If you select the repaint option, the signals are shown immediately as and when they occur. But, there is a possibility that these signals change when the new price candles change zigzag pivot.
If you chose not to select the repaint option, then the divergence signals may lag by a few bars.
RVol LabelThis Code is update version of Code Provided by @ssbukam, Here is Link to his original Code and review the Description
Below is Original Description
1. When chart resolution is Daily or Intraday (D, 4H, 1H, 5min, etc), Relative Volume shows value based on DAILY. RVol is measured on daily basis to compare past N number of days.
2. When resolution is changed to Weekly or Monthly, then Relative Volume shows corresponding value. i.e. Weekly shows weekly relative volume of this week compared to past 'N' weeks. Likewise for Monthly. You would see change in label name. Like, Weekly chart shows W_RVol (Weekly Relative Volume). Likewise, Daily & Intraday shows D_RVol. Monthly shows M_RVol (Monthly Relative Volume).
3. Added a plot (by default hidden) for this specific reason: When you move the cursor to focus specific candle, then Indicator Value displays relative volume of that specific candle. This applies to Intraday as well. So if you're in 1HR chart and move the cursor to a specific candle, Indicator Value shows relative volume for that specific candlestick bar.
4. Updating the script so that text size and location can be customized.
Changes to Updated Label by me
1. Added Today's Volume to the Label
2. Added Total Average Volume to the Label
3. Comparison vs Both in Single Line and showing how much volume has traded vs the average volume for that time of the day
4. Aesthetic Look of the Label
How to Use Relative Volume for Trading
Using Relative Volume (RVol) in trading can be a valuable tool to help you identify potential trading opportunities and gain insight into market behavior. Here are some ways to use RVol in your trading strategy:
Identifying High-Volume Breakouts: RVol can help you spot potential breakouts when the volume surges significantly above its average. High RVol during a breakout suggests strong market interest, increasing the probability of a sustained move in the direction of the breakout.
Confirming Trends and Reversals: RVol can act as a confirmation tool for trends and reversals. A trend accompanied by rising RVol indicates a strong and sustainable move. Conversely, a trend with declining RVol might suggest a weakening trend or potential reversal.
Spotting Volume Divergence: When the price is moving in one direction, but RVol is declining or not confirming the move, it may indicate a divergence. This discrepancy could suggest a potential reversal or trend change.
Support and Resistance Confirmation: High RVol near key support or resistance levels can indicate potential price reactions at those levels. This confirmation can be valuable in determining whether a level is likely to hold or break.
Filtering Trade Signals: Incorporate RVol into your existing trading strategy as a filter. For example, you might consider taking trades only if RVol is above a certain threshold, ensuring that you focus on high-impact trading opportunities.
Avoiding Low-Volume Traps: Low RVol can indicate a lack of interest or participation in the market. In such situations, price movements may be erratic and less reliable, so it's often wise to avoid trading during low RVol periods.
Monitoring News Events: Around significant news events or earnings releases, RVol can help you gauge the market's reaction to the information. High RVol during such events can present trading opportunities but be cautious of increased volatility and potential gaps.
Adjusting Trade Size: During periods of extremely high RVol, it might be prudent to adjust your position size to account for higher risk.
Using Relative Volume in Morning Session
If the Volume traded in first 15 minute to 30 Minutes is already at 50% or 100% depending upon the ticker, it means that it is going to have very high Volume vs average by end of the day.
This gives me conviction for Long or Short Trades
Remember that RVol is not a standalone indicator; it works best when used in conjunction with other technical and fundamental analysis tools. Additionally, RVol's effectiveness may vary across different markets and trading strategies. Therefore, backtesting and validating the use of RVol in your trading approach is essential.
Lastly, risk management is crucial in trading. While RVol can provide valuable insights, it cannot guarantee profitable trades. Always use appropriate risk management strategies, such as setting stop-loss levels, and avoid overexposing yourself to the market based solely on RVol readings.

Market Structure & Liquidity: CHoCHs+Nested Pivots+FVGs+Sweeps//Purpose:
This indicator combines several tools to help traders track and interpret price action/market structure; It can be divided into 4 parts;
1. CHoCHs, 2. Nested Pivot highs & lows, 3. Grade sweeps, 4. FVGs.
This gives the trader a toolkit for determining market structure and shifts in market structure to help determine a bull or bear bias, whether it be short-term, med-term or long-term.
This indicator also helps traders in determining liquidity targets: wether they be voids/gaps (FVGS) or old highs/lows+ typical sweep distances.
Finally, the incorporation of HTF CHoCH levels printing on your LTF chart helps keep the bigger picture in mind and tells traders at a glance if they're above of below Custom HTF CHoCH up or CHoCH down (these HTF CHoCHs can be anything from Hourly up to Monthly).
//Nomenclature:
CHoCH = Change of Character
STH/STL = short-term high or low
MTH/MTL = medium-term high or low
LTH/LTL = long-term high or low
FVG = Fair value gap
CE = consequent encroachement (the midline of a FVG)
~~~ The Four components of this indicator ~~~
1. CHoCHs:
•Best demonstrated in the below charts. This was a method taught to me by @Icecold_crypto. Once a 3 bar fractal pivot gets broken, we count backwards the consecutive higher lows or lower highs, then identify the CHoCH as the opposite end of the candle which ended the consecutive backwards count. This CHoCH (UP or DOWN) then becomes a level to watch, if price passes through it in earnest a trader would consider shifting their bias as market structure is deemed to have shifted.
•HTF CHoCHs: Option to print Higher time frame chochs (default on) of user input HTF. This prints only the last UP choch and only the last DOWN choch from the input HTF. Solid line by default so as to distinguish from local/chart-time CHoCHs. Can be any Higher timeframe you like.
•Show on table: toggle on show table(above/below) option to show in table cells (top right): is price above the latest HTF UP choch, or is price below HTF DOWN choch (or is it sat between the two, in a state of 'uncertainty').
•Most recent CHoCHs which have not been met by price will extend 10 bars into the future.
• USER INPUTS: overall setting: SHOW CHOCHS | Set bars lookback number to limit historical Chochs. Set Live CHoCHs number to control the number of active recent chochs unmet by price. Toggle shrink chochs once hit to declutter chart and minimize old chochs to their origin bars. Set Multi-timeframe color override : to make Color choices auto-set to your preference color for each of 1m, 5m, 15m, H, 4H, D, W, M (where up and down are same color, but 'up' icon for up chochs and down icon for down chochs remain printing as normal)
2. Nested Pivot Highs & Lows; aka 'Pivot Highs & Lows (ST/MT/LT)'
•Based on a seperate, longer lookback/lookforward pivot calculation. Identifies Pivot highs and lows with a 'spikeyness' filter (filtering out weak/rounded/unimpressive Pivot highs/lows)
•by 'nested' I mean that the pivot highs are graded based on whether a pivot high sits between two lower pivot highs or vice versa.
--for example: STH = normal pivot. MTH is pivot high with a lower STH on either side. LTH is a pivot high with a lower MTH on either side. Same applies to pivot lows (STL/MTL/LTL)
•This is a useful way to measure the significance of a high or low. Both in terms of how much it might be typically swept by (see later) and what it would imply for HTF bias were we to break through it in earnest (more than just a sweep).
• USER INPUTS: overall setting: show pivot highs & lows | Bars lookback (historical pivots to show) | Pivots: lookback/lookforward length (determines the scale of your pivot highs/lows) | toggle on/off Apply 'Spikeyness' filter (filters out smooth/unimpressive pivot highs/lows). Set Spikeyness index (determines the strength of this filter if turned on) | Individually toggle on each of STH, MTH, LTH, STL, MTL, LTL along with their label text type , and size . Toggle on/off line for each of these Pivot highs/lows. | Set label spacer (atr multiples above / below) | set line style and line width
3. Grade Sweeps:
•These are directly related to the nested pivots described above. Most assets will have a typical sweep distance. I've added some of my expected sweeps for various assets in the indicator tooltips.
--i.e. Eur/Usd 10-20-30 pips is a typical 'grade' sweep. S&P HKEX:5 - HKEX:10 is a typical grade sweep.
•Each of the ST/MT/LT pivot highs and lows have optional user defined grade sweep boxes which paint above until filled (or user option for historical filled boxes to remain).
•Numbers entered into sweep input boxes are auto converted into appropriate units (i.e. pips for FX, $ or 'handles' for indices, $ for Crypto. Very low $ units can be input for low unit value crypto altcoins.
• USER INPUTS: overall setting: Show sweep boxes | individually select colors of each of STH, MTH, LTH, STL, MTL, LTL sweep boxes. | Set Grade sweep ($/pips) number for each of ST, MT, LT. This auto converts between pips and $ (i.e. FX vs Indices/Crypto). Can be a float as small or large as you like ($0.000001 to HKEX:1000 ). | Set box text position (horizontal & vertical) and size , and color . | Set Box width (bars) (for non extended/ non-auto-terminating at price boxes). | toggle on/off Extend boxes/lines right . | Toggle on/off Shrink Grade sweeps on fill (they will disappear in realtime when filled/passed through)
4. FVGs:
•Fair Value gaps. Represent 'naked' candle bodies where the wicks to either side do not meet, forming a 'gap' of sorts which has a tendency to fill, or at least to fill to midline (CE).
•These are ICT concepts. 'UP' FVGS are known as BISIs (Buyside imbalance, sellside inefficiency); 'DOWN' FVGs are known as SIBIs (Sellside imbalance, buyside inefficiency).
• USER INPUTS: overall setting: show FVGs | Bars lookback (history). | Choose to display: 'UP' FVGs (BISI) and/or 'DOWN FVGs (SIBI) . Choose to display the midline: CE , the color and the line style . Choose threshold: use CE (as opposed to Full Fill) |toggle on/off Shrink FVG on fill (CE hit or Full fill) (declutter chart/see backtesting history)
////••Alerts (general notes & cautionary notes)::
•Alerts are optional for most of the levels printed by this indicator. Set them via the three dots on indicator status line.
•Due to dynamic repainting of levels, alerts should be used with caution. Best use these alerts either for Higher time frame levels, or when closely monitoring price.
--E.g. You may set an alert for down-fill of the latest FVG below; but price will keep marching up; form a newer/higher FVG, and the alert will trigger on THAT FVG being down-filled (not the original)
•Available Alerts:
-FVG(BISI) cross above threshold(CE or full-fill; user choice). Same with FVG(SIBI).
-HTF last CHoCH down, cross below | HTF last CHoCH up, cross above.
-last CHoCH down, cross below | last CHoCH up, cross above.
-LTH cross above, MTH cross above, STH cross above | LTL cross below, MTL cross below, STL cross below.
////••Formatting (general)::
•all table text color is set from the 'Pivot highs & Lows (ST, MT, LT)' section (for those of you who prefer black backgrounds).
•User choice of Line-style, line color, line width. Same with Boxes. Icon choice for chochs. Char or label text choices for ST/MT/LT pivot highs & lows.
////••User Inputs (general):
•Each of the 4 components of this indicator can be easily toggled on/off independently.
•Quite a lot of options and toggle boxes, as described in full above. Please take your time and read through all the tooltips (hover over '!' icon) to get an idea of formatting options.
•Several Lookback periods defined in bars to control how much history is shown for each of the 4 components of this indicator.
•'Shrink on fill' settings on FVGs and CHoCHs: Basically a way to declutter chart; toggle on/off depending on if you're backtesting or reading live price action.
•Table Display: applies to ST/MT/LT pivot highs and to HTF CHoCHs; Toggle table on or off (in part or in full)
////••Credits:
•Credit to ICT (Inner Circle Trader) for some of the concepts used in this indicator (FVGS & CEs; Grade sweeps).
•Credit to @Icecold_crypto for the specific and novel concept of identifying CHoCHs in a simple, objective and effective manner (as demonstrated in the 1st chart below).
CHoCH demo page 1: shifting tweak; arrow diagrams to demonstrate how CHoCHs are defined:
CHoCH demo page 2: Simplified view; short lookback history; few CHoCHs, demo of 'latest' choch being extended into the future by 10 bars:
USAGE: Bitcoin Hourly using HTF daily CHoCHs:
USAGE-2: Cotton Futures (CT1!) 2hr. Painting a rather bullish picture. Above HTF UP CHoCH, Local CHoCHs show bullish order flow, Nice targets above (MTH/LTH + grade sweeps):
Full Demo; 5min chart; CHoCHs, Short term pivot highs/lows, grade sweeps, FVGs:
Full Demo, Eur/Usd 15m: STH, MTH, LTH grade sweeps, CHoCHs, Usage for finding bias (part A):
Full Demo, Eur/Usd 15m: STH, MTH, LTH grade sweeps, CHoCHs, Usage for finding bias, 3hrs later (part B):
Realtime Vs Backtesting(A): btc/usd 15m; FVGs and CHoCHs: shrink on fill, once filled they repaint discreetly on their origin bar only. Realtime (Shrink on fill, declutter chart):
Realtime Vs Backtesting(B): btc/usd 15m; FVGs and CHoCHs: DON'T shrink on fill; they extend to the point where price crosses them, and fix/paint there. Backtesting (seeing historical behaviour):

Support Bands indicatorSupport Band to follow Trends.
We can see clear where price is Trading. Observe how moving averages are developing or aligning to change trend or continuation.
Green up trend vs Red Down Trend
Band 1
8EMA Green Line vs 10SMA Light blue Line
Band 2
21EMA Orange Line vs 30 SMA Brown Line
Also includes
1 SMA Gray line for closing when you're looking at weakly charts.
40 SMA darker Gray
50 SMA Blue
100 SMA White
150 SMA Pink
200 SMA Yellow
300 SMA Dark Red
I hope it helps you to see when price is trending up and a set correctly your stop.

CVD - Cumulative Volume Delta Candles█ OVERVIEW
This indicator displays cumulative volume delta in candle form. It uses intrabar information to obtain more precise volume delta information than methods using only the chart's timeframe.
█ CONCEPTS
Bar polarity
By bar polarity , we mean the direction of a bar, which is determined by looking at the bar's close vs its open .
Intrabars
Intrabars are chart bars at a lower timeframe than the chart's. Each 1H chart bar of a 24x7 market will, for example, usually contain 60 bars at the lower timeframe of 1min, provided there was market activity during each minute of the hour. Mining information from intrabars can be useful in that it offers traders visibility on the activity inside a chart bar.
Lower timeframes (LTFs)
A lower timeframe is a timeframe that is smaller than the chart's timeframe. This script uses a LTF to access intrabars. The lower the LTF, the more intrabars are analyzed, but the less chart bars can display CVD information because there is a limit to the total number of intrabars that can be analyzed.
Volume delta
The volume delta concept divides a bar's volume in "up" and "down" volumes. The delta is calculated by subtracting down volume from up volume. Many calculation techniques exist to isolate up and down volume within a bar. The simplest techniques use the polarity of interbar price changes to assign their volume to up or down slots, e.g., On Balance Volume or the Klinger Oscillator . Others such as Chaikin Money Flow use assumptions based on a bar's OHLC values. The most precise calculation method uses tick data and assigns the volume of each tick to the up or down slot depending on whether the transaction occurs at the bid or ask price. While this technique is ideal, it requires huge amounts of data on historical bars, which usually limits the historical depth of charts and the number of symbols for which tick data is available.
This indicator uses intrabar analysis to achieve a compromise between the simplest and most precise methods of calculating volume delta. In the context where historical tick data is not yet available on TradingView, intrabar analysis is the most precise technique to calculate volume delta on historical bars on our charts. Our Volume Profile indicators use it. Other volume delta indicators in our Community Scripts such as the Realtime 5D Profile use realtime chart updates to achieve more precise volume delta calculations, but that method cannot be used on historical bars, so those indicators only work in real time.
This is the logic we use to assign intrabar volume to up or down slots:
• If the intrabar's open and close values are different, their relative position is used.
• If the intrabar's open and close values are the same, the difference between the intrabar's close and the previous intrabar's close is used.
• As a last resort, when there is no movement during an intrabar and it closes at the same price as the previous intrabar, the last known polarity is used.
Once all intrabars making up a chart bar have been analyzed and the up or down property of each intrabar's volume determined, the up volumes are added and the down volumes subtracted. The resulting value is volume delta for that chart bar.
█ FEATURES
CVD Candles
Cumulative Volume Delta Candles present volume delta information as it evolves during a period of time.
This is how each candle's levels are calculated:
• open : Each candle's' open level is the cumulative volume delta for the current period at the start of the bar.
This value becomes zero on the first candle following a CVD reset.
The candles after the first one always open where the previous candle closed.
The candle's high, low and close levels are then calculated by adding or subtracting a volume value to the open.
• high : The highest volume delta value found in intrabars. If it is not higher than the volume delta for the bar, then that candle will have no upper wick.
• low : The lowest volume delta value found in intrabars. If it is not lower than the volume delta for the bar, then that candle will have no lower wick.
• close : The aggregated volume delta for all intrabars. If volume delta is positive for the chart bar, then the candle's close will be higher than its open, and vice versa.
The candles are plotted in one of two configurable colors, depending on the polarity of volume delta for the bar.
CVD resets
The "cumulative" part of the indicator's name stems from the fact that calculations accumulate during a period of time. This allows you to analyze the progression of volume delta across manageable chunks, which is often more useful than looking at volume delta cumulated from the beginning of a chart's history.
You can configure the reset period using the "CVD Resets" input, which offers the following selections:
• None : Calculations do not reset.
• On a fixed higher timeframe : Calculations reset on the higher timeframe you select in the "Fixed higher timeframe" field.
• At a fixed time that you specify.
• At the beginning of the regular session .
• On a stepped higher timeframe : Calculations reset on a higher timeframe automatically stepped using the chart's timeframe and following these rules:
Chart TF HTF
< 1min 1H
< 3H 1D
<= 12H 1W
< 1W 1M
>= 1W 1Y
The indicator's background shows where resets occur.
Intrabar precision
The precision of calculations increases with the number of intrabars analyzed for each chart bar. It is controlled through the script's "Intrabar precision" input, which offers the following selections:
• Least precise, covering many chart bars
• Less precise, covering some chart bars
• More precise, covering less chart bars
• Most precise, 1min intrabars
As there is a limit to the number of intrabars that can be analyzed by a script, a tradeoff occurs between the number of intrabars analyzed per chart bar and the chart bars for which calculations are possible.
Total volume candles
You can choose to display candles showing the total intrabar volume for the chart bar. This provides you with more context to evaluate a bar's volume delta by showing it relative to the sum of intrabar volume. Note that because of the reasons explained in the "NOTES" section further down, the total volume is the sum of all intrabar volume rather than the volume of the bar at the chart's timeframe.
Total volume candles can be configured with their own up and down colors. You can also control the opacity of their bodies to make them more or less prominent. This publication's chart shows the indicator with total volume candles. They are turned off by default, so you will need to choose to display them in the script's inputs for them to plot.
Divergences
Divergences occur when the polarity of volume delta does not match that of the chart bar. You can identify divergences by coloring the CVD candles differently for them, or by coloring the indicator's background.
Information box
An information box in the lower-left corner of the indicator displays the HTF used for resets, the LTF used for intrabars, and the average quantity of intrabars per chart bar. You can hide the box using the script's inputs.
█ INTERPRETATION
The first thing to look at when analyzing CVD candles is the side of the zero line they are on, as this tells you if CVD is generally bullish or bearish. Next, one should consider the relative position of successive candles, just as you would with a price chart. Are successive candles trending up, down, or stagnating? Keep in mind that whatever trend you identify must be considered in the context of where it appears with regards to the zero line; an uptrend in a negative CVD (below the zero line) may not be as powerful as one taking place in positive CVD values, but it may also predate a movement into positive CVD territory. The same goes with stagnation; a trader in a long position will find stagnation in positive CVD territory less worrisome than stagnation under the zero line.
After consideration of the bigger picture, one can drill down into the details. Exactly what you are looking for in markets will, of course, depend on your trading methodology, but you may find it useful to:
• Evaluate volume delta for the bar in relation to price movement for that bar.
• Evaluate the proportion that volume delta represents of total volume.
• Notice divergences and if the chart's candle shape confirms a hesitation point, as a Doji would.
• Evaluate if the progress of CVD candles correlates with that of chart bars.
• Analyze the wicks. As with price candles, long wicks tend to indicate weakness.
Always keep in mind that unless you have chosen not to reset it, your CVD resets for each period, whether it is fixed or automatically stepped. Consequently, any trend from the preceding period must re-establish itself in the next.
█ NOTES
Know your volume
Traders using volume information should understand the volume data they are using: where it originates and what transactions it includes, as this can vary with instruments, sectors, exchanges, timeframes, and between historical and realtime bars. The information used to build a chart's bars and display volume comes from data providers (exchanges, brokers, etc.) who often maintain distinct feeds for intraday and end-of-day (EOD) timeframes. How volume data is assembled for the two feeds depends on how instruments are traded in that sector and/or the volume reporting policy for each feed. Instruments from crypto and forex markets, for example, will often display similar volume on both feeds. Stocks will often display variations because block trades or other types of trades may not be included in their intraday volume data. Futures will also typically display variations.
Note that as intraday vs EOD variations exist for historical bars on some instruments, differences may also exist between the realtime feeds used on intraday vs 1D or greater timeframes for those same assets. Realtime reporting rules will often be different from historical feed reporting rules, so variations between realtime feeds will often be different from the variations between historical feeds for the same instrument. The Volume X-ray indicator can help you analyze differences between intraday and EOD volumes for the instruments you trade.
If every unit of volume is both bought by a buyer and sold by a seller, how can volume delta make sense?
Traders who do not understand the mechanics of matching engines (the exchange software that matches orders from buyers and sellers) sometimes argue that the concept of volume delta is flawed, as every unit of volume is both bought and sold. While they are rigorously correct in stating that every unit of volume is both bought and sold, they overlook the fact that information can be mined by analyzing variations in the price of successive ticks, or in our case, intrabars.
Our calculations model the situation where, in fully automated order handling, market orders are generally matched to limit orders sitting in the order book. Buy market orders are matched to quotes at the ask level and sell market orders are matched to quotes at the bid level. As explained earlier, we use the same logic when comparing intrabar prices. While using intrabar analysis does not produce results as precise as when individual transactions — or ticks — are analyzed, results are much more precise than those of methods using only chart prices.
Not only does the concept underlying volume delta make sense, it provides a window on an oft-overlooked variable which, with price and time, is the only basic information representing market activity. Furthermore, because the calculation of volume delta also uses price and time variations, one could conceivably surmise that it can provide a more complete model than ones using price and time only. Whether or not volume delta can be useful in your trading practice, as usual, is for you to decide, as each trader's methodology is different.
For Pine Script™ coders
As our latest Polarity Divergences publication, this script uses the recently released request.security_lower_tf() Pine Script™ function discussed in this blog post . It works differently from the usual request.security() in that it can only be used at LTFs, and it returns an array containing one value per intrabar. This makes it much easier for programmers to access intrabar information.
Look first. Then leap.

Numbers RenkoRenko with Volume and Time in the box was developed by David Weis (Authority on Wyckoff method) and his student.
I like this style (I don't know what it is officially called) because it brings out the potential of Wyckoff method and Renko, and looks beautiful.
I can't find this style Indicator anywhere, so I made something like it, then I named "Numbers Renko" (数字 練行足 in Japanese).
Caution : This indicator only works exactly in Renko Chart.
////////// Numbers Renko General Settings //////////
Volume Divisor : To make good looking Volume Number.
ex) You set 100. When Volume is 0.056, 0.05 x 100 = 5.6. 6 is plotted in the box (Decimal are round off).
Show Only Large Renko Volume : show only Renko Volume which is larger than Average Renko Volume (it is calculated by user selected moving average, option below).
Show Renko Time : "Only Large Renko Time" show only Renko Time which is larger than Average Renko Time (it is calculated by user selected moving average, option below).
EMA period for calculation : This is used to calculate Average Renko Time and Average Renko Volume (These are used to decide Numbers colors and Candles colors). Default is EMA, You can choice SMA.
////////// Numbers Renko Coloring //////////
The Numbers in the box are color coded by compared the current Renko Volume with the Average Renko Volume.
If the current Renko Volume is 2 times larger than the ARV, Color2 will be used. If the current Renko Volume is 1.5 times larger than the ARV, Color1.5 will be used. Color1 If the current Renko Volume is larger than the ARV . Color0.5 is larger than half Athe RV and Color0 is less than or equal to half the ARV. Color1, Color1.5 and Color2 are Large Value, so only these colored Numbers are showed when use "Show Only ~ " option.
Default is Renko Volume based Color coding, You can choice Renko Time based Color coding. Therefore you can use two type coloring at the same time. ex) The Numbers Colors are Renko Volume based. Candle body, border and wick Colors are Renko Time based.
////////// Weis Wave Volume //////////
Show Effort vs Result : Weis Wave Volume divided by Wave Length.
ex) If 100 Up WWV is accumulated between 30 Up Renko Box, 100 / 30 = 3.33... will be 3.3 (Second decimal will be rounded off).
No Result Ratio : If current "Effort vs Result" is "No Result Ratio" times larger than Average Effort vs Result, Square Mark will be show. AEvsR is calculated by 5SMA.
ex) You set 1.5. If Current EvsR is 20 and AEvsR is 10, 20 > 10 x 1.5 then Square Mark will be show.
If the left and right arrows are in the same direction, the right arrow is omitted.
Show Comparison Marks : Show left side arrow by compare current value to previous previous value and show right side small arrow by compare current value to previous value.
ex) Current Up WWV is 17 and Previous Up WWV (previous previous value) is 12, left side arrow is Up. Previous Dn WWV is 20, right side small arrow is Dn.
Large Volume Ratio : If current WWV is "Large Volume Ratio" times larger than Average WWV, Large WWV color is used.
Sample layout

DailyDeviationLibrary "DailyDeviation"
Helps in determining the relative deviation from the open of the day compared to the high or low values.
hlcDeltaArrays(daysPrior, maxDeviation, spec, res) Retuns a set of arrays representing the daily deviation of price for a given number of days.
Parameters:
daysPrior : Number of days back to get the close from.
maxDeviation : Maximum deviation before a value is considered an outlier. A value of 0 will not filter results.
spec : session.regular (default), session.extended or other time spec.
res : The resolution (default = '1440').
Returns: Where OH = Open vs High, OL = Open vs Low, and OC = Open vs Close
fromOpen(daysPrior, maxDeviation, comparison, spec, res) Retuns a value representing the deviation from the open (to the high or low) of the current day given number of days to measure from.
Parameters:
daysPrior : Number of days back to get the close from.
maxDeviation : Maximum deviation before a value is considered an outlier. A value of 0 will not filter results.
comparison : The value use in comparison to the current open for the day.
spec : session.regular (default), session.extended or other time spec.
res : The resolution (default = '1440').
Modified ATR Indicator [KL]Modified Average True Range (ATR) Indicator
This indicator displays the ATR with relative highs and relative lows statistically determined.
What is ATR:
To know what ATR is, we need to understand what a True Range (TR) is.
- TR at a given bar is the highest distance between points: a) High vs low, b) High vs Close, and c) Low vs Close.
- ATR is the moving average of TRs over a predefined lookback period; 14 is the most commonly used.
- ATR can be mathematically expressed as:
Why is ATR Important
ATR often used to measure volatility; high volatility is indicated by high ATR, vice versa for low. This is a versatile tool allowing traders to determine entry/exit points, as well as the size of stop losses and when to take profits relative to it.
This is an opinion: Through observations, I have noticed that ATR can also indirectly tell us the levels of relative volume. This intuitively makes sense because in order to increase length of TR, high amounts of capital inflow/outflow is required (graphically speaking, high volume is required in order to make lengths of candle sticks longer). The relationship between ATR and relative volume should hold unless the market is illiquid to the extreme that there is no relationship between volume and price.
That said, knowing the relative lows/highs of ATR is very useful. It can be interpreted as:
- Relative high = high volatility, usually during sell offs
- Relative low = decreasing volume, could indicate price consolidation
Instead of arbitrarily determining whether ATR is high/low, this indicator will determine relative highs and relative lows using a simple statistical model.
How relative high/low is determined by this model
This indicator applies two-tailed hypothesis testing to test whether ATR (ie. say lookback of 14) has greatly deviated from a larger sample size (ie. lookback of 50). Assuming ATR is normally distributed and variance is known, then test statistic (z) can be used to determine whether ATR14 is within the critical area under Null Hypothesis: ATR14 == ATR50. If z falls below/above the left/right critical values (ie. 1.645 for a 90% confidence interval), then this is shown by the indicator through using different colors to plot the ATR line.
Volume X-ray [LucF]█ OVERVIEW
This tool analyzes the relative size of volume reported on intraday vs EOD (end of day) data feeds on historical bars. If you use volume data to make trading decisions, it can help you improve your understanding of its nature and quality, which is especially important if you trade on intraday timeframes.
I often mention, when discussing volume analysis, how it's important for traders to understand the volume data they are using: where it originates, what it includes and does not include. By helping you spot sizeable differences between volume reported on intraday and EOD data feeds for any given instrument, "Volume X-ray" can point you to instruments where you might want to research the causes of the difference.
█ CONCEPTS
The information used to build a chart's historical bars originates from data providers (exchanges, brokers, etc.) who often maintain distinct historical feeds for intraday and EOD timeframes. How volume data is assembled for intraday and EOD feeds varies with instruments, brokers and exchanges. Variations between the two feeds — or their absence — can be due to how instruments are traded in a particular sector and/or the volume reporting policy for the feeds you are using. Instruments from crypto and forex markets, for example, will often display similar volume on both feeds. Stocks will often display variations because block trades or other types of trades may not be included in their intraday volume data. Futures will also typically display variations. It is even possible that volume from different feeds may not be of the same nature, as you can get trade volume (market volume) on one feed and tick volume (transaction counts) on another. You will sometimes be able to find the details of what different feeds contain from the technical information provided by exchanges/brokers on their feeds. This is an example for the NASDAQ feeds . Once you determine which feeds you are using, you can look for the reporting specs for that feed. This is all research you will need to do on your own; "Volume X-ray" will not help you with that part.
You may elect to forego the deep dive in feed information and simply rely on the figure the indicator will calculate for the instruments you trade. One simple — and unproven — way to interpret "Volume X-ray" values is to infer that instruments with larger percentages of intraday/EOD volume ratios are more "democratic" because at intraday timeframes, you are seeing a greater proportion of the actual traded volume for the instrument. This could conceivably lead one to conclude that such volume data is more reliable than on an instrument where intraday volume accounts for only 3% of EOD volume, let's say.
Note that as intraday vs EOD variations exist for historical bars on some instruments, there will typically also be differences between the realtime feeds used on intraday vs 1D or greater timeframes for those same assets. Realtime reporting rules will often be different from historical feed reporting rules, so variations between realtime feeds will often be different from the variations between historical feeds for the same instrument. A deep dive in reporting rules will quickly reveal what a jungle they are for some instruments, yet it is the only way to really understand the volume information our charts display.
█ HOW TO USE IT
The script is very simple and has no inputs. Just add it to 1D charts and it will calculate the proportion of volume reported on the intraday feed over the EOD volume. The plots show the daily values for both volumes: the teal area is the EOD volume, the orange line is the intraday volume. A value representing the average, cumulative intraday/EOD volume percentage for the chart is displayed in the upper-right corner. Its background color changes with the percentage, with brightness levels proportional to the percentage for both the bull color (% >= 50) or the bear color (% < 50). When abnormal conditions are detected, such as missing volume of one kind or the other, a yellow background is used.
Daily and cumulative values are displayed in indicator values and the Data Window.
The indicator loads in a pane, but you can also use it in overlay mode by moving it on the chart with "Move to" in the script's "More" menu, and disabling the plot display from the "Settings/Style" tab.
█ LIMITATIONS
• The script will not run on timeframes >1D because it cannot produce useful values on them.
• The calculation of the cumulative average will vary on different intraday timeframes because of the varying number of days covered by the dataset.
Variations can also occur because of irregularities in reported volume data. That is the reason I recommend using it on 1D charts.
• The script only calculates on historical bars because in real time there is no distinction between intraday and EOD feeds.
• You will see plenty of special cases if you use the indicator on a variety of instruments:
• Some instruments have no intraday volume, while on others it's the opposite.
• Missing information will sometimes appear here and there on datasets.
• Some instruments have higher intraday than EOD volume.
Please do not ask me the reasons for these anomalies; it's your responsibility to find them. I supply a tool that will spot the anomalies for you — nothing more.
█ FOR PINE CODERS
• This script uses a little-known feature of request.security() , which allows us to specify `"1440"` for the `timeframe` argument.
When you do, data from the 1min intrabars of the historical intraday feed is aggregated over one day, as opposed to the usual EOD feed used with `"D"`.
• I use gaps on my request.security() calls. This is useful because at intraday timeframes I can cumulate non- na values only.
• I use fixnan() on some values. For those who don't know about it yet, it eliminates na values from a series, just like not using gaps will do in a request.security() call.
• I like how the new switch structure makes for more readable code than equivalent if structures.
• I wrote my script using the revised recommendations in the Style Guide from the Pine v5 User Manual.
• I use the new runtime.error() to throw an error when the script user tries to use a timeframe >1D.
Why? Because then, my request.security() calls would be returning values from the last 1D intrabar of the dilation of the, let's say, 1W chart bar.
This of course would be of no use whatsoever — and misleading. I encourage all Pine coders fetching HTF data to protect their script users in the same way.
As tool builders, it is our responsibility to shield unsuspecting users of our scripts from contexts where our calcs produce invalid results.
• While we're on the subject of accessing intrabar timeframes, I will add this to the intention of coders falling victim to what appears to be
a new misconception where the mere fact of using intrabar timeframes with request.security() is believed to provide some sort of edge.
This is a fallacy unless you are sending down functions specifically designed to mine values from request.security() 's intrabar context.
These coders do not seem to realize that:
• They are only retrieving information from the last intrabar of the chart bar.
• The already flawed behavior of their scripts on historical bars will not improve on realtime bars. It will actually worsen because in real time,
intrabars are not yet ordered sequentially as they are on historical bars.
• Alerts or strategy orders using intrabar information acquired through request.security() will be using flawed logic and data most of the time.
The situation reminds me of the mania where using Heikin-Ashi charts to backtest was all the rage because it produced magnificent — and flawed — results.
Trading is difficult enough when doing the right things; I hate to see traders infected by lethal beliefs.
Strive to sharpen your "herd immunity", as Lionel Shriver calls it. She also writes: "Be leery of orthodoxy. Hold back from shared cultural enthusiasms."
Be your own trader.
█ THANKS
This indicator would not exist without the invaluable insights from Tim, a member of the Pine team. Thanks Tim!
Relative StrengthThis indicator is called Relative Strength and is no way related to RSI ( Relative strength indicator).
It is simply a ratio of asset A to asset B plotted. Usually it is used to look for strength vs a particular index. Since it is a ratio, all the trendlines work on it. The default index is NIFTY. You can change it any index/script you want to compare:
1. Script vs Index
2. Index vs Index

Market BuySell RatioA script using 1m small candle size (configurable) to compute the volume of buy (up) vs sell (down) candles (instead of actual market buy vs sell orders which are not available in pine script).
It then plots the buy vs sell ratio as an oscillator below the cart.
This gives traders an idea of current order flow in the market.
To compute the small candles this script uses the "Smart Volume" script which can be found here:

Accumulation And Distribution Zones (Zeiierman)█ Overview
Accumulation And Distribution Zones (Zeiierman) is a structural zone indicator that highlights where the market has recently been absorbing sell pressure (Accumulation) or releasing buy pressure (Distribution).
The indicator tracks a refined sequence of swing highs and lows and measures how these swings tighten, expand, or step directionally. When they form staircase-style structures such as higher lows with compressing highs for Accumulation or lower highs with compressing lows for Distribution, the script marks these areas as shifts in market control.
Once the full pattern completes, the indicator converts it into an Accumulation or Distribution zone. Each zone is based on a confirmed structural sequence rather than a single point, making it more reliable and reflective of actual market behavior.
The indicator can also display a mini-volume profile within each zone and extend POC levels forward, showing where trading activity clustered most. Combined, these features reveal areas where price has recently shown acceptance, absorption, or rejection, helping you understand whether current price action is reacting to, breaking from, or retesting these important structural regions.
█ How It Works
⚪ Swing Structure
The indicator builds its foundation by detecting swing highs and lows using a configurable Swing Detection Window. Each confirmed swing is stored with its price, time, bar index, and direction. If two consecutive swings share the same direction, only the more extreme one is kept. This produces a clean structural sequence that removes noise and keeps only meaningful turning points.
⚪ Accumulation vs Distribution Pattern Logic
Using the refined swing sequence, the script looks for staircase-style formations that signal shifts in control:
Accumulation (bottoming): higher lows combined with compressing highs.
Distribution (topping): lower highs combined with compressing lows.
Two detection modes are available:
Quick for compact 4-swing formations
Slow for broader 6-swing structures
When a full structural pattern completes, the indicator marks the zone and resets the swing buffer for the next formation.
⚪ Volume Profile Construction
The price range between the zone’s upper and lower boundary is divided into several Rows. For every bar within the zone’s swing range, the bar’s volume is added to the appropriate price row.
Volume is classified as:
Bullish volume when close > open
Bearish volume when close < open
Each row is drawn as two horizontal segments (bull and bear), colored with smooth gradients based on your bull/bear color settings. This creates a compact profile that reveals where trading activity is concentrated inside the zone and whether buyers or sellers dominate those price levels.
█ How to Use
The indicator is designed to provide context and confluence, not raw buy/sell signals.
⚪ Spot Fresh Accumulation & Distribution
Use newly printed zones as a map of where the market has recently:
Absorbed selling and formed a floor (Accumulation below price).
Absorbed buying and formed a cap (Distribution above price).
In a trending environment, fresh accumulation zones below price are often areas to watch for pullbacks, while distribution zones above price can act as sell zones or targets.
⚪ Volume Profile
Longer horizontal bars show where the market traded the most volume inside the zone.
Bull-leaning rows inside an accumulation zone often signal strong buying interest during the formation.
Bear-leaning rows inside a distribution zone highlight concentrated selling pressure.
By combining this volume distribution with the zone label and the broader trend context, you can judge whether the structure is more likely to hold, break, or retest as the price approaches it again.
⚪ POC (Point of Control) Trading
Extended POC zones (Regular or Faded) can be treated as dynamic support/resistance rails:
When price revisits a prior accumulation POC and rejects it from above, the level may act as support. When price retests a distribution POC from below and fails to break through, it can act as resistance.
⚪ Combine with Your Own Strategy
The script does not decide direction for you. You get the most value by combining it with:
Your own trend filters (moving averages, higher timeframe structure, volatility measures).
Your preferred entry models (reversal candles, momentum breaks, liquidity grabs, etc.).
Higher-timeframe mapping.
Think of this tool as a map of where the market did meaningful business. You decide how to trade around those areas.
█ Settings
Acc/Dist Ranges – Master switch for drawing all Accumulation and Distribution zones. Turn this off to temporarily hide boxes while leaving supporting logic active.
Pattern – Shows or hides the swing-based pattern outline that formed each zone. Good for structural debugging and education.
Pattern Sensitivity
Quick – more responsive, detects smaller compact structures.
Slow – stricter, focuses on wider and more established zones.
Swing Detection Window – Pivot width used to confirm swing highs and lows. Larger values filter noise and produce bigger zones; smaller values pick up more minor structures.
Volume Profile – Enables the embedded volume profile inside each zone.
Rows – Number of price slices used to aggregate volume in the zone. Higher values give more detail but increase visual density.
Switch Order – Flips the horizontal order of bull vs bear volume segments within each row.
Extend Zones – Behaviour of POC and zone extension:
None – No forward extension.
Faded Zones – Store and draw up to four past POC zones as faded horizontal levels.
Regular Zones – Extend POC boxes forward until price breaks out.
-----------------
Disclaimer
The content provided in my scripts, indicators, ideas, algorithms, and systems is for educational and informational purposes only. It does not constitute financial advice, investment recommendations, or a solicitation to buy or sell any financial instruments. I will not accept liability for any loss or damage, including without limitation any loss of profit, which may arise directly or indirectly from the use of or reliance on such information.
All investments involve risk, and the past performance of a security, industry, sector, market, financial product, trading strategy, backtest, or individual's trading does not guarantee future results or returns. Investors are fully responsible for any investment decisions they make. Such decisions should be based solely on an evaluation of their financial circumstances, investment objectives, risk tolerance, and liquidity needs.

Luxy Super-Duper SuperTrend Predictor Engine and Buy/Sell signalA professional trend-following grading system that analyzes historical trend
patterns to provide statistical duration estimates using advanced similarity
matching and k-nearest neighbors analysis. Combines adaptive Supertrend with
intelligent duration statistics, multi-timeframe confluence, volume confirmation,
and quality scoring to identify high-probability setups with data-driven
target ranges across all timeframes.
Note: All duration estimates are statistical calculations based on historical data, not guarantees of future performance.
WHAT MAKES THIS DIFFERENT
Unlike traditional SuperTrend indicators that only tell you trend direction, this system answers the critical question: "What is the typical duration for trends like this?"
The Statistical Analysis Engine:
• Analyzes your chart's last 15+ completed SuperTrend trends (bullish and bearish separately)
• Uses k-nearest neighbors similarity matching to find historically similar setups
• Calculates statistical duration estimates based on current market conditions
• Learns from estimation errors and adapts over time (Advanced mode)
• Displays visual duration analysis box showing median, average, and range estimates
• Tracks Statistical accuracy with backtest statistics
Complete Trading System:
• Statistical trend duration analysis with three intelligence levels
• Adaptive Supertrend with dynamic ATR-based bands
• Multi-timeframe confluence analysis (6 timeframes: 5M to 1W)
• Volume confirmation with spike detection and momentum tracking
• Quality scoring system (0-70 points) rating each setup
• One-click preset optimization for all trading styles
• Anti-repaint guarantee on all signals and duration estimates
METHODOLOGY CREDITS
This indicator's approach is inspired by proven trading methodologies from respected market educators:
• Mark Minervini - Volatility Contraction Pattern (VCP) and pullback entry techniques
• William O'Neil - Volume confirmation principles and institutional buying patterns (CANSLIM methodology)
• Dan Zanger - Volatility expansion entries and momentum breakout strategies
Important: These are educational references only. This indicator does not guarantee any specific trading results. Always conduct your own analysis and risk management.
KEY FEATURES
1. TREND DURATION ANALYSIS SYSTEM - The Core Innovation
The statistical analysis engine is what sets this indicator apart from standard SuperTrend systems. It doesn't just identify trend changes - it provides statistical analysis of potential duration.
How It Works:
Step 1: Historical Tracking
• Automatically records every completed SuperTrend trend (duration in bars)
• Maintains separate databases for bullish trends and bearish trends
• Stores up to 15 most recent trends of each type
• Captures market conditions at each trend flip: volume ratio, ATR ratio, quality score, price distance from SuperTrend, proximity to support/resistance
Step 2: Similarity Matching (k-Nearest Neighbors)
• When new trend begins, system compares current conditions to ALL historical flips
• Calculates similarity score based on:
- Volume similarity (30% weight) - Is volume behaving similarly?
- Volatility similarity (30% weight) - Is ATR/volatility similar?
- Quality similarity (20% weight) - Is setup strength comparable?
- Distance similarity (10% weight) - Is price distance from ST similar?
- Support/Resistance proximity (10% weight) - Similar structural context?
• Selects the 15 MOST SIMILAR historical trends (not just all trends)
• This is like asking: "When conditions looked like this before, how long did trends last?"
Step 3: Statistical Analysis
• Calculates median duration (most common outcome)
• Calculates average duration (mean of similar trends)
• Determines realistic range (min to max of similar trends)
• Applies exponential weighting (recent trends weighted more heavily)
• Outputs confidence-weighted statistical estimate
Step 4: Advanced Intelligence (Advanced Mode Only)
The Advanced mode applies five sophisticated multipliers to refine estimates:
A) Market Structure Multiplier (±30%):
• Detects nearby support/resistance levels using pivot detection
• If flip occurs NEAR a key level: Estimate adjusted -30% (expect bounce/rejection)
• If flip occurs in open space: Estimate adjusted +30% (clear path for continuation)
• Uses configurable lookback period and ATR-based proximity threshold
B) Asset Type Multiplier (±40%):
• Adjusts duration estimates based on asset volatility characteristics
• Small Cap / Biotech: +40% (explosive, extended moves)
• Tech Growth: +20% (momentum-driven, longer trends)
• Blue Chip / Large Cap: 0% (baseline, steady trends)
• Dividend / Value: -20% (slower, grinding trends)
• Cyclical: Variable based on macro regime
• Crypto / High Volatility: +30% (parabolic potential)
C) Flip Strength Multiplier (±20%):
• Analyzes the QUALITY of the trend flip itself
• Strong flip (high volume + expanding ATR + quality score 60+): +20%
• Weak flip (low volume + contracting ATR + quality score under 40): -20%
• Logic: Historical data shows that powerful flips tend to be followed by longer trends
D) Error Learning Multiplier (±15%):
• Tracks Statistical accuracy over last 10 completed trends
• Calculates error ratio: (estimated duration / Actual Duration)
• If system consistently over-estimates: Apply -15% correction
• If system consistently under-estimates: Apply +15% correction
• Learns and adapts to current market regime
E) Regime Detection Multiplier (±20%):
• Analyzes last 3 trends of SAME TYPE (bull-to-bull or bear-to-bear)
• Compares recent trend durations to historical average
• If recent trends 20%+ longer than average: +20% adjustment (trending regime detected)
• If recent trends 20%+ shorter than average: -20% adjustment (choppy regime detected)
• Detects whether market is in trending or mean-reversion mode
Three analysis modes:
SIMPLE MODE - Basic Statistics
• Uses raw median of similar trends only
• No multipliers, no adjustments
• Best for: Beginners, clean trending markets
• Fastest calculations, minimal complexity
STANDARD MODE - Full Statistical Analysis
• Similarity matching with k-nearest neighbors
• Exponential weighting of recent trends
• Median, average, and range calculations
• Best for: Most traders, general market conditions
• Balance of accuracy and simplicity
ADVANCED MODE - Statistics + Intelligence
• Everything in Standard mode PLUS
• All 5 advanced multipliers (structure, asset type, flip strength, learning, regime)
• Highest Statistical accuracy in testing
• Best for: Experienced traders, volatile/complex markets
• Maximum intelligence, most adaptive
Visual Duration Analysis Box:
When a new trend begins (SuperTrend flip), a box appears on your chart showing:
• Analysis Mode (Simple / Standard / Advanced)
• Number of historical trends analyzed
• Median expected duration (most likely outcome)
• Average expected duration (mean of similar trends)
• Range (minimum to maximum from similar trends)
• Advanced multipliers breakdown (Advanced mode only)
• Backtest accuracy statistics (if available)
The box extends from the flip bar to the estimated endpoint based on historical data, giving you a visual target for trend duration. Box updates in real-time as trend progresses.
Backtest & Accuracy Tracking:
• System backtests its own duration estimates using historical data
• Shows accuracy metrics: how well duration estimates matched actual durations
• Tracks last 10 completed duration estimates separately
• Displays statistics in dashboard and duration analysis boxes
• Helps you understand statistical reliability on your specific symbol/timeframe
Anti-Repaint Guarantee:
• duration analysis boxes only appear AFTER bar close (barstate.isconfirmed)
• Historical duration estimates never disappear or change
• What you see in history is exactly what you would have seen real-time
• No future data leakage, no lookahead bias
2. INTELLIGENT PRESET CONFIGURATIONS - One-Click Optimization
Unlike indicators that require tedious parameter tweaking, this system includes professionally optimized presets for every trading style. Select your approach from the dropdown and ALL parameters auto-configure.
"AUTO (DETECT FROM TF)" - RECOMMENDED
The smartest option: automatically selects optimal settings based on your chart timeframe.
• 1m-5m charts → Scalping preset (ATR: 7, Mult: 2.0)
• 15m-1h charts → Day Trading preset (ATR: 10, Mult: 2.5)
• 2h-4h-D charts → Swing Trading preset (ATR: 14, Mult: 3.0)
• W-M charts → Position Trading preset (ATR: 21, Mult: 4.0)
Benefits:
• Zero configuration - works immediately
• Always matched to your timeframe
• Switch timeframe = automatic adjustment
• Perfect for traders who use multiple timeframes
"SCALPING (1-5M)" - Ultra-Fast Signals
Optimized for: 1-5 minute charts, high-frequency trading, quick profits
Target holding period: Minutes to 1-2 hours maximum
Best markets: High-volume stocks, major crypto pairs, active futures
Parameter Configuration:
• Supertrend: ATR 7, Multiplier 2.0 (very sensitive)
• Volume: MA 10, High 1.8x, Spike 3.0x (catches quick surges)
• Volume Momentum: AUTO-DISABLED (too restrictive for fast scalping)
• Quality minimum: 40 points (accepts more setups)
• Duration Analysis: Uses last 15 trends with heavy recent weighting
Trading Logic:
Speed over precision. Short ATR period and low multiplier create highly responsive SuperTrend. Volume momentum filter disabled to avoid missing fast moves. Quality threshold relaxed to catch more opportunities in rapid market conditions.
Signals per session: 5-15 typically
Hold time: Minutes to couple hours
Best for: Active traders with fast execution
"DAY TRADING (15M-1H)" - Balanced Approach
Optimized for: 15-minute to 1-hour charts, intraday moves, session-based trading
Target holding period: 30 minutes to 8 hours (within trading day)
Best markets: Large-cap stocks, major indices, established crypto
Parameter Configuration:
• Supertrend: ATR 10, Multiplier 2.5 (balanced)
• Volume: MA 20, High 1.5x, Spike 2.5x (standard detection)
• Volume Momentum: 5/20 periods (confirms intraday strength)
• Quality minimum: 50 points (good setups preferred)
• Duration Analysis: Balanced weighting of recent vs historical
Trading Logic:
The most balanced configuration. ATR 10 with multiplier 2.5 provides steady trend following that avoids noise while catching meaningful moves. Volume momentum confirms institutional participation without being overly restrictive.
Signals per session: 2-5 typically
Hold time: 30 minutes to full day
Best for: Part-time and full-time active traders
"SWING TRADING (4H-D)" - Trend Stability
Optimized for: 4-hour to Daily charts, multi-day holds, trend continuation
Target holding period: 2-15 days typically
Best markets: Growth stocks, sector ETFs, trending crypto, commodity futures
Parameter Configuration:
• Supertrend: ATR 14, Multiplier 3.0 (stable)
• Volume: MA 30, High 1.3x, Spike 2.2x (accumulation focus)
• Volume Momentum: 10/30 periods (trend stability)
• Quality minimum: 60 points (high-quality setups only)
• Duration Analysis: Favors consistent historical patterns
Trading Logic:
Designed for substantial trend moves while filtering short-term noise. Higher ATR period and multiplier create stable SuperTrend that won't flip on minor corrections. Stricter quality requirements ensure only strongest setups generate signals.
Signals per week: 2-5 typically
Hold time: Days to couple weeks
Best for: Part-time traders, swing style
"POSITION TRADING (D-W)" - Long-Term Trends
Optimized for: Daily to Weekly charts, major trend changes, portfolio allocation
Target holding period: Weeks to months
Best markets: Blue-chip stocks, major indices, established cryptocurrencies
Parameter Configuration:
• Supertrend: ATR 21, Multiplier 4.0 (very stable)
• Volume: MA 50, High 1.2x, Spike 2.0x (long-term accumulation)
• Volume Momentum: 20/50 periods (major trend confirmation)
• Quality minimum: 70 points (excellent setups only)
• Duration Analysis: Heavy emphasis on multi-year historical data
Trading Logic:
Conservative approach focusing on major trend changes. Extended ATR period and high multiplier create SuperTrend that only flips on significant reversals. Very strict quality filters ensure signals represent genuine long-term opportunities.
Signals per month: 1-2 typically
Hold time: Weeks to months
Best for: Long-term investors, set-and-forget approach
"CUSTOM" - Advanced Configuration
Purpose: Complete manual control for experienced traders
Use when: You understand the parameters and want specific optimization
Best for: Testing new approaches, unusual market conditions, specific instruments
Full control over:
• All SuperTrend parameters
• Volume thresholds and momentum periods
• Quality scoring weights
• analysis mode and multipliers
• Advanced features tuning
Preset Comparison Quick Reference:
Chart Timeframe: Scalping (1M-5M) | Day Trading (15M-1H) | Swing (4H-D) | Position (D-W)
Signals Frequency: Very High | High | Medium | Low
Hold Duration: Minutes | Hours | Days | Weeks-Months
Quality Threshold: 40 pts | 50 pts | 60 pts | 70 pts
ATR Sensitivity: Highest | Medium | Lower | Lowest
Time Investment: Highest | High | Medium | Lowest
Experience Level: Expert | Advanced | Intermediate | Beginner+
3. QUALITY SCORING SYSTEM (0-70 Points)
Every signal is rated in real-time across three dimensions:
Volume Confirmation (0-30 points):
• Volume Spike (2.5x+ average): 30 points
• High Volume (1.5x+ average): 20 points
• Above Average (1.0x+ average): 10 points
• Below Average: 0 points
Volatility Assessment (0-30 points):
• Expanding ATR (1.2x+ average): 30 points
• Rising ATR (1.0-1.2x average): 15 points
• Contracting/Stable ATR: 0 points
Volume Momentum (0-10 points):
• Strong Momentum (1.2x+ ratio): 10 points
• Rising Momentum (1.0-1.2x ratio): 5 points
• Weak/Neutral Momentum: 0 points
Score Interpretation:
60-70 points - EXCELLENT:
• All factors aligned
• High conviction setup
• Maximum position size (within risk limits)
• Primary trading opportunities
45-59 points - STRONG:
• Multiple confirmations present
• Above-average setup quality
• Standard position size
• Good trading opportunities
30-44 points - GOOD:
• Basic confirmations met
• Acceptable setup quality
• Reduced position size
• Wait for additional confirmation or trade smaller
Below 30 points - WEAK:
• Minimal confirmations
• Low probability setup
• Consider passing
• Only for aggressive traders in strong trends
Only signals meeting your minimum quality threshold (configurable per preset) generate alerts and labels.
4. MULTI-TIMEFRAME CONFLUENCE ANALYSIS
The system can simultaneously analyze trend alignment across 6 timeframes (optional feature):
Timeframes analyzed:
• 5-minute (scalping context)
• 15-minute (intraday momentum)
• 1-hour (day trading bias)
• 4-hour (swing context)
• Daily (primary trend)
• Weekly (macro trend)
Confluence Interpretation:
• 5-6/6 aligned - Very strong multi-timeframe agreement (highest confidence)
• 3-4/6 aligned - Moderate agreement (standard setup)
• 1-2/6 aligned - Weak agreement (caution advised)
Dashboard shows real-time alignment count with color-coding. Higher confluence typically correlates with longer, stronger trends.
5. VOLUME MOMENTUM FILTER - Institutional Money Flow
Unlike traditional volume indicators that just measure size, Volume Momentum tracks the RATE OF CHANGE in volume:
How it works:
• Compares short-term volume average (fast period) to long-term average (slow period)
• Ratio above 1.0 = Volume accelerating (money flowing IN)
• Ratio above 1.2 = Strong acceleration (institutional participation likely)
• Ratio below 0.8 = Volume decelerating (money flowing OUT)
Why it matters:
• Confirms trend with actual money flow, not just price
• Leading indicator (volume often leads price)
• Catches accumulation/distribution before breakouts
• More intuitive than complex mathematical filters
Integration with signals:
• Optional filter - can be enabled/disabled per preset
• When enabled: Only signals with rising volume momentum fire
• AUTO-DISABLED in Scalping mode (too restrictive for fast trading)
• Configurable fast/slow periods per trading style
6. ADAPTIVE SUPERTREND MULTIPLIER
Traditional SuperTrend uses fixed ATR multiplier. This system dynamically adjusts the multiplier (0.8x to 1.2x base) based on:
• Trend Strength: Price correlation over lookback period
• Volume Weight: Current volume relative to average
Benefits:
• Tighter bands in calm markets (less premature exits)
• Wider bands in volatile conditions (avoids whipsaws)
• Better adaptation to biotech, small-cap, and crypto volatility
• Optional - can be disabled for classic constant multiplier
7. VISUAL GRADIENT RIBBON
26-layer exponential gradient fill between price and SuperTrend line provides instant visual trend strength assessment:
Color System:
• Green shades - Bullish trend + volume confirmation (strongest)
• Blue shades - Bullish trend, normal volume
• Orange shades - Bearish trend + volume confirmation
• Red shades - Bearish trend (weakest)
Opacity varies based on:
• Distance from SuperTrend (farther = more opaque)
• Volume intensity (higher volume = stronger color)
The ribbon provides at-a-glance trend strength without cluttering your chart. Can be toggled on/off.
8. INTELLIGENT ALERT SYSTEM
Two-tier alert architecture for flexibility:
Automatic Alerts:
• Fire automatically on BUY and SELL signals
• Include full context: quality score, volume state, volume momentum
• One alert per bar close (alert.freq_once_per_bar_close)
• Message format: "BUY: Supertrend bullish + Quality: 65/70 | Volume: HIGH | Vol Momentum: STRONG (1.35x)"
Customizable Alert Conditions:
• Appear in TradingView's "Create Alert" dialog
• Three options: BUY Signal Only, SELL Signal Only, ANY Signal (BUY or SELL)
• Use TradingView placeholders: {{ticker}}, {{interval}}, {{close}}, {{time}}
• Fully customizable message templates
All alerts use barstate.isconfirmed - Zero repaint guarantee.
9. ANTI-REPAINT ARCHITECTURE
Every component guaranteed non-repainting:
• Entry signals: Only appear after bar close
• duration analysis boxes: Created only on confirmed SuperTrend flips
• Informative labels: Wait for bar confirmation
• Alerts: Fire once per closed bar
• Multi-timeframe data: Uses lookahead=barmerge.lookahead_off
What you see in history is exactly what you would have seen in real-time. No disappearing signals, no changed duration estimates.
HOW TO USE THE INDICATOR
QUICK START - 3 Steps to Trading:
Step 1: Select Your Trading Style
Open indicator settings → "Quick Setup" section → Trading Style Preset dropdown
Options:
• Auto (Detect from TF) - RECOMMENDED: Automatically configures based on your chart timeframe
• Scalping (1-5m) - For 1-5 minute charts, ultra-fast signals
• Day Trading (15m-1h) - For 15m-1h charts, balanced approach
• Swing Trading (4h-D) - For 4h-Daily charts, trend stability
• Position Trading (D-W) - For Daily-Weekly charts, long-term trends
• Custom - Manual configuration (advanced users only)
Choose "Auto" and you're done - all parameters optimize automatically.
Step 2: Understand the Signals
BUY Signal (Green Triangle Below Price):
• SuperTrend flipped bullish
• Quality score meets minimum threshold (varies by preset)
• Volume confirmation present (if filter enabled)
• Volume momentum rising (if filter enabled)
• duration analysis box shows expected trend duration
SELL Signal (Red Triangle Above Price):
• SuperTrend flipped bearish
• Quality score meets minimum threshold
• Volume confirmation present (if filter enabled)
• Volume momentum rising (if filter enabled)
• duration analysis box shows expected trend duration
Duration Analysis Box:
• Appears at SuperTrend flip (start of new trend)
• Shows median, average, and range duration estimates
• Extends to estimated endpoint based on historical data visually
• Updates mode-specific intelligence (Simple/Standard/Advanced)
Step 3: Use the Dashboard for Context
Dashboard (top-right corner) shows real-time metrics:
• Row 1 - Quality Score: Current setup rating (0-70)
• Row 2 - SuperTrend: Direction and current level
• Row 3 - Volume: Status (Spike/High/Normal/Low) with color
• Row 4 - Volatility: State (Expanding/Rising/Stable/Contracting)
• Row 5 - Volume Momentum: Ratio and trend
• Row 6 - Duration Statistics: Accuracy metrics and track record
Every cell has detailed tooltip - hover for full explanations.
SIGNAL INTERPRETATION BY QUALITY SCORE:
Excellent Setup (60-70 points):
• Quality Score: 60-70
• Volume: Spike or High
• Volatility: Expanding
• Volume Momentum: Strong (1.2x+)
• MTF Confluence (if enabled): 5-6/6
• Action: Primary trade - maximum position size (within risk limits)
• Statistical reliability: Highest - duration estimates most accurate
Strong Setup (45-59 points):
• Quality Score: 45-59
• Volume: High or Above Average
• Volatility: Rising
• Volume Momentum: Rising (1.0-1.2x)
• MTF Confluence (if enabled): 3-4/6
• Action: Standard trade - normal position size
• Statistical reliability: Good - duration estimates reliable
Good Setup (30-44 points):
• Quality Score: 30-44
• Volume: Above Average
• Volatility: Stable or Rising
• Volume Momentum: Neutral to Rising
• MTF Confluence (if enabled): 3-4/6
• Action: Cautious trade - reduced position size, wait for additional confirmation
• Statistical reliability: Moderate - duration estimates less certain
Weak Setup (Below 30 points):
• Quality Score: Below 30
• Volume: Low or Normal
• Volatility: Contracting or Stable
• Volume Momentum: Weak
• MTF Confluence (if enabled): 1-2/6
• Action: Pass or wait for improvement
• Statistical reliability: Low - duration estimates unreliable
USING duration analysis boxES FOR TRADE MANAGEMENT:
Entry Timing:
• Enter on SuperTrend flip (signal bar close)
• duration analysis box appears simultaneously
• Note the median duration - this is your expected hold time
Profit Targets:
• Conservative: Use MEDIAN duration as profit target (50% probability)
• Moderate: Use AVERAGE duration (mean of similar trends)
• Aggressive: Aim for MAX duration from range (best historical outcome)
Position Management:
• Scale out at median duration (take partial profits)
• Trail stop as trend extends beyond median
• Full exit at average duration or SuperTrend flip (whichever comes first)
• Re-evaluate if trend exceeds estimated range
analysis mode Selection:
• Simple: Clean trending markets, beginners, minimal complexity
• Standard: Most markets, most traders (recommended default)
• Advanced: Volatile markets, complex instruments, experienced traders seeking highest accuracy
Asset Type Configuration (Advanced Mode):
If using Advanced analysis mode, configure Asset Type for optimal accuracy:
• Small Cap: Stocks under $2B market cap, low liquidity
• Biotech / Speculative: Clinical-stage pharma, penny stocks, high-risk
• Blue Chip / Large Cap: S&P 500, mega-cap tech, stable large companies
• Tech Growth: High-growth tech (TSLA, NVDA, growth SaaS)
• Dividend / Value: Dividend aristocrats, value stocks, utilities
• Cyclical: Energy, materials, industrials (macro-driven)
• Crypto / High Volatility: Bitcoin, altcoins, highly volatile assets
Correct asset type selection improves Statistical accuracy by 15-20%.
RISK MANAGEMENT GUIDELINES:
1. Stop Loss Placement:
Long positions:
• Place stop below recent swing low OR
• Place stop below SuperTrend level (whichever is tighter)
• Use 1-2 ATR distance as guideline
• Recommended: SuperTrend level (built-in volatility adjustment)
Short positions:
• Place stop above recent swing high OR
• Place stop above SuperTrend level (whichever is tighter)
• Use 1-2 ATR distance as guideline
• Recommended: SuperTrend level
2. Position Sizing by Quality Score:
• Excellent (60-70): Maximum position size (2% risk per trade)
• Strong (45-59): Standard position size (1.5% risk per trade)
• Good (30-44): Reduced position size (1% risk per trade)
• Weak (Below 30): Pass or micro position (0.5% risk - learning trades only)
3. Exit Strategy Options:
Option A - Statistical Duration-Based Exit:
• Exit at median estimated duration (conservative)
• Exit at average estimated duration (moderate)
• Trail stop beyond average duration (aggressive)
Option B - Signal-Based Exit:
• Exit on opposite signal (SELL after BUY, or vice versa)
• Exit on SuperTrend flip (trend reversal)
• Exit if quality score drops below 30 mid-trend
Option C - Hybrid (Recommended):
• Take 50% profit at median estimated duration
• Trail stop on remaining 50% using SuperTrend as trailing level
• Full exit on SuperTrend flip or quality collapse
4. Trade Filtering:
For higher win-rate (fewer trades, better quality):
• Increase minimum quality score (try 60 for swing, 50 for day trading)
• Enable volume momentum filter (ensure institutional participation)
• Require higher MTF confluence (5-6/6 alignment)
• Use Advanced analysis mode with appropriate asset type
For more opportunities (more trades, lower quality threshold):
• Decrease minimum quality score (40 for day trading, 35 for scalping)
• Disable volume momentum filter
• Lower MTF confluence requirement
• Use Simple or Standard analysis mode
SETTINGS OVERVIEW
Quick Setup Section:
• Trading Style Preset: Auto / Scalping / Day Trading / Swing / Position / Custom
Dashboard & Display:
• Show Dashboard (ON/OFF)
• Dashboard Position (9 options: Top/Middle/Bottom + Left/Center/Right)
• Text Size (Auto/Tiny/Small/Normal/Large/Huge)
• Show Ribbon Fill (ON/OFF)
• Show SuperTrend Line (ON/OFF)
• Bullish Color (default: Green)
• Bearish Color (default: Red)
• Show Entry Labels - BUY/SELL signals (ON/OFF)
• Show Info Labels - Volume events (ON/OFF)
• Label Size (Auto/Tiny/Small/Normal/Large/Huge)
Supertrend Configuration:
• ATR Length (default varies by preset: 7-21)
• ATR Multiplier Base (default varies by preset: 2.0-4.0)
• Use Adaptive Multiplier (ON/OFF) - Dynamic 0.8x-1.2x adjustment
• Smoothing Factor (0.0-0.5) - EMA smoothing applied to bands
• Neutral Bars After Flip (0-10) - Hide ST immediately after flip
Volume Momentum:
• Enable Volume Momentum Filter (ON/OFF)
• Fast Period (default varies by preset: 3-20)
• Slow Period (default varies by preset: 10-50)
Volume Analysis:
• Volume MA Length (default varies by preset: 10-50)
• High Volume Threshold (default: 1.5x)
• Spike Threshold (default: 2.5x)
• Low Volume Threshold (default: 0.7x)
Quality Filters:
• Minimum Quality Score (0-70, varies by preset)
• Require Volume Confirmation (ON/OFF)
Trend Duration Analysis:
• Show Duration Analysis (ON/OFF) - Display duration analysis boxes
• analysis mode - Simple / Standard / Advanced
• Asset Type - 7 options (Small Cap, Biotech, Blue Chip, Tech Growth, Dividend, Cyclical, Crypto)
• Use Exponential Weighting (ON/OFF) - Recent trends weighted more
• Decay Factor (0.5-0.99) - How much more recent trends matter
• Structure Lookback (3-30) - Pivot detection period for support/resistance
• Proximity Threshold (xATR) - How close to level qualifies as "near"
• Enable Error Learning (ON/OFF) - System learns from estimation errors
• Memory Depth (3-20) - How many past errors to remember
Box Visual Settings:
• duration analysis box Border Color
• duration analysis box Background Color
• duration analysis box Text Color
• duration analysis box Border Width
• duration analysis box Transparency
Multi-Timeframe (Optional Feature):
• Enable MTF Confluence (ON/OFF)
• Minimum Alignment Required (0-6)
• Individual timeframe enable/disable toggles
• Custom timeframe selection options
All preset configurations override manual inputs except when "Custom" is selected.
ADVANCED FEATURES
1. Scalpel Mode (Optional)
Advanced pullback entry system that waits for healthy retracements within established trends before signaling entry:
• Monitors price distance from SuperTrend levels
• Requires pullback to configurable range (default: 30-50%)
• Ensures trend remains intact before entry signal
• Reduces whipsaw and false breakouts
• Inspired by Mark Minervini's VCP pullback entries
Best for: Swing traders and day traders seeking precision entries
Scalpers: Consider disabling for faster entries
2. Error Learning System (Advanced analysis mode Only)
The system learns from its own estimation errors:
• Tracks last 10-20 completed duration estimates (configurable memory depth)
• Calculates error ratio for each: estimated duration / Actual Duration
• If system consistently over-estimates: Applies negative correction (-15%)
• If system consistently under-estimates: Applies positive correction (+15%)
• Adapts to current market regime automatically
This self-correction mechanism improves accuracy over time as the system gathers more data on your specific symbol and timeframe.
3. Regime Detection (Advanced analysis mode Only)
Automatically detects whether market is in trending or choppy regime:
• Compares last 3 trends to historical average
• Recent trends 20%+ longer → Trending regime (+20% to estimates)
• Recent trends 20%+ shorter → Choppy regime (-20% to estimates)
• Applied separately to bullish and bearish trends
Helps duration estimates adapt to changing market conditions without manual intervention.
4. Exponential Weighting
Option to weight recent trends more heavily than distant history:
• Default decay factor: 0.9
• Recent trends get higher weight in statistical calculations
• Older trends gradually decay in importance
• Rationale: Recent market behavior more relevant than old data
• Can be disabled for equal weighting
5. Backtest Statistics
System backtests its own duration estimates using historical data:
• Walks through past trends chronologically
• Calculates what duration estimate WOULD have been at each flip
• Compares to actual duration that occurred
• Displays accuracy metrics in duration analysis boxes and dashboard
• Helps assess statistical reliability on your specific chart
Note: Backtest uses only data available AT THE TIME of each historical flip (no lookahead bias).
TECHNICAL SPECIFICATIONS
• Pine Script Version: v6
• Indicator Type: Overlay (draws on price chart)
• Max Boxes: 500 (for duration analysis box storage)
• Max Bars Back: 5000 (for comprehensive historical analysis)
• Security Calls: 1 (for MTF if enabled - optimized)
• Repainting: NO - All signals and duration estimates confirmed on bar close
• Lookahead Bias: NO - All HTF data properly offset, all duration estimates use only historical data
• Real-time Updates: YES - Dashboard and quality scores update live
• Alert Capable: YES - Both automatic alerts and customizable alert conditions
• Multi-Symbol: Works on stocks, crypto, forex, futures, indices
Performance Optimization:
• Conditional calculations (duration analysis can be disabled to reduce load)
• Efficient array management (circular buffers for trend storage)
• Streamlined gradient rendering (26 layers, can be toggled off)
• Smart label cooldown system (prevents label spam)
• Optimized similarity matching (analyzes only relevant trends)
Data Requirements:
• Minimum 50-100 bars for initial duration analysis (builds historical database)
• Optimal: 500+ bars for robust statistical analysis
• Longer history = more accurate duration estimates
• Works on any timeframe from 1 minute to monthly
KNOWN LIMITATIONS
• Trending Markets Only: Performs best in clear trends. May generate false signals in choppy/sideways markets (use quality score filtering and regime detection to mitigate)
• Lagging Nature: Like all trend-following systems, signals occur AFTER trend establishment, not at exact tops/bottoms. Use duration analysis boxes to set realistic profit targets.
• Initial Learning Period: Duration analysis system requires 10-15 completed trends to build reliable historical database. Early duration estimates less accurate (first few weeks on new symbol/timeframe).
• Visual Load: 26-layer gradient ribbon may slow performance on older devices. Disable ribbon if experiencing lag.
• Statistical accuracy Variables: Duration estimates are statistical estimates, not guarantees. Accuracy varies by:
- Market regime (trending vs choppy)
- Asset volatility characteristics
- Quality of historical pattern matches
- Timeframe traded (higher TF = more reliable)
• Not Best Suitable For:
- Ultra-short-term scalping (sub-1-minute charts)
- Mean-reversion strategies (designed for trend-following)
- Range-bound trading (requires trending conditions)
- News-driven spikes (estimates based on technical patterns, not fundamentals)
FREQUENTLY ASKED QUESTIONS
Q: Does this indicator repaint?
A: Absolutely not. All signals, duration analysis boxes, labels, and alerts use barstate.isconfirmed checks. They only appear after the bar closes. What you see in history is exactly what you would have seen in real-time. Zero repaint guarantee.
Q: How accurate are the trend duration estimates?
A: Accuracy varies by mode, market conditions, and historical data quality:
• Simple mode: 60-70% accuracy (within ±20% of actual duration)
• Standard mode: 70-80% accuracy (within ±20% of actual duration)
• Advanced mode: 75-85% accuracy (within ±20% of actual duration)
Best accuracy achieved on:
• Higher timeframes (4H, Daily, Weekly)
• Trending markets (not choppy/sideways)
• Assets with consistent behavior (Blue Chip, Large Cap)
• After 20+ historical trends analyzed (builds robust database)
Remember: All duration estimates are statistical calculations based on historical patterns, not guarantees.
Q: Which analysis mode should I use?
A:
• Simple: Beginners, clean trending markets, want minimal complexity
• Standard: Most traders, general market conditions (RECOMMENDED DEFAULT)
• Advanced: Experienced traders, volatile/complex markets (biotech, small-cap, crypto), seeking maximum accuracy
Advanced mode requires correct Asset Type configuration for optimal results.
Q: What's the difference between the trading style presets?
A: Each preset optimizes ALL parameters for a specific trading approach:
• Scalping: Ultra-sensitive (ATR 7, Mult 2.0), more signals, shorter holds
• Day Trading: Balanced (ATR 10, Mult 2.5), moderate signals, intraday holds
• Swing Trading: Stable (ATR 14, Mult 3.0), fewer signals, multi-day holds
• Position Trading: Very stable (ATR 21, Mult 4.0), rare signals, week/month holds
Auto mode automatically selects based on your chart timeframe.
Q: Should I use Auto mode or manually select a preset?
A: Auto mode is recommended for most traders. It automatically matches settings to your timeframe and re-optimizes if you switch charts. Only use manual preset selection if:
• You want scalping settings on a 15m chart (overriding auto-detection)
• You want swing settings on a 1h chart (more conservative than auto would give)
• You're testing different approaches on same timeframe
Q: Can I use this for scalping and day trading?
A: Absolutely! The preset system is specifically designed for all trading styles:
• Select "Scalping (1-5m)" for 1-5 minute charts
• Select "Day Trading (15m-1h)" for 15m-1h charts
• Or use "Auto" mode and it configures automatically
Volume momentum filter is auto-disabled in Scalping mode for faster signals.
Q: What is Volume Momentum and why does it matter?
A: Volume Momentum compares short-term volume (fast MA) to long-term volume (slow MA). It answers: "Is money flowing into this asset faster now than historically?"
Why it matters:
• Volume often leads price (early warning system)
• Confirms institutional participation (smart money)
• No lag like price-based indicators
• More intuitive than complex mathematical filters
When the ratio is above 1.2, you have strong evidence that institutions are accumulating (bullish) or distributing (bearish).
Q: How do I set up alerts?
A: Two options:
Option 1 - Automatic Alerts:
1. Right-click on chart → Add Alert
2. Condition: Select this indicator
3. Choose "Any alert() function call"
4. Configure notification method (app, email, webhook)
5. You'll receive detailed alerts on every BUY and SELL signal
Option 2 - Customizable Alert Conditions:
1. Right-click on chart → Add Alert
2. Condition: Select this indicator
3. You'll see three options in dropdown:
- "BUY Signal" (long signals only)
- "SELL Signal" (short signals only)
- "ANY Signal" (both BUY and SELL)
4. Choose desired option and customize message template
5. Uses TradingView placeholders: {{ticker}}, {{close}}, {{time}}, etc.
All alerts fire only on confirmed bar close (no repaint).
Q: What is Scalpel Mode and should I use it?
A: Scalpel Mode waits for healthy pullbacks within established trends before signaling entry. It reduces whipsaws and improves entry timing.
Recommended ON for:
• Swing traders (want precision entries on pullbacks)
• Day traders (willing to wait for better prices)
• Risk-averse traders (prefer fewer but higher-quality entries)
Recommended OFF for:
• Scalpers (need immediate entries, can't wait for pullbacks)
• Momentum traders (want to enter on breakout, not pullback)
• Aggressive traders (prefer more opportunities over precision)
Q: Why do some duration estimates show wider ranges than others?
A: Range width reflects historical trend variability:
• Narrow range: Similar historical trends had consistent durations (high confidence)
• Wide range: Similar historical trends had varying durations (lower confidence)
Wide ranges often occur:
• Early in analysis (fewer historical trends to learn from)
• In volatile/choppy markets (inconsistent trend behavior)
• On lower timeframes (more noise, less consistency)
The median and average still provide useful targets even when range is wide.
Q: Can I customize the dashboard position and appearance?
A: Yes! Dashboard settings include:
• Position: 9 options (Top/Middle/Bottom + Left/Center/Right)
• Text Size: Auto, Tiny, Small, Normal, Large, Huge
• Show/Hide: Toggle entire dashboard on/off
Choose position that doesn't overlap important price action on your specific chart.
Q: Which timeframe should I trade on?
A: Depends on your trading style and time availability:
• 1-5 minute: Active scalping, requires constant monitoring
• 15m-1h: Day trading, check few times per session
• 4h-Daily: Swing trading, check once or twice daily
• Daily-Weekly: Position trading, check weekly
General principle: Higher timeframes produce:
• Fewer signals (less frequent)
• Higher quality setups (stronger confirmations)
• More reliable duration estimates (better statistical data)
• Less noise (clearer trends)
Start with Daily chart if new to trading. Move to lower timeframes as you gain experience.
Q: Does this work on all markets (stocks, crypto, forex)?
A: Yes, it works on all markets with trending characteristics:
Excellent for:
• Stocks (especially growth and momentum names)
• Crypto (BTC, ETH, major altcoins)
• Futures (indices, commodities)
• Forex majors (EUR/USD, GBP/USD, etc.)
Best results on:
• Trending markets (not range-bound)
• Liquid instruments (tight spreads, good fills)
• Volatile assets (clear trend development)
Less effective on:
• Range-bound/sideways markets
• Ultra-low volatility instruments
• Illiquid small-caps (use caution)
Configure Asset Type (in Advanced analysis mode) to match your instrument for best accuracy.
Q: How many signals should I expect per day/week?
A: Highly variable based on:
By Timeframe:
• 1-5 minute: 5-15 signals per session
• 15m-1h: 2-5 signals per day
• 4h-Daily: 2-5 signals per week
• Daily-Weekly: 1-2 signals per month
By Market Volatility:
• High volatility = more SuperTrend flips = more signals
• Low volatility = fewer flips = fewer signals
By Quality Filter:
• Higher threshold (60-70) = fewer but better signals
• Lower threshold (30-40) = more signals, lower quality
By Volume Momentum Filter:
• Enabled = Fewer signals (only volume-confirmed)
• Disabled = More signals (all SuperTrend flips)
Adjust quality threshold and filters to match your desired signal frequency.
Q: What's the difference between entry labels and info labels?
A:
Entry Labels (BUY/SELL):
• Your primary trading signals
• Based on SuperTrend flip + all confirmations (quality, volume, momentum)
• Include quality score and confirmation icons
• These are actionable entry points
Info Labels (Volume Spike):
• Additional market context
• Show volume events that may support or contradict trend
• 8-bar cooldown to prevent spam
• NOT necessarily entry points - contextual information only
Control separately: Can show entry labels without info labels (recommended for clean charts).
Q: Can I combine this with other indicators?
A: Absolutely! This works well with:
• RSI: For divergences and overbought/oversold conditions
• Support/Resistance: Confluence with key levels
• Fibonacci Retracements: Pullback targets in Scalpel Mode
• Price Action Patterns: Flags, pennants, cup-and-handle
• MACD: Additional momentum confirmation
• Bollinger Bands: Volatility context
This indicator provides trend direction and duration estimates - complement with other tools for entry refinement and additional confluence.
Q: Why did I get a low-quality signal? Can I filter them out?
A: Yes! Increase the Minimum Quality Score in settings.
If you're seeing signals with quality below your preference:
• Day Trading: Set minimum to 50
• Swing Trading: Set minimum to 60
• Position Trading: Set minimum to 70
Only signals meeting the threshold will appear. This reduces frequency but improves win-rate.
Q: How do I interpret the MTF Confluence count?
A: Shows how many of 6 timeframes agree with current trend:
• 6/6 aligned: Perfect agreement (extremely rare, highest confidence)
• 5/6 aligned: Very strong alignment (high confidence)
• 4/6 aligned: Good alignment (standard quality setup)
• 3/6 aligned: Moderate alignment (acceptable)
• 2/6 aligned: Weak alignment (caution)
• 1/6 aligned: Very weak (likely counter-trend)
Higher confluence typically correlates with longer, stronger trends. However, MTF analysis is optional - you can disable it and rely solely on quality scoring.
Q: Is this suitable for beginners?
A: Yes, but requires foundational knowledge:
You should understand:
• Basic trend-following concepts (higher highs, higher lows)
• Risk management principles (position sizing, stop losses)
• How to read candlestick charts
• What volume and volatility mean
Beginner-friendly features:
• Auto preset mode (zero configuration)
• Quality scoring (tells you signal strength)
• Dashboard tooltips (hover for explanations)
• duration analysis boxes (visual profit targets)
Recommended for beginners:
1. Start with "Auto" or "Swing Trading" preset on Daily chart
2. Use Standard Analysis Mode (not Advanced)
3. Set minimum quality to 60 (fewer but better signals)
4. Paper trade first for 2-4 weeks
5. Study methodology references (Minervini, O'Neil, Zanger)
Q: What is the Asset Type setting and why does it matter?
A: Asset Type (in Advanced analysis mode) adjusts duration estimates based on volatility characteristics:
• Small Cap: Explosive moves, extended trends (+30-40%)
• Biotech / Speculative: Parabolic potential, news-driven (+40%)
• Blue Chip / Large Cap: Baseline, steady trends (0% adjustment)
• Tech Growth: Momentum-driven, longer trends (+20%)
• Dividend / Value: Slower, grinding trends (-20%)
• Cyclical: Macro-driven, variable (±10%)
• Crypto / High Volatility: Parabolic potential (+30%)
Correct configuration improves Statistical accuracy by 15-20%. Using Blue Chip settings on a biotech stock may underestimate trend length (you'll exit too early).
Q: Can I backtest this indicator?
A: Yes! TradingView's Strategy Tester works with this indicator's signals.
To backtest:
1. Note the entry conditions (SuperTrend flip + quality threshold + filters)
2. Create a strategy script using same logic
3. Run Strategy Tester on historical data
Additionally, the indicator includes BUILT-IN duration estimate validation:
• System backtests its own duration estimates
• Shows accuracy metrics in dashboard and duration analysis boxes
• Helps assess reliability on your specific symbol/timeframe
Q: Why does Volume Momentum auto-disable in Scalping mode?
A: Scalping requires ultra-fast entries to catch quick moves. Volume Momentum filter adds friction by requiring volume confirmation before signaling, which can cause missed opportunities in rapid scalping.
Scalping preset is optimized for speed and frequency - the filter is counterproductive for that style. It remains enabled for Day Trading, Swing Trading, and Position Trading presets where patience improves results.
You can manually enable it in Custom mode if desired.
Q: How much historical data do I need for accurate duration estimates?
A:
Minimum: 50-100 bars (indicator will function but duration estimates less reliable)
Recommended: 500+ bars (robust statistical database)
Optimal: 1000+ bars (maximum Statistical accuracy)
More history = more completed trends = better pattern matching = more accurate duration estimates.
New symbols or newly-switched timeframes will have lower Statistical accuracy initially. Allow 2-4 weeks for the system to build historical database.
IMPORTANT DISCLAIMERS
No Guarantee of Profit:
This indicator is an educational tool and does not guarantee any specific trading results. All trading involves substantial risk of loss. Duration estimates are statistical calculations based on historical patterns and are not guarantees of future performance.
Past Performance:
Historical backtest results and Statistical accuracy statistics do not guarantee future performance. Market conditions change constantly. What worked historically may not work in current or future markets.
Not Financial Advice:
This indicator provides technical analysis signals and statistical duration estimates only. It is not financial, investment, or trading advice. Always consult with a qualified financial advisor before making investment decisions.
Risk Warning:
Trading stocks, options, futures, forex, and cryptocurrencies involves significant risk. You can lose all of your invested capital. Never trade with money you cannot afford to lose. Only risk capital you can lose without affecting your lifestyle.
Testing Required:
Always test this indicator on a demo account or with paper trading before risking real capital. Understand how it works in different market conditions. Verify Statistical accuracy on your specific instruments and timeframes before trusting it with real money.
User Responsibility:
You are solely responsible for your trading decisions. The developer assumes no liability for trading losses, incorrect duration estimates, software errors, or any other damages incurred while using this indicator.
Statistical Estimation Limitations:
Trend Duration estimates are statistical estimates based on historical pattern matching. They are NOT guarantees. Actual trend durations may differ significantly from duration estimates due to unforeseen news events, market regime changes, or lack of historical precedent for current conditions.
CREDITS & ACKNOWLEDGMENTS
Methodology Inspiration:
• Mark Minervini - Volatility Contraction Pattern (VCP) concepts and pullback entry techniques
• William O'Neil - Volume analysis principles and CANSLIM institutional buying patterns
• Dan Zanger - Momentum breakout strategies and volatility expansion entries
Technical Components:
• SuperTrend calculation - Classic ATR-based trend indicator (public domain)
• Statistical analysis - Standard median, average, range calculations
• k-Nearest Neighbors - Classic machine learning similarity matching concept
• Multi-timeframe analysis - Standard request.security implementation in Pine Script
For questions, feedback, or support, please comment below or send a private message.
Happy Trading!
Trading Pro with Kama Hariss 369Indicators used in strategy are 20 EMA, KAMA, RSI and DMI/ADX and RVOL.
Buy signal activates when price closes above kama and kama is above 20 ema. RSI greater than 55, D+>D- and ADX>20. Kama is upward slopping.
Sell signal activates when price closes below kama and kama is below 20 ema. RSI <45, D+

EMA & MA Alert Strategies8 Trading Strategies for Alerts:
Strategy 1: EMA Golden Cross / Death Cross
EMA1 crosses above EMA2 → bullish momentum
EMA1 crosses below EMA2 → bearish momentum
Stronger: EMA1 crosses EMA3
Strategy 2: MA Golden Cross / Death Cross
MA1 crosses above MA2 → trend reversal up
MA1 crosses below MA2 → trend reversal down
Strategy 3: EMA Alignment (Trend Direction)
Bullish: EMA1 > EMA2 > EMA3 (uptrend)
Bearish: EMA1 < EMA2 < EMA3 (downtrend)
Alerts when alignment changes
Strategy 4: Price vs EMA (Support/Resistance)
Price breaks above EMA2/EMA3 → bullish breakout
Price breaks below EMA2/EMA3 → bearish breakdown
Strategy 5: EMA vs MA Crossover
EMA1 crosses above MA1 → momentum exceeds trend
EMA2 crosses above MA2 → stronger momentum signal
Strategy 6: Pullback to EMA (Buy the Dip)
Price pulls back to EMA2/EMA3 and bounces → buy signal
Useful for entry during uptrends
Strategy 7: EMA Squeeze/Expansion
EMAs converging → potential breakout
EMAs expanding → trend acceleration
Strategy 8: Multi-Timeframe Confirmation
Price above all EMAs and MAs → strong uptrend
Price below all EMAs and MAs → strong downtrend
