Opening Range Breakout with 2 Profit Targets.Opening Range Breakout with 2 Profit Targets.
Updated Indicator now works on all Symbols with Many Different Session Options.
***Known PineScript Issue…While the Opening Range is being Formed the lines only adjust for that individual bar. Just reset Indicator after Opening Range Completes.
***All Times are Based on New York Time
Session Options Forex U.S. Banks Open (8:00), Gold U.S. Open (8:20), Oil U.S. Open (9:00), U.S. Cash Session - Stocks (9:30), NY Forex Open (17:00) , Europe Open (02:00), or if you choose Setting 0 the Session Runs from 00:00 to 00:00 (Midnight to Midnight).
***Ability to use 60 minute Opening Range, 30 minute, 15 minute, and many other options.
***However you can manually change the times in the Inputs Tab to adjust for any session you prefer. This is useful for Day Light Savings Adjustments. Also the default times work if your charts are set to EST Time. If you use A different time zone in your settings you need to Adjust the times in the inputs tab.
Initially Opening Range High and Low plot as Yellow Lines. If Price Goes Above Opening Range then Line Turns Green. If Price Goes Below Opening Range Line Turns Red.
By default the First Profit Target is 1/2 the Width of the Opening Range and the 2nd Profit Target is 1 Times the Opening Range. However these are Adjustable in the Inputs Tab.
By Default the Opening Range Length is 1 Hour. However, you can Change the Opening Range Length to 15 min, 30 min, 2 hours etc. in the Inputs Tab.
Plots a 1 Above or Below Candle when 1st Profit Target is Achieved, and a 2 when 2nd Profit Target is Achieved.
ابحث في النصوص البرمجية عن "重庆30天天气预报"

Ultimate RSI [captainua]Ultimate RSI
Overview
This indicator combines multiple RSI calculations with volume analysis, divergence detection, and trend filtering to provide a comprehensive RSI-based trading system. The script calculates RSI using three different periods (6, 14, 24) and applies various smoothing methods to reduce noise while maintaining responsiveness. The combination of these features creates a multi-layered confirmation system that reduces false signals by requiring alignment across multiple indicators and timeframes.
The script includes optimized configuration presets for instant setup: Scalping, Day Trading, Swing Trading, and Position Trading. Simply select a preset to instantly configure all settings for your trading style, or use Custom mode for full manual control. All settings include automatic input validation to prevent configuration errors and ensure optimal performance.
Configuration Presets
The script includes preset configurations optimized for different trading styles, allowing you to instantly configure the indicator for your preferred trading approach. Simply select a preset from the "Configuration Preset" dropdown menu:
- Scalping: Optimized for fast-paced trading with shorter RSI periods (4, 7, 9) and minimal smoothing. Noise reduction is automatically disabled, and momentum confirmation is disabled to allow faster signal generation. Designed for quick entries and exits in volatile markets.
- Day Trading: Balanced configuration for intraday trading with moderate RSI periods (6, 9, 14) and light smoothing. Momentum confirmation is enabled for better signal quality. Ideal for day trading strategies requiring timely but accurate signals.
- Swing Trading: Configured for medium-term positions with standard RSI periods (14, 14, 21) and moderate smoothing. Provides smoother signals suitable for swing trading timeframes. All noise reduction features remain active.
- Position Trading: Optimized for longer-term trades with extended RSI periods (24, 21, 28) and heavier smoothing. Filters are configured for highest-quality signals. Best for position traders holding trades over multiple days or weeks.
- Custom: Full manual control over all settings. All input parameters are available for complete customization. This is the default mode and maintains full backward compatibility with previous versions.
When a preset is selected, it automatically adjusts RSI periods, smoothing lengths, and filter settings to match the trading style. The preset configurations ensure optimal settings are applied instantly, eliminating the need for manual configuration. All settings can still be manually overridden if needed, providing flexibility while maintaining ease of use.
Input Validation and Error Prevention
The script includes comprehensive input validation to prevent configuration errors:
- Cross-Input Validation: Smoothing lengths are automatically validated to ensure they are always less than their corresponding RSI period length. If you set a smoothing length greater than or equal to the RSI length, the script automatically adjusts it to (RSI Length - 1). This prevents logical errors and ensures valid configurations.
- Input Range Validation: All numeric inputs have minimum and maximum value constraints enforced by TradingView's input system, preventing invalid parameter values.
- Smart Defaults: Preset configurations use validated default values that are tested and optimized for each trading style. When switching between presets, all related settings are automatically updated to maintain consistency.
Core Calculations
Multi-Period RSI:
The script calculates RSI using the standard Wilder's RSI formula: RSI = 100 - (100 / (1 + RS)), where RS = Average Gain / Average Loss over the specified period. Three separate RSI calculations run simultaneously:
- RSI(6): Uses 6-period lookback for high sensitivity to recent price changes, useful for scalping and early signal detection
- RSI(14): Standard 14-period RSI for balanced analysis, the most commonly used RSI period
- RSI(24): Longer 24-period RSI for trend confirmation, provides smoother signals with less noise
Each RSI can be smoothed using EMA, SMA, RMA (Wilder's smoothing), WMA, or Zero-Lag smoothing. Zero-Lag smoothing uses the formula: ZL-RSI = RSI + (RSI - RSI ) to reduce lag while maintaining signal quality. You can apply individual smoothing lengths to each RSI period, or use global smoothing where all three RSIs share the same smoothing length.
Dynamic Overbought/Oversold Thresholds:
Static thresholds (default 70/30) are adjusted based on market volatility using ATR. The formula: Dynamic OB = Base OB + (ATR × Volatility Multiplier × Base Percentage / 100), Dynamic OS = Base OS - (ATR × Volatility Multiplier × Base Percentage / 100). This adapts to volatile markets where traditional 70/30 levels may be too restrictive. During high volatility, the dynamic thresholds widen, and during low volatility, they narrow. The thresholds are clamped between 0-100 to remain within RSI bounds. The ATR is cached for performance optimization, updating on confirmed bars and real-time bars.
Adaptive RSI Calculation:
An adaptive RSI adjusts the standard RSI(14) based on current volatility relative to average volatility. The calculation: Adaptive Factor = (Current ATR / SMA of ATR over 20 periods) × Volatility Multiplier. If SMA of ATR is zero (edge case), the adaptive factor defaults to 0. The adaptive RSI = Base RSI × (1 + Adaptive Factor), clamped to 0-100. This makes the indicator more responsive during high volatility periods when traditional RSI may lag. The adaptive RSI is used for signal generation (buy/sell signals) but is not plotted on the chart.
Overbought/Oversold Fill Zones:
The script provides visual fill zones between the RSI line and the threshold lines when RSI is in overbought or oversold territory. The fill logic uses inclusive conditions: fills are shown when RSI is currently in the zone OR was in the zone on the previous bar. This ensures complete coverage of entry and exit boundaries. A minimum gap of 0.1 RSI points is maintained between the RSI plot and threshold line to ensure reliable polygon rendering in TradingView. The fill uses invisible plots at the threshold levels and the RSI value, with the fill color applied between them. You can select which RSI (6, 14, or 24) to use for the fill zones.
Divergence Detection
Regular Divergence:
Bullish divergence: Price makes a lower low (current low < lowest low from previous lookback period) while RSI makes a higher low (current RSI > lowest RSI from previous lookback period). Bearish divergence: Price makes a higher high (current high > highest high from previous lookback period) while RSI makes a lower high (current RSI < highest RSI from previous lookback period). The script compares current price/RSI values to the lowest/highest values from the previous lookback period using ta.lowest() and ta.highest() functions with index to reference the previous period's extreme.
Pivot-Based Divergence:
An enhanced divergence detection method that uses actual pivot points instead of simple lowest/highest comparisons. This provides more accurate divergence detection by identifying significant pivot lows/highs in both price and RSI. The pivot-based method uses a tolerance-based approach with configurable constants: 1% tolerance for price comparisons (priceTolerancePercent = 0.01) and 1.0 RSI point absolute tolerance for RSI comparisons (pivotTolerance = 1.0). Minimum divergence threshold is 1.0 RSI point (minDivergenceThreshold = 1.0). It looks for two recent pivot points and compares them: for bullish divergence, price makes a lower low (at least 1% lower) while RSI makes a higher low (at least 1.0 point higher). This method reduces false divergences by requiring actual pivot points rather than just any low/high within a period. When enabled, pivot-based divergence replaces the traditional method for more accurate signal generation.
Strong Divergence:
Regular divergence is confirmed by an engulfing candle pattern. Bullish engulfing requires: (1) Previous candle is bearish (close < open ), (2) Current candle is bullish (close > open), (3) Current close > previous open, (4) Current open < previous close. Bearish engulfing is the inverse: previous bullish, current bearish, current close < previous open, current open > previous close. Strong divergence signals are marked with visual indicators (🐂 for bullish, 🐻 for bearish) and have separate alert conditions.
Hidden Divergence:
Continuation patterns that signal trend continuation rather than reversal. Bullish hidden divergence: Price makes a higher low (current low > lowest low from previous period) but RSI makes a lower low (current RSI < lowest RSI from previous period). Bearish hidden divergence: Price makes a lower high (current high < highest high from previous period) but RSI makes a higher high (current RSI > highest RSI from previous period). These patterns indicate the trend is likely to continue in the current direction.
Volume Confirmation System
Volume threshold filtering requires current volume to exceed the volume SMA multiplied by the threshold factor. The formula: Volume Confirmed = Volume > (Volume SMA × Threshold). If the threshold is set to 0.1 or lower, volume confirmation is effectively disabled (always returns true). This allows you to use the indicator without volume filtering if desired.
Volume Climax is detected when volume exceeds: Volume SMA + (Volume StdDev × Multiplier). This indicates potential capitulation moments where extreme volume accompanies price movements. Volume Dry-Up is detected when volume falls below: Volume SMA - (Volume StdDev × Multiplier), indicating low participation periods that may produce unreliable signals. The volume SMA is cached for performance, updating on confirmed and real-time bars.
Multi-RSI Synergy
The script generates signals when multiple RSI periods align in overbought or oversold zones. This creates a confirmation system that reduces false signals. In "ALL" mode, all three RSIs (6, 14, 24) must be simultaneously above the overbought threshold OR all three must be below the oversold threshold. In "2-of-3" mode, any two of the three RSIs must align in the same direction. The script counts how many RSIs are in each zone: twoOfThreeOB = ((rsi6OB ? 1 : 0) + (rsi14OB ? 1 : 0) + (rsi24OB ? 1 : 0)) >= 2.
Synergy signals require: (1) Multi-RSI alignment (ALL or 2-of-3), (2) Volume confirmation, (3) Reset condition satisfied (enough bars since last synergy signal), (4) Additional filters passed (RSI50, Trend, ADX, Volume Dry-Up avoidance). Separate reset conditions track buy and sell signals independently. The reset condition uses ta.barssince() to count bars since the last trigger, returning true if the condition never occurred (allowing first signal) or if enough bars have passed.
Regression Forecasting
The script uses historical RSI values to forecast future RSI direction using four methods. The forecast horizon is configurable (1-50 bars ahead). Historical data is collected into an array, and regression coefficients are calculated based on the selected method.
Linear Regression: Calculates the least-squares fit line (y = mx + b) through the last N RSI values. The calculation: meanX = sumX / horizon, meanY = sumY / horizon, denominator = sumX² - horizon × meanX², m = (sumXY - horizon × meanX × meanY) / denominator, b = meanY - m × meanX. The forecast projects this line forward: forecast = b + m × i for i = 1 to horizon.
Polynomial Regression: Fits a quadratic curve (y = ax² + bx + c) to capture non-linear trends. The system of equations is solved using Cramer's rule with a 3×3 determinant. If the determinant is too small (< 0.0001), the system falls back to linear regression. Coefficients are calculated by solving: n×c + sumX×b + sumX²×a = sumY, sumX×c + sumX²×b + sumX³×a = sumXY, sumX²×c + sumX³×b + sumX⁴×a = sumX²Y. Note: Due to the O(n³) computational complexity of polynomial regression, the forecast horizon is automatically limited to a maximum of 20 bars when using polynomial regression to maintain optimal performance. If you set a horizon greater than 20 bars with polynomial regression, it will be automatically capped at 20 bars.
Exponential Smoothing: Applies exponential smoothing with adaptive alpha = 2/(horizon+1). The smoothing iterates from oldest to newest value: smoothed = alpha × series + (1 - alpha) × smoothed. Trend is calculated by comparing current smoothed value to an earlier smoothed value (at 60% of horizon): trend = (smoothed - earlierSmoothed) / (horizon - earlierIdx). Forecast: forecast = base + trend × i.
Moving Average: Uses the difference between short MA (horizon/2) and long MA (horizon) to estimate trend direction. Trend = (maShort - maLong) / (longLen - shortLen). Forecast: forecast = maShort + trend × i.
Confidence bands are calculated using RMSE (Root Mean Squared Error) of historical forecast accuracy. The error calculation compares historical values with forecast values: RMSE = sqrt(sumSquaredError / count). If insufficient data exists, it falls back to calculating standard deviation of recent RSI values. Confidence bands = forecast ± (RMSE × confidenceLevel). All forecast values and confidence bands are clamped to 0-100 to remain within RSI bounds. The regression functions include comprehensive safety checks: horizon validation (must not exceed array size), empty array handling, edge case handling for horizon=1 scenarios, division-by-zero protection, and bounds checking for all array access operations to prevent runtime errors.
Strong Top/Bottom Detection
Strong buy signals require three conditions: (1) RSI is at its lowest point within the bottom period: rsiVal <= ta.lowest(rsiVal, bottomPeriod), (2) RSI is below the oversold threshold minus a buffer: rsiVal < (oversoldThreshold - rsiTopBottomBuffer), where rsiTopBottomBuffer = 2.0 RSI points, (3) The absolute difference between current RSI and the lowest RSI exceeds the threshold value: abs(rsiVal - ta.lowest(rsiVal, bottomPeriod)) > threshold. This indicates a bounce from extreme levels with sufficient distance from the absolute low.
Strong sell signals use the inverse logic: RSI at highest point, above overbought threshold + rsiTopBottomBuffer (2.0 RSI points), and difference from highest exceeds threshold. Both signals also require: volume confirmation, reset condition satisfied (separate reset for buy vs sell), and all additional filters passed (RSI50, Trend, ADX, Volume Dry-Up avoidance).
The reset condition uses separate logic for buy and sell: resetCondBuy checks bars since isRSIAtBottom, resetCondSell checks bars since isRSIAtTop. This ensures buy signals reset based on bottom conditions and sell signals reset based on top conditions, preventing incorrect signal blocking.
Filtering System
RSI(50) Filter: Only allows buy signals when RSI(14) > 50 (bullish momentum) and sell signals when RSI(14) < 50 (bearish momentum). This filter ensures you're buying in uptrends and selling in downtrends from a momentum perspective. The filter is optional and can be disabled. Recommended to enable for noise reduction.
Trend Filter: Uses a long-term EMA (default 200) to determine trend direction. Buy signals require price above EMA, sell signals require price below EMA. The EMA slope is calculated as: emaSlope = ema - ema . Optional EMA slope filter additionally requires the EMA to be rising (slope > 0) for buy signals or falling (slope < 0) for sell signals. This provides stronger trend confirmation by requiring both price position and EMA direction.
ADX Filter: Uses the Directional Movement Index (calculated via ta.dmi()) to measure trend strength. Signals only fire when ADX exceeds the threshold (default 20), indicating a strong trend rather than choppy markets. The ADX calculation uses separate length and smoothing parameters. This filter helps avoid signals during sideways/consolidation periods.
Volume Dry-Up Avoidance: Prevents signals during periods of extremely low volume relative to average. If volume dry-up is detected and the filter is enabled, signals are blocked. This helps avoid unreliable signals that occur during low participation periods.
RSI Momentum Confirmation: Requires RSI to be accelerating in the signal direction before confirming signals. For buy signals, RSI must be consistently rising (recovering from oversold) over the lookback period. For sell signals, RSI must be consistently falling (declining from overbought) over the lookback period. The momentum check verifies that all consecutive changes are in the correct direction AND the cumulative change is significant. This filter ensures signals only fire when RSI momentum aligns with the signal direction, reducing false signals from weak momentum.
Multi-Timeframe Confirmation: Requires higher timeframe RSI to align with the signal direction. For buy signals, current RSI must be below the higher timeframe RSI by at least the confirmation threshold. For sell signals, current RSI must be above the higher timeframe RSI by at least the confirmation threshold. This ensures signals align with the larger trend context, reducing counter-trend trades. The higher timeframe RSI is fetched using request.security() from the selected timeframe.
All filters use the pattern: filterResult = not filterEnabled OR conditionMet. This means if a filter is disabled, it always passes (returns true). Filters can be combined, and all must pass for a signal to fire.
RSI Centerline and Period Crossovers
RSI(50) Centerline Crossovers: Detects when the selected RSI source crosses above or below the 50 centerline. Bullish crossover: ta.crossover(rsiSource, 50), bearish crossover: ta.crossunder(rsiSource, 50). You can select which RSI (6, 14, or 24) to use for these crossovers. These signals indicate momentum shifts from bearish to bullish (above 50) or bullish to bearish (below 50).
RSI Period Crossovers: Detects when different RSI periods cross each other. Available pairs: RSI(6) × RSI(14), RSI(14) × RSI(24), or RSI(6) × RSI(24). Bullish crossover: fast RSI crosses above slow RSI (ta.crossover(rsiFast, rsiSlow)), indicating momentum acceleration. Bearish crossover: fast RSI crosses below slow RSI (ta.crossunder(rsiFast, rsiSlow)), indicating momentum deceleration. These crossovers can signal shifts in momentum before price moves.
StochRSI Calculation
Stochastic RSI applies the Stochastic oscillator formula to RSI values instead of price. The calculation: %K = ((RSI - Lowest RSI) / (Highest RSI - Lowest RSI)) × 100, where the lookback is the StochRSI length. If the range is zero, %K defaults to 50.0. %K is then smoothed using SMA with the %K smoothing length. %D is calculated as SMA of smoothed %K with the %D smoothing length. All values are clamped to 0-100. You can select which RSI (6, 14, or 24) to use as the source for StochRSI calculation.
RSI Bollinger Bands
Bollinger Bands are applied to RSI(14) instead of price. The calculation: Basis = SMA(RSI(14), BB Period), StdDev = stdev(RSI(14), BB Period), Upper = Basis + (StdDev × Deviation Multiplier), Lower = Basis - (StdDev × Deviation Multiplier). This creates dynamic zones around RSI that adapt to RSI volatility. When RSI touches or exceeds the bands, it indicates extreme conditions relative to recent RSI behavior.
Noise Reduction System
The script includes a comprehensive noise reduction system to filter false signals and improve accuracy. When enabled, signals must pass multiple quality checks:
Signal Strength Requirement: RSI must be at least X points away from the centerline (50). For buy signals, RSI must be at least X points below 50. For sell signals, RSI must be at least X points above 50. This ensures signals only trigger when RSI is significantly in oversold/overbought territory, not just near neutral.
Extreme Zone Requirement: RSI must be deep in the OB/OS zone. For buy signals, RSI must be at least X points below the oversold threshold. For sell signals, RSI must be at least X points above the overbought threshold. This ensures signals only fire in extreme conditions where reversals are more likely.
Consecutive Bar Confirmation: The signal condition must persist for N consecutive bars before triggering. This reduces false signals from single-bar spikes or noise. The confirmation checks that the signal condition was true for all bars in the lookback period.
Zone Persistence (Optional): Requires RSI to remain in the OB/OS zone for N consecutive bars, not just touch it. This ensures RSI is truly in an extreme state rather than just briefly touching the threshold. When enabled, this provides stricter filtering for higher-quality signals.
RSI Slope Confirmation (Optional): Requires RSI to be moving in the expected signal direction. For buy signals, RSI should be rising (recovering from oversold). For sell signals, RSI should be falling (declining from overbought). This ensures momentum is aligned with the signal direction. The slope is calculated by comparing current RSI to RSI N bars ago.
All noise reduction filters can be enabled/disabled independently, allowing you to customize the balance between signal frequency and accuracy. The default settings provide a good balance, but you can adjust them based on your trading style and market conditions.
Alert System
The script includes separate alert conditions for each signal type: buy/sell (adaptive RSI crossovers), divergence (regular, strong, hidden), crossovers (RSI50 centerline, RSI period crossovers), synergy signals, and trend breaks. Each alert type has its own alertcondition() declaration with a unique title and message.
An optional cooldown system prevents alert spam by requiring a minimum number of bars between alerts of the same type. The cooldown check: canAlert = na(lastAlertBar) OR (bar_index - lastAlertBar >= cooldownBars). If the last alert bar is na (first alert), it always allows the alert. Each alert type maintains its own lastAlertBar variable, so cooldowns are independent per signal type. The default cooldown is 10 bars, which is recommended for noise reduction.
Higher Timeframe RSI
The script can display RSI from a higher timeframe using request.security(). This allows you to see the RSI context from a larger timeframe (e.g., daily RSI on an hourly chart). The higher timeframe RSI uses RSI(14) calculation from the selected timeframe. This provides context for the current timeframe's RSI position relative to the larger trend.
RSI Pivot Trendlines
The script can draw trendlines connecting pivot highs and lows on RSI(6). This feature helps visualize RSI trends and identify potential trend breaks.
Pivot Detection: Pivots are detected using a configurable period. The script can require pivots to have minimum strength (RSI points difference from surrounding bars) to filter out weak pivots. Lower minPivotStrength values detect more pivots (more trendlines), while higher values detect only stronger pivots (fewer but more significant trendlines). Pivot confirmation is optional: when enabled, the script waits N bars to confirm the pivot remains the extreme, reducing repainting. Pivot confirmation functions (f_confirmPivotLow and f_confirmPivotHigh) are always called on every bar for consistency, as recommended by TradingView. When pivot bars are not available (na), safe default values are used, and the results are then used conditionally based on confirmation settings. This ensures consistent calculations and prevents calculation inconsistencies.
Trendline Drawing: Uptrend lines connect confirmed pivot lows (green), and downtrend lines connect confirmed pivot highs (red). By default, only the most recent trendline is shown (old trendlines are deleted when new pivots are confirmed). This keeps the chart clean and uncluttered. If "Keep Historical Trendlines" is enabled, the script preserves up to N historical trendlines (configurable via "Max Trendlines to Keep", default 5). When historical trendlines are enabled, old trendlines are saved to arrays instead of being deleted, allowing you to see multiple trendlines simultaneously for better trend analysis. The arrays are automatically limited to prevent memory accumulation.
Trend Break Detection: Signals are generated when RSI breaks above or below trendlines. Uptrend breaks (RSI crosses below uptrend line) generate buy signals. Downtrend breaks (RSI crosses above downtrend line) generate sell signals. Optional trend break confirmation requires the break to persist for N bars and optionally include volume confirmation. Trendline angle filtering can exclude flat/weak trendlines from generating signals (minTrendlineAngle > 0 filters out weak/flat trendlines).
How Components Work Together
The combination of multiple RSI periods provides confirmation across different timeframes, reducing false signals. RSI(6) catches early moves, RSI(14) provides balanced signals, and RSI(24) confirms longer-term trends. When all three align (synergy), it indicates strong consensus across timeframes.
Volume confirmation ensures signals occur with sufficient market participation, filtering out low-volume false breakouts. Volume climax detection identifies potential reversal points, while volume dry-up avoidance prevents signals during unreliable low-volume periods.
Trend filters align signals with the overall market direction. The EMA filter ensures you're trading with the trend, and the EMA slope filter adds an additional layer by requiring the trend to be strengthening (rising EMA for buys, falling EMA for sells).
ADX filter ensures signals only fire during strong trends, avoiding choppy/consolidation periods. RSI(50) filter ensures momentum alignment with the trade direction.
Momentum confirmation requires RSI to be accelerating in the signal direction, ensuring signals only fire when momentum is aligned. Multi-timeframe confirmation ensures signals align with higher timeframe trends, reducing counter-trend trades.
Divergence detection identifies potential reversals before they occur, providing early warning signals. Pivot-based divergence provides more accurate detection by using actual pivot points. Hidden divergence identifies continuation patterns, useful for trend-following strategies.
The noise reduction system combines multiple filters (signal strength, extreme zone, consecutive bars, zone persistence, RSI slope) to significantly reduce false signals. These filters work together to ensure only high-quality signals are generated.
The synergy system requires alignment across all RSI periods for highest-quality signals, significantly reducing false positives. Regression forecasting provides forward-looking context, helping anticipate potential RSI direction changes.
Pivot trendlines provide visual trend analysis and can generate signals when RSI breaks trendlines, indicating potential reversals or continuations.
Reset conditions prevent signal spam by requiring a minimum number of bars between signals. Separate reset conditions for buy and sell signals ensure proper signal management.
Usage Instructions
Configuration Presets (Recommended): The script includes optimized preset configurations for instant setup. Simply select your trading style from the "Configuration Preset" dropdown:
- Scalping Preset: RSI(4, 7, 9) with minimal smoothing. Noise reduction disabled, momentum confirmation disabled for fastest signals.
- Day Trading Preset: RSI(6, 9, 14) with light smoothing. Momentum confirmation enabled for better signal quality.
- Swing Trading Preset: RSI(14, 14, 21) with moderate smoothing. Balanced configuration for medium-term trades.
- Position Trading Preset: RSI(24, 21, 28) with heavier smoothing. Optimized for longer-term positions with all filters active.
- Custom Mode: Full manual control over all settings. Default behavior matches previous script versions.
Presets automatically configure RSI periods, smoothing lengths, and filter settings. You can still manually adjust any setting after selecting a preset if needed.
Getting Started: The easiest way to get started is to select a configuration preset matching your trading style (Scalping, Day Trading, Swing Trading, or Position Trading) from the "Configuration Preset" dropdown. This instantly configures all settings for optimal performance. Alternatively, use "Custom" mode for full manual control. The default configuration (Custom mode) shows RSI(6), RSI(14), and RSI(24) with their default smoothing. Overbought/oversold fill zones are enabled by default.
Customizing RSI Periods: Adjust the RSI lengths (6, 14, 24) based on your trading timeframe. Shorter periods (6) for scalping, standard (14) for day trading, longer (24) for swing trading. You can disable any RSI period you don't need.
Smoothing Selection: Choose smoothing method based on your needs. EMA provides balanced smoothing, RMA (Wilder's) is traditional, Zero-Lag reduces lag but may increase noise. Adjust smoothing lengths individually or use global smoothing for consistency. Note: Smoothing lengths are automatically validated to ensure they are always less than the corresponding RSI period length. If you set smoothing >= RSI length, it will be auto-adjusted to prevent invalid configurations.
Dynamic OB/OS: The dynamic thresholds automatically adapt to volatility. Adjust the volatility multiplier and base percentage to fine-tune sensitivity. Higher values create wider thresholds in volatile markets.
Volume Confirmation: Set volume threshold to 1.2 (default) for standard confirmation, higher for stricter filtering, or 0.1 to disable volume filtering entirely.
Multi-RSI Synergy: Use "ALL" mode for highest-quality signals (all 3 RSIs must align), or "2-of-3" mode for more frequent signals. Adjust the reset period to control signal frequency.
Filters: Enable filters gradually to find your preferred balance. Start with volume confirmation, then add trend filter, then ADX for strongest confirmation. RSI(50) filter is useful for momentum-based strategies and is recommended for noise reduction. Momentum confirmation and multi-timeframe confirmation add additional layers of accuracy but may reduce signal frequency.
Noise Reduction: The noise reduction system is enabled by default with balanced settings. Adjust minSignalStrength (default 3.0) to control how far RSI must be from centerline. Increase requireConsecutiveBars (default 1) to require signals to persist longer. Enable requireZonePersistence and requireRsiSlope for stricter filtering (higher quality but fewer signals). Start with defaults and adjust based on your needs.
Divergence: Enable divergence detection and adjust lookback periods. Strong divergence (with engulfing confirmation) provides higher-quality signals. Hidden divergence is useful for trend-following strategies. Enable pivot-based divergence for more accurate detection using actual pivot points instead of simple lowest/highest comparisons. Pivot-based divergence uses tolerance-based matching (1% for price, 1.0 RSI point for RSI) for better accuracy.
Forecasting: Enable regression forecasting to see potential RSI direction. Linear regression is simplest, polynomial captures curves, exponential smoothing adapts to trends. Adjust horizon based on your trading timeframe. Confidence bands show forecast uncertainty - wider bands indicate less reliable forecasts.
Pivot Trendlines: Enable pivot trendlines to visualize RSI trends and identify trend breaks. Adjust pivot detection period (default 5) - higher values detect fewer but stronger pivots. Enable pivot confirmation (default ON) to reduce repainting. Set minPivotStrength (default 1.0) to filter weak pivots - lower values detect more pivots (more trendlines), higher values detect only stronger pivots (fewer trendlines). Enable "Keep Historical Trendlines" to preserve multiple trendlines instead of just the most recent one. Set "Max Trendlines to Keep" (default 5) to control how many historical trendlines are preserved. Enable trend break confirmation for more reliable break signals. Adjust minTrendlineAngle (default 0.0) to filter flat trendlines - set to 0.1-0.5 to exclude weak trendlines.
Alerts: Set up alerts for your preferred signal types. Enable cooldown to prevent alert spam. Each signal type has its own alert condition, so you can be selective about which signals trigger alerts.
Visual Elements and Signal Markers
The script uses various visual markers to indicate signals and conditions:
- "sBottom" label (green): Strong bottom signal - RSI at extreme low with strong buy conditions
- "sTop" label (red): Strong top signal - RSI at extreme high with strong sell conditions
- "SyBuy" label (lime): Multi-RSI synergy buy signal - all RSIs aligned oversold
- "SySell" label (red): Multi-RSI synergy sell signal - all RSIs aligned overbought
- 🐂 emoji (green): Strong bullish divergence detected
- 🐻 emoji (red): Strong bearish divergence detected
- 🔆 emoji: Weak divergence signals (if enabled)
- "H-Bull" label: Hidden bullish divergence
- "H-Bear" label: Hidden bearish divergence
- ⚡ marker (top of pane): Volume climax detected (extreme volume) - positioned at top for visibility
- 💧 marker (top of pane): Volume dry-up detected (very low volume) - positioned at top for visibility
- ↑ triangle (lime): Uptrend break signal - RSI breaks below uptrend line
- ↓ triangle (red): Downtrend break signal - RSI breaks above downtrend line
- Triangle up (lime): RSI(50) bullish crossover
- Triangle down (red): RSI(50) bearish crossover
- Circle markers: RSI period crossovers
All markers are positioned at the RSI value where the signal occurs, using location.absolute for precise placement.
Signal Priority and Interpretation
Signals are generated independently and can occur simultaneously. Higher-priority signals generally indicate stronger setups:
1. Multi-RSI Synergy signals (SyBuy/SySell) - Highest priority: Requires alignment across all RSI periods plus volume and filter confirmation. These are the most reliable signals.
2. Strong Top/Bottom signals (sTop/sBottom) - High priority: Indicates extreme RSI levels with strong bounce conditions. Requires volume confirmation and all filters.
3. Divergence signals - Medium-High priority: Strong divergence (with engulfing) is more reliable than regular divergence. Hidden divergence indicates continuation rather than reversal.
4. Adaptive RSI crossovers - Medium priority: Buy when adaptive RSI crosses below dynamic oversold, sell when it crosses above dynamic overbought. These use volatility-adjusted RSI for more accurate signals.
5. RSI(50) centerline crossovers - Medium priority: Momentum shift signals. Less reliable alone but useful when combined with other confirmations.
6. RSI period crossovers - Lower priority: Early momentum shift indicators. Can provide early warning but may produce false signals in choppy markets.
Best practice: Wait for multiple confirmations. For example, a synergy signal combined with divergence and volume climax provides the strongest setup.
Chart Requirements
For proper script functionality and compliance with TradingView requirements, ensure your chart displays:
- Symbol name: The trading pair or instrument name should be visible
- Timeframe: The chart timeframe should be clearly displayed
- Script name: "Ultimate RSI " should be visible in the indicator title
These elements help traders understand what they're viewing and ensure proper script identification. The script automatically includes this information in the indicator title and chart labels.
Performance Considerations
The script is optimized for performance:
- ATR and Volume SMA are cached using var variables, updating only on confirmed and real-time bars to reduce redundant calculations
- Forecast line arrays are dynamically managed: lines are reused when possible, and unused lines are deleted to prevent memory accumulation
- Calculations use efficient Pine Script functions (ta.rsi, ta.ema, etc.) which are optimized by TradingView
- Array operations are minimized where possible, with direct calculations preferred
- Polynomial regression automatically caps the forecast horizon at 20 bars (POLYNOMIAL_MAX_HORIZON constant) to prevent performance degradation, as polynomial regression has O(n³) complexity. This safeguard ensures optimal performance even with large horizon settings
- Pivot detection includes edge case handling to ensure reliable calculations even on early bars with limited historical data. Regression forecasting functions include comprehensive safety checks: horizon validation (must not exceed array size), empty array handling, edge case handling for horizon=1 scenarios, and division-by-zero protection in all mathematical operations
The script should perform well on all timeframes. On very long historical data, forecast lines may accumulate if the horizon is large; consider reducing the forecast horizon if you experience performance issues. The polynomial regression performance safeguard automatically prevents performance issues for that specific regression type.
Known Limitations and Considerations
- Forecast lines are forward-looking projections and should not be used as definitive predictions. They provide context but are not guaranteed to be accurate.
- Dynamic OB/OS thresholds can exceed 100 or go below 0 in extreme volatility scenarios, but are clamped to 0-100 range. This means in very volatile markets, the dynamic thresholds may not widen as much as the raw calculation suggests.
- Volume confirmation requires sufficient historical volume data. On new instruments or very short timeframes, volume calculations may be less reliable.
- Higher timeframe RSI uses request.security() which may have slight delays on some data feeds.
- Regression forecasting requires at least N bars of history (where N = forecast horizon) before it can generate forecasts. Early bars will not show forecast lines.
- StochRSI calculation requires the selected RSI source to have sufficient history. Very short RSI periods on new charts may produce less reliable StochRSI values initially.
Practical Use Cases
The indicator can be configured for different trading styles and timeframes:
Swing Trading: Select the "Swing Trading" preset for instant optimal configuration. This preset uses RSI periods (14, 14, 21) with moderate smoothing. Alternatively, manually configure: Use RSI(24) with Multi-RSI Synergy in "ALL" mode, combined with trend filter (EMA 200) and ADX filter. This configuration provides high-probability setups with strong confirmation across multiple RSI periods.
Day Trading: Select the "Day Trading" preset for instant optimal configuration. This preset uses RSI periods (6, 9, 14) with light smoothing and momentum confirmation enabled. Alternatively, manually configure: Use RSI(6) with Zero-Lag smoothing for fast signal detection. Enable volume confirmation with threshold 1.2-1.5 for reliable entries. Combine with RSI(50) filter to ensure momentum alignment. Strong top/bottom signals work well for day trading reversals.
Trend Following: Enable trend filter (EMA) and EMA slope filter for strong trend confirmation. Use RSI(14) or RSI(24) with ADX filter to avoid choppy markets. Hidden divergence signals are useful for trend continuation entries.
Reversal Trading: Focus on divergence detection (regular and strong) combined with strong top/bottom signals. Enable volume climax detection to identify capitulation moments. Use RSI(6) for early reversal signals, confirmed by RSI(14) and RSI(24).
Forecasting and Planning: Enable regression forecasting with polynomial or exponential smoothing methods. Use forecast horizon of 10-20 bars for swing trading, 5-10 bars for day trading. Confidence bands help assess forecast reliability.
Multi-Timeframe Analysis: Enable higher timeframe RSI to see context from larger timeframes. For example, use daily RSI on hourly charts to understand the larger trend context. This helps avoid counter-trend trades.
Scalping: Select the "Scalping" preset for instant optimal configuration. This preset uses RSI periods (4, 7, 9) with minimal smoothing, disables noise reduction, and disables momentum confirmation for faster signals. Alternatively, manually configure: Use RSI(6) with minimal smoothing (or Zero-Lag) for ultra-fast signals. Disable most filters except volume confirmation. Use RSI period crossovers (RSI(6) × RSI(14)) for early momentum shifts. Set volume threshold to 1.0-1.2 for less restrictive filtering.
Position Trading: Select the "Position Trading" preset for instant optimal configuration. This preset uses extended RSI periods (24, 21, 28) with heavier smoothing, optimized for longer-term trades. Alternatively, manually configure: Use RSI(24) with all filters enabled (Trend, ADX, RSI(50), Volume Dry-Up avoidance). Multi-RSI Synergy in "ALL" mode provides highest-quality signals.
Practical Tips and Best Practices
Getting Started: The fastest way to get started is to select a configuration preset that matches your trading style. Simply choose "Scalping", "Day Trading", "Swing Trading", or "Position Trading" from the "Configuration Preset" dropdown to instantly configure all settings optimally. For advanced users, use "Custom" mode for full manual control. The default configuration (Custom mode) is balanced and works well across different markets. After observing behavior, customize settings to match your trading style.
Reducing Repainting: All signals are based on confirmed bars, minimizing repainting. The script uses confirmed bar data for all calculations to ensure backtesting accuracy.
Signal Quality: Multi-RSI Synergy signals in "ALL" mode provide the highest-quality signals because they require alignment across all three RSI periods. These signals have lower frequency but higher reliability. For more frequent signals, use "2-of-3" mode. The noise reduction system further improves signal quality by requiring multiple confirmations (signal strength, extreme zone, consecutive bars, optional zone persistence and RSI slope). Adjust noise reduction settings to balance signal frequency vs. accuracy.
Filter Combinations: Start with volume confirmation, then add trend filter for trend alignment, then ADX filter for trend strength. Combining all three filters significantly reduces false signals but also reduces signal frequency. Find your balance based on your risk tolerance.
Volume Filtering: Set volume threshold to 0.1 or lower to effectively disable volume filtering if you trade instruments with unreliable volume data or want to test without volume confirmation. Standard confirmation uses 1.2-1.5 threshold.
RSI Period Selection: RSI(6) is most sensitive and best for scalping or early signal detection. RSI(14) provides balanced signals suitable for day trading. RSI(24) is smoother and better for swing trading and trend confirmation. You can disable any RSI period you don't need to reduce visual clutter.
Smoothing Methods: EMA provides balanced smoothing with moderate lag. RMA (Wilder's smoothing) is traditional and works well for RSI. Zero-Lag reduces lag but may increase noise. WMA gives more weight to recent values. Choose based on your preference for responsiveness vs. smoothness.
Forecasting: Linear regression is simplest and works well for trending markets. Polynomial regression captures curves and works better in ranging markets. Exponential smoothing adapts to trends. Moving average method is most conservative. Use confidence bands to assess forecast reliability.
Divergence: Strong divergence (with engulfing confirmation) is more reliable than regular divergence. Hidden divergence indicates continuation rather than reversal, useful for trend-following strategies. Pivot-based divergence provides more accurate detection by using actual pivot points instead of simple lowest/highest comparisons. Adjust lookback periods based on your timeframe: shorter for day trading, longer for swing trading. Pivot divergence period (default 5) controls the sensitivity of pivot detection.
Dynamic Thresholds: Dynamic OB/OS thresholds automatically adapt to volatility. In volatile markets, thresholds widen; in calm markets, they narrow. Adjust the volatility multiplier and base percentage to fine-tune sensitivity. Higher values create wider thresholds in volatile markets.
Alert Management: Enable alert cooldown (default 10 bars, recommended) to prevent alert spam. Each alert type has its own cooldown, so you can set different cooldowns for different signal types. For example, use shorter cooldown for synergy signals (high quality) and longer cooldown for crossovers (more frequent). The cooldown system works independently for each signal type, preventing spam while allowing different signal types to fire when appropriate.
Technical Specifications
- Pine Script Version: v6
- Indicator Type: Non-overlay (displays in separate panel below price chart)
- Repainting Behavior: Minimal - all signals are based on confirmed bars, ensuring accurate backtesting results
- Performance: Optimized with caching for ATR and volume calculations. Forecast arrays are dynamically managed to prevent memory accumulation.
- Compatibility: Works on all timeframes (1 minute to 1 month) and all instruments (stocks, forex, crypto, futures, etc.)
- Edge Case Handling: All calculations include safety checks for division by zero, NA values, and boundary conditions. Reset conditions and alert cooldowns handle edge cases where conditions never occurred or values are NA.
- Reset Logic: Separate reset conditions for buy signals (based on bottom conditions) and sell signals (based on top conditions) ensure logical correctness.
- Input Parameters: 60+ customizable parameters organized into logical groups for easy configuration. Configuration presets available for instant setup (Scalping, Day Trading, Swing Trading, Position Trading, Custom).
- Noise Reduction: Comprehensive noise reduction system with multiple filters (signal strength, extreme zone, consecutive bars, zone persistence, RSI slope) to reduce false signals.
- Pivot-Based Divergence: Enhanced divergence detection using actual pivot points for improved accuracy.
- Momentum Confirmation: RSI momentum filter ensures signals only fire when RSI is accelerating in the signal direction.
- Multi-Timeframe Confirmation: Optional higher timeframe RSI alignment for trend confirmation.
- Enhanced Pivot Trendlines: Trendline drawing with strength requirements, confirmation, and trend break detection.
Technical Notes
- All RSI values are clamped to 0-100 range to ensure valid oscillator values
- ATR and Volume SMA are cached for performance, updating on confirmed and real-time bars
- Reset conditions handle edge cases: if a condition never occurred, reset returns true (allows first signal)
- Alert cooldown handles na values: if no previous alert, cooldown allows the alert
- Forecast arrays are dynamically sized based on horizon, with unused lines cleaned up
- Fill logic uses a minimum gap (0.1) to ensure reliable polygon rendering in TradingView
- All calculations include safety checks for division by zero and boundary conditions. Regression functions validate that horizon doesn't exceed array size, and all array access operations include bounds checking to prevent out-of-bounds errors
- The script uses separate reset conditions for buy signals (based on bottom conditions) and sell signals (based on top conditions) for logical correctness
- Background coloring uses a fallback system: dynamic color takes priority, then RSI(6) heatmap, then monotone if both are disabled
- Noise reduction filters are applied after accuracy filters, providing multiple layers of signal quality control
- Pivot trendlines use strength requirements to filter weak pivots, reducing noise in trendline drawing. Historical trendlines are stored in arrays and automatically limited to prevent memory accumulation when "Keep Historical Trendlines" is enabled
- Volume climax and dry-up markers are positioned at the top of the pane for better visibility
- All calculations are optimized with conditional execution - features only calculate when enabled (performance optimization)
- Input Validation: Automatic cross-input validation ensures smoothing lengths are always less than RSI period lengths, preventing configuration errors
- Configuration Presets: Four optimized preset configurations (Scalping, Day Trading, Swing Trading, Position Trading) for instant setup, plus Custom mode for full manual control
- Constants Management: Magic numbers extracted to documented constants for improved maintainability and easier tuning (pivot tolerance, divergence thresholds, fill gap, etc.)
- TradingView Function Consistency: All TradingView functions (ta.crossover, ta.crossunder, ta.atr, ta.lowest, ta.highest, ta.lowestbars, ta.highestbars, etc.) and custom functions that depend on historical results (f_consecutiveBarConfirmation, f_rsiSlopeConfirmation, f_rsiZonePersistence, f_applyAllFilters, f_rsiMomentum, f_forecast, f_confirmPivotLow, f_confirmPivotHigh) are called on every bar for consistency, as recommended by TradingView. Results are then used conditionally when needed. This ensures consistent calculations and prevents calculation inconsistencies.

Algoticks.in: RSI StrategyRSI Strategy - User Guide
Overview
This is a Relative Strength Index (RSI) strategy that generates trading signals based on overbought and oversold levels. It integrates with Algoticks.in API for automated trading on Delta Exchange.
Strategy Logic
Long Signal: When RSI crosses above the Oversold level (Mean Reversion / Dip Buy)
Short Signal: When RSI crosses below the Overbought level (Mean Reversion / Top Sell)
Automatically closes opposite positions before entering new ones
Quick Setup
1. Add to TradingView
Open TradingView and go to the chart
Click "Pine Editor" at the bottom
Paste the script code
Click "Add to Chart"
2. Configure Strategy Parameters
Strategy Settings
RSI Length (default: 14): The lookback period for RSI calculation
Overbought Level (default: 70): Level above which the asset is considered overbought
Oversold Level (default: 30): Level below which the asset is considered oversold
General API Settings
Paper Trading : Enable for testing without real money
Signal Type : Choose "Trading Signal" (default) for tracking
Exchange : DELTA (Delta Exchange)
Segment :
futures - Perpetual contracts
options - Call/Put options
spot - Spot trading
Order Settings: Basic
Quantity : Number of contracts (e.g., 1, 0.5, 2)
Validity :
GTC - Good Till Cancelled
IOC - Immediate or Cancel
FOK - Fill or Kill
DAY - Day order
Product : cross_margin or isolated_margin
Order Settings: Entry Type
Choose how orders are executed:
Market Order : Immediate fill at best price
Limit Order : Fill at specified price or better
Stop Market : Triggers at stop price, then market order
Stop Limit : Triggers at stop price, then limit order
Entry Prices (for Limit/Stop orders)
Limit Price:
Price : The value to use
Type : Last Price / Mark Price / Index Price
Mode :
Absolute - Exact price (e.g., 65000)
Relative - Offset from entry price
% Checkbox : If checked, relative uses percentage; if unchecked, uses points
Example:
Absolute: 65000 → Order at exactly 65000
Relative 1% (checked): Entry ± 1% of entry price
Relative 100 (unchecked): Entry ± 100 points
Trigger Price: Same logic as Limit Price, used for Stop orders
Exit / Bracket Prices (SL/TP)
Stop Loss (SL):
Type : Price type to monitor (Mark Price recommended)
Mode : Absolute or Relative
% : Percentage or points
SL : Stop loss value (e.g., 2 for 2%)
Trig : Optional trigger price (creates Stop-Limit SL)
Take Profit (TP): Same structure as SL
Example:
Long entry at 65000, SL = 2% → Exit at 63700 (65000 - 2%)
Short entry at 65000, TP = 3% → Exit at 63050 (65000 - 3%)
3. Options Trading Setup (Only if Segment = Options)
Strike Selection Method
User Defined Mode:
Manually specify exact strike and option type
Best for: Trading specific levels
Required fields:
Strike Price : e.g., "65000"
Option Type : Call or Put
Dynamic Mode:
System calculates strike based on ATM price
Best for: Automated strategies
Required fields:
Algo Type : Options Buying or Selling
Strike Offset : 0 (ATM), +1 (above ATM), -1 (below ATM)
Strike Interval : Gap between strikes (e.g., BTC: 500, ETH: 50)
Expiry Date Formats:
T+0 - Today
T+1 - Tomorrow
current week - This Friday
next week - Next Friday
current month - Last Friday of month
131125 - Specific date (13 Nov 2025)
4. Create Alert for Automation
Right-click on chart → "Add Alert"
Condition : Select your strategy name
Alert Actions : Webhook URL
Webhook URL : Your Algoticks.in API endpoint
Message : Leave as {{strategy.order.alert_message}} (contains JSON)
Click "Create"
The alert will automatically send JSON payloads to your API when signals occur.
Example Configurations
Standard RSI Reversal
Strategy: RSI Length = 14, OB = 70, OS = 30
Segment: futures
Order Type: market_order
Quantity: 1
SL: 1.5% (Relative)
TP: 3% (Relative)
Aggressive Scalping
Strategy: RSI Length = 7, OB = 80, OS = 20
Segment: futures
Order Type: market_order
Quantity: 0.5
SL: 0.5% (Relative)
TP: 1% (Relative)
Important Notes
Paper Trading First : Always test with paper trading enabled before live trading
Order Tags : Automatically generated for tracking (max 18 chars)
Position Management : Strategy closes opposite positions automatically
Signal Confirmation : Uses barstate.isconfirmed to prevent repainting
JSON Payload : All settings are converted to JSON and sent via webhook
Troubleshooting
No signals : Check if RSI is actually reaching your OB/OS levels
Orders not executing : Verify webhook URL and API credentials
Wrong strikes : Double-check Strike Interval for your asset
SL/TP not working : Ensure values are non-zero and mode is correct
Support
For API setup and connector configuration, visit Algoticks.in documentation.

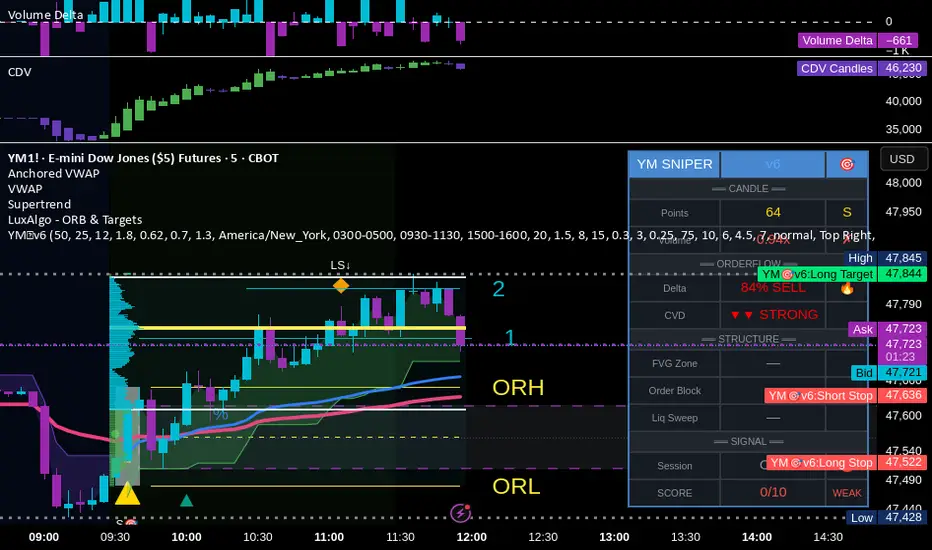
YM Ultimate SNIPER v6# YM Ultimate SNIPER v6 - Documentation & Trading Guide
## 🎯 ORDERFLOW EDITION | Order Blocks + Liquidity Sweeps + IFVG
**TARGET: 3-7 High-Confluence Trades per Day**
**Philosophy: "Zones That Matter"**
---
## ⚡ WHAT'S NEW IN v6
### Major Additions
| Feature | Description | Orderflow Purpose |
|---------|-------------|-------------------|
| **Order Blocks** | Last opposing candle before significant move | Shows where institutions absorbed orders |
| **Liquidity Sweeps** | Sweep of swing H/L with rejection | Identifies stop hunts / trap reversals |
| **IFVG** | Inverse FVG when price reclaims a gap | Failed institutional move = reversal signal |
| **Zone Quality Score** | 0-10 rating for each zone | Only "zones that matter" display |
| **3-Tier Scoring** | Weak/Medium/Excellent classification | Better trade selection |
| **Enhanced Table** | Larger, categorized, color-coded | Instant situation awareness |
### Orderflow Mindset
This version is built around **institutional order flow concepts**:
1. **Institutions leave footprints** → Order Blocks mark where they filled orders
2. **Retail gets trapped** → Liquidity Sweeps show the trap before reversal
3. **Failed moves reverse hard** → IFVG marks failed institutional attempts
4. **Not all zones are equal** → Quality scoring filters noise
---
## 🎯 QUICK REFERENCE
```
┌─────────────────────────────────────────────────────────────────────────┐
│ YM ULTIMATE SNIPER v6 │
├─────────────────────────────────────────────────────────────────────────┤
│ │
│ SIGNALS: │
│ S🎯 = S-Tier (50+ pts) → HOLD position │
│ A🎯 = A-Tier (25-49 pts) → SWING trade │
│ B🎯 = B-Tier (12-24 pts) → SCALP quick │
│ Z = Zone entry (quality FVG/OB zone) │
│ LS↑ = Bullish Liquidity Sweep (lows swept + rejection) │
│ LS↓ = Bearish Liquidity Sweep (highs swept + rejection) │
│ │
│ ZONES: │
│ 🟦 Blue boxes = Bullish Order Block (buy zone) │
│ 🟪 Pink boxes = Bearish Order Block (sell zone) │
│ 🟩 Green boxes = Bullish FVG (buy zone) │
│ 🟥 Red boxes = Bearish FVG (sell zone) │
│ 🟣 Purple dashed = IFVG (inverse - strong reversal zone) │
│ │
│ SCORE CLASSIFICATION: │
│ EXCELLENT (7.0+) = Full size, high confidence │
│ MEDIUM (4.5-6.9) = Standard size, good setup │
│ WEAK (<4.5) = No signal shown │
│ │
│ SESSIONS (ET): │
│ LDN = 3:00-5:00 AM (London) │
│ NY = 9:30-11:30 AM (New York Open) │
│ PWR = 3:00-4:00 PM (Power Hour) │
│ │
└─────────────────────────────────────────────────────────────────────────┘
```
---
## 📦 ORDER BLOCKS (OB)
### What Are Order Blocks?
Order blocks mark the **last opposing candle before a significant move**. This is where institutional traders absorbed retail orders before moving price in their intended direction.
### Detection Logic (Breaker Style)
```
BULLISH OB:
├── Last BEARISH candle before strong bullish move
├── Move after must be ≥ 1.5x ATR
├── Shows where institutions absorbed selling
└── Expect support when price returns
BEARISH OB:
├── Last BULLISH candle before strong bearish move
├── Move after must be ≥ 1.5x ATR
├── Shows where institutions absorbed buying
└── Expect resistance when price returns
```
### OB Quality Scoring
Each Order Block gets a strength score (0-10) based on:
- **Move strength** after the OB (ATR multiple)
- **Volume** on the OB candle
- **Body ratio** of the OB candle
Only OBs with strength ≥ 4 are displayed.
### Trading Order Blocks
| Scenario | Action |
|----------|--------|
| Price returns to Bull OB + buy delta | Look for LONG |
| Price returns to Bear OB + sell delta | Look for SHORT |
| OB + FVG overlap (thick border) | HIGH PROBABILITY |
| OB tested once (gray) | Still valid, often best entry |
| OB broken (closes through) | Invalidated, removed |
---
## 💎 LIQUIDITY SWEEPS
### What Are Liquidity Sweeps?
A liquidity sweep occurs when price **hunts stop losses** by briefly breaking a swing high/low, then **immediately reverses** back. This is the classic "stop hunt" or "liquidity grab."
### Detection Logic
```
BULLISH SWEEP (LS↑):
├── Price sweeps BELOW a recent swing low
├── Closes BACK ABOVE the swing level
├── Shows lower wick (rejection)
├── Buy delta dominance on the candle
└── SIGNAL: Lows swept, shorts trapped → GO LONG
BEARISH SWEEP (LS↓):
├── Price sweeps ABOVE a recent swing high
├── Closes BACK BELOW the swing level
├── Shows upper wick (rejection)
├── Sell delta dominance on the candle
└── SIGNAL: Highs swept, longs trapped → GO SHORT
```
### Why Sweeps Matter for Orderflow
1. **Retail stops get hit** → Liquidity provided to institutions
2. **Institutions fill orders** → At better prices thanks to the sweep
3. **Price reverses** → Move in intended direction begins
4. **You enter with institutions** → Not against them
### Sweep + Zone = High Probability
When a liquidity sweep happens AT or NEAR an Order Block or FVG zone, the probability increases significantly.
---
## 🔄 IFVG (INVERSE FVG)
### What Is an IFVG?
An Inverse FVG forms when price **fills an FVG and then reclaims it** in the opposite direction. This signals a **failed institutional move**.
### Detection Logic
```
BULLISH IFVG:
├── Bearish FVG was created (gap down)
├── Price fills the gap (tests zone)
├── Price CLOSES ABOVE the gap with buy delta
└── SIGNAL: Bears failed → Strong reversal UP
BEARISH IFVG:
├── Bullish FVG was created (gap up)
├── Price fills the gap (tests zone)
├── Price CLOSES BELOW the gap with sell delta
└── SIGNAL: Bulls failed → Strong reversal DOWN
```
### Why IFVG Is Powerful
- Shows institutional failure → Other side takes control
- Pre-assigned quality score of 8.0 (high priority)
- Often marks significant reversals
- Purple dashed boxes for easy identification
---
## 📊 ZONE QUALITY SCORING
### The "Zones That Matter" Filter
Not all FVGs and OBs are created equal. v6 implements a **Zone Quality Score** (0-10) that filters out low-quality zones.
### Quality Calculation
| Factor | Max Points | How Measured |
|--------|------------|--------------|
| Gap Size | 2.5 | Larger gap = more points |
| Impulse Strength | 2.5 | Stronger move = more points |
| Volume | 2.0 | Higher volume = more points |
| OB Alignment | 2.0 | FVG overlaps with OB = bonus |
| Session | 1.0 | Created in active session = bonus |
### Min Quality Threshold (Default: 6.0)
Zones scoring below this threshold **are not displayed**. Adjust in settings:
- **Conservative**: Set to 7.0+ (fewer, better zones)
- **Standard**: 6.0 (balanced)
- **Aggressive**: 4.0-5.0 (more zones, more noise)
### Visual Quality Indicators
- **Thick border**: Zone aligns with Order Block (high quality)
- **Bright color**: Fresh zone
- **Gray color**: Tested zone (still valid)
- **Removed**: Broken zone (invalidated)
---
## 📊 CONFLUENCE SCORING SYSTEM
### Score Components (Max ~12, normalized to 10)
| Factor | Points | Condition |
|--------|--------|-----------|
| **Tier** | 1-3 | B=1, A=2, S=3 |
| **FVG Zone** | +1.5 | Price in quality FVG |
| **Order Block** | +1.5 | Price in OB |
| **IFVG** | +1.0 | Price in Inverse FVG |
| **Strong Volume** | +1.0 | Volume ≥ 2x average |
| **Extreme Volume** | +0.5 | Volume ≥ 2.5x average |
| **Strong Delta** | +1.0 | Delta ≥ 70% |
| **Extreme Delta** | +0.5 | Delta ≥ 78% |
| **CVD Momentum** | +0.5-1.0 | CVD trending with signal |
| **Liquidity Sweep** | +1.5 | Recent sweep confirms direction |
### Score Classification
| Score | Class | Confidence | Position Size |
|-------|-------|------------|---------------|
| **7.0+** | EXCELLENT | Very High | Full size (100%) |
| **4.5-6.9** | MEDIUM | Good | Standard (75%) |
| **< 4.5** | WEAK | Low | No signal shown |
### Score Displayed in Table
The table shows both the numeric score and classification:
- Green background + "EXCELLENT" = Top tier setup
- Orange background + "MEDIUM" = Decent setup
- Gray + "WEAK" = Below threshold
---
## 📊 ENHANCED TABLE REFERENCE
The v6 table is organized into **4 sections**:
### CANDLE Section
| Row | What It Shows |
|-----|---------------|
| Points | Candle range in points + Tier (S/A/B/X) |
| Volume | Volume ratio + grade (🔥/✓✓/✓/✗) |
### ORDERFLOW Section
| Row | What It Shows |
|-----|---------------|
| Delta | Buy/Sell % + grade (🔥/✓✓/✓/—) |
| CVD | Direction + strength (▲▲ STRONG, ▲ UP, etc.) |
### STRUCTURE Section
| Row | What It Shows |
|-----|---------------|
| FVG Zone | Current zone status + quality score |
| Order Block | OB status (BULL OB / BEAR OB / —) |
| Liq Sweep | Recent sweep status + 🎯 indicator |
### SIGNAL Section
| Row | What It Shows |
|-----|---------------|
| Session | Current session (NY/LDN/PWR/OFF) + 🟢/🔴 |
| SCORE | Numeric score /10 + classification |
### Color Coding
- **🟢 Green/Lime**: Good, meets threshold, bullish
- **🟠 Orange/Amber**: Caution, borderline, medium
- **🔴 Red**: Bad, below threshold, bearish
- **⚪ Gray**: Inactive/neutral
- **🔥**: Extreme/exceptional reading
---
## ✅ ENTRY CHECKLIST v6
Before entering any trade:
### Basic Requirements
- Signal present (S🎯/A🎯/B🎯 or Z)
- Score ≥ 4.5 (MEDIUM or better)
- Session active (LDN/NY/PWR shows 🟢)
### Orderflow Confirmation
- Delta colored (not gray)
- CVD arrow matches direction
- Volume shows ✓ or better
### Structure Bonus (Any = Better)
- In FVG Zone
- In Order Block
- Recent Liquidity Sweep
- IFVG present
### Execute
- Enter at signal candle close
- Stop below/above candle (shown on chart)
- Target at calculated R:R level
---
## 🎯 IDEAL SETUPS (HIGH WIN RATE)
### Setup 1: Sweep + Zone + Tier
```
Conditions:
├── Liquidity Sweep just occurred (LS↑ or LS↓)
├── Price is at Order Block or FVG
├── Tier signal fires (S/A/B)
├── Score: 7+ EXCELLENT
└── Win Rate: ~75-85%
```
### Setup 2: IFVG + Delta Confirmation
```
Conditions:
├── IFVG just formed (purple zone)
├── Strong delta (70%+) in IFVG direction
├── CVD confirming
├── Score: 7+ EXCELLENT
└── Win Rate: ~70-80%
```
### Setup 3: OB + FVG Overlap
```
Conditions:
├── Order Block present
├── FVG zone overlaps with OB (thick border)
├── Price returns to overlap zone
├── Delta confirms direction
└── Win Rate: ~70-78%
```
### Setup 4: Clean Zone Entry
```
Conditions:
├── Quality zone (score 6+)
├── No tier signal but Z entry shows
├── Delta matches zone direction
├── In active session
└── Win Rate: ~65-72%
```
---
## ⛔ DO NOT TRADE
- Session shows "OFF" or 🔴
- Score < 4.5 (WEAK)
- Delta shows "—" (no dominance)
- CVD conflicts with signal direction
- Multiple conflicting zones
- Zone quality < 6
- Major news imminent (FOMC, NFP, CPI)
- Price chopping between zones
---
## 🔧 SETTINGS GUIDE
### Recommended Configurations
**Conservative (2-4 trades/day):**
```
Min Score Medium: 5.5
Min Score Excellent: 7.5
Min Zone Quality: 7.0
Min Volume Ratio: 2.0
Delta Threshold: 65%
```
**Standard (4-6 trades/day):**
```
Min Score Medium: 4.5
Min Score Excellent: 7.0
Min Zone Quality: 6.0
Min Volume Ratio: 1.8
Delta Threshold: 62%
```
**Aggressive (6-8 trades/day):**
```
Min Score Medium: 4.0
Min Score Excellent: 6.5
Min Zone Quality: 5.0
Min Volume Ratio: 1.5
Delta Threshold: 60%
```
---
## 🚨 ALERTS PRIORITY
### Must-Have Alerts
| Alert | Priority | Action |
|-------|----------|--------|
| ⭐ EXCELLENT LONG/SHORT | 🔴 CRITICAL | Drop everything, check NOW |
| 🎯 S-TIER | 🟠 HIGH | Evaluate within 10 seconds |
| 💎 LIQUIDITY SWEEP | 🟠 HIGH | Check for zone confluence |
| 🔄 IFVG | 🟡 MEDIUM | Note reversal potential |
### Useful Context Alerts
| Alert | Purpose |
|-------|---------|
| 📦 NEW OB | Mark institutional zone |
| 📦 NEW FVG | Mark gap zone |
| SESSION OPEN | Prepare to trade |
---
## 📈 TRADE JOURNAL v6
```
DATE: ___________
SESSION: ☐ LDN ☐ NY ☐ PWR
SETUP TYPE:
☐ Sweep + Zone ☐ IFVG ☐ OB+FVG ☐ Zone Entry
TRADE:
├── Time: _______
├── Signal: S🎯 / A🎯 / B🎯 / Z / LS
├── Direction: LONG / SHORT
├── Score: ___/10 (EXCELLENT / MEDIUM)
├── Entry: _______
├── Stop: _______
├── Target: _______
│
├── In FVG Zone: ☐ Yes ☐ No
├── In Order Block: ☐ Yes ☐ No
├── Liquidity Sweep: ☐ Yes ☐ No
├── IFVG Present: ☐ Yes ☐ No
│
├── Result: +/- ___ pts ($_____)
└── Notes: _______________________
DAILY SUMMARY:
├── Trades: ___
├── EXCELLENT setups: ___
├── MEDIUM setups: ___
├── Wins: ___ | Losses: ___
├── Net P/L: $_____
└── Best setup type: _______________________
```
---
## 🏆 GOLDEN RULES v6
> **"Institutions sweep, then move. Wait for the sweep."**
> **"Order Blocks show where they filled. Trade there."**
> **"IFVG = They failed. Take the other side."**
> **"Zone Quality 6+ or walk away."**
> **"EXCELLENT score = Green light. MEDIUM = Yellow light. WEAK = Red light."**
> **"Confluence beats conviction. Stack the factors."**
> **"Leave every trade with money. The next setup is coming."**
---
## 🔧 TROUBLESHOOTING
| Issue | Solution |
|-------|----------|
| No signals | Lower Min Score Medium to 4.0 |
| Too many signals | Raise Min Score Medium to 5.5+ |
| Too many zones | Raise Min Zone Quality to 7.0+ |
| Zones cluttering | Reduce Max Zones to 6-8 |
| OBs everywhere | Raise OB Min Strength to 1.8+ |
| Missing sweeps | Lower Sweep Lookback, reduce Min Wick Ratio |
| Table too small | Change Table Size to "large" |
| Wrong timezone | Check Session Timezone setting |
---
## 📝 TECHNICAL NOTES
- **Pine Script v6** (latest syntax)
- **Works on**: YM, MYM, NQ, MNQ, ES, MES, GC, MGC
- **Auto-detects** instrument for proper point calculation
- **Recommended TF**: 1-5 minute for day trading
- **Min TradingView Plan**: Free (no premium features required)
- **Max visual elements**: 500 labels, 500 boxes, 500 lines
---
*© Alexandro Disla - YM Ultimate SNIPER v6*
*Orderflow Edition | Zones That Matter*
Bifurcation Early WarningBifurcation Early Warning (BEW) — Chaos Theory Regime Detection
OVERVIEW
The Bifurcation Early Warning indicator applies principles from chaos theory and complex systems research to detect when markets are approaching critical transition points — moments where the current regime is likely to break down and shift to a new state.
Unlike momentum or trend indicators that tell you what is happening, BEW tells you when something is about to change. It provides early warning of regime shifts before they occur, giving traders time to prepare for increased volatility or trend reversals.
THE SCIENCE BEHIND IT
In complex systems (weather, ecosystems, financial markets), major transitions don't happen randomly. Research has identified three universal warning signals that precede critical transitions:
1. Critical Slowing Down
As a system approaches a tipping point, it becomes "sluggish" — small perturbations take longer to decay. In markets, this manifests as rising autocorrelation in returns.
2. Variance Amplification
Short-term volatility begins expanding relative to longer-term baselines as the system destabilizes.
3. Flickering
The system oscillates between two potential states before committing to one — visible as increased crossing of mean levels.
BEW combines all three signals into a single composite score.
COMPONENTS
AR(1) Coefficient — Critical Slowing Down (Blue)
Measures lag-1 autocorrelation of returns over a rolling window.
• Rising toward 1.0: Market becoming "sticky," slow to mean-revert — transition approaching
• Low values (<0.3): Normal mean-reverting behavior, stable regime
Variance Ratio (Purple)
Compares short-term variance to long-term variance.
• Above 1.5: Short-term volatility expanding — energy building before a move
• Near 1.0: Volatility stable, no unusual pressure
Flicker Count (Yellow/Teal)
Counts state changes (crossings of the dynamic mean) within the lookback period.
• High count: Market oscillating between states — indecision before commitment
• Low count: Price firmly in one regime
INTERPRETING THE BEW SCORE
0–50 (STABLE): Normal market conditions. Existing strategies should perform as expected.
50–70 (WARNING): Elevated instability detected. Consider reducing exposure or tightening risk parameters.
70–85 (DANGER): High probability of regime change. Avoid initiating new positions; widen stops on existing ones.
85+ (CRITICAL): Bifurcation likely imminent or in progress. Expect large, potentially unpredictable moves.
HOW TO USE
As a Regime Filter
• BEW < 50: Normal trading conditions — apply your standard strategies
• BEW > 60: Elevated caution — reduce position sizes, avoid mean-reversion plays
• BEW > 80: High alert — consider staying flat or hedging existing positions
As a Preparation Signal
BEW tells you when to pay attention, not which direction. When readings elevate:
• Watch for confirmation from volume, order flow, or other directional indicators
• Prepare for breakout scenarios in either direction
• Adjust take-profit and stop-loss distances for larger moves
For Volatility Adjustment
High BEW periods correlate with larger candles. Use this to:
• Widen stops during elevated readings
• Adjust position sizing inversely to BEW score
• Set more ambitious profit targets when entering during high-BEW breakouts
Divergence Analysis
• Price making new highs/lows while BEW stays low: Trend likely to continue smoothly
• Price consolidating while BEW rises: Breakout incoming — direction uncertain but move will be significant
SETTINGS GUIDE
Core Settings
• Lookback Period: General reference period (default: 50)
• Source: Price source for calculations (default: close)
Critical Slowing Down (AR1)
• AR(1) Calculation Period: Bars used for autocorrelation (default: 100). Higher = smoother, slower.
• AR(1) Warning Threshold: Level at which AR(1) is considered elevated (default: 0.85)
Variance Growth
• Variance Short Period: Fast variance window (default: 20)
• Variance Long Period: Slow variance window (default: 100)
• Variance Ratio Threshold: Level for maximum score contribution (default: 1.5)
Regime Flickering
• Flicker Detection Period: Window for counting state changes (default: 20)
• Flicker Bandwidth: ATR multiplier for state detection — lower = more sensitive (default: 0.5)
• Flicker Count Threshold: Number of crossings for maximum score (default: 4)
TIMEFRAME RECOMMENDATIONS
• 5m–15m: Use shorter periods (AR: 30–50, Var: 10/50). Expect more noise.
• 1H: Balanced performance with default or slightly extended settings (AR: 100, Var: 20/100).
• 4H–Daily: Extend periods further (AR: 100–150, Var: 30/150). Cleaner signals, less frequent.
ALERTS
Three alert conditions are included:
• BEW Warning: Score crosses above 50
• BEW Danger: Score crosses above 70
• BEW Critical: Score crosses above 85
LIMITATIONS
• No directional bias: BEW detects instability, not direction. Combine with trend or momentum indicators.
• Not a timing tool: Elevated readings may persist for several bars before the actual move.
• Parameter sensitive: Optimal settings vary by asset and timeframe. Backtest before live use.
• Leading indicator trade-off: Early warning means some false positives are inevitable.
CREDITS
Inspired by research on early warning signals in complex systems:
• Dakos et al. (2012) — "Methods for detecting early warnings of critical transitions"
DISCLAIMER
This indicator is for educational and informational purposes only. It does not constitute financial advice. Past performance is not indicative of future results. Always conduct your own analysis and risk management. Use at your own risk.

Advanced ICC Multi-Timeframe 1.0Advanced ICC Multi-Timeframe Trading System
A comprehensive implementation and interpretation of the Indication, Correction, Continuation (ICC) trading methodology made popular by Trades by Sci, enhanced with advanced multi-timeframe analysis and automation features.
⚠️ CRITICAL TRADING WARNINGS:
DO NOT blindly follow BUY/SELL signals from this indicator
This indicator shows potential entry points but YOU must validate each trade
PAPER TRADE EXTENSIVELY before risking real capital
BACKTEST THOROUGHLY on your chosen instruments and timeframes
The ICC methodology requires understanding and discretion - automated signals are guidance only
This tool aids analysis but does not replace proper trade planning, risk management, or trader judgment
⚠️ Important Disclaimers:
This indicator is not endorsed by or affiliated with Trades by Sci
This is an early implementation and interpretation of the ICC methodology
May not work exactly as Trades by Sci executes his trades and entries
Requires further debugging, backtesting, and real-world validation
Completely free to use - no purchase required
I'm just one person obsessed with this method and wanted some better visualization of the chart/entries
About ICC:
The ICC method identifies complete market cycles through three phases: Indication (breakout), Correction (pullback), and Continuation (entry). This indicator automates the identification of these phases and adds powerful features for modern traders.
Key Features:
Multi-Timeframe Capabilities:
Automatic timeframe detection with optimized settings for 5m, 15m, 30m, 1H, 4H, and Daily charts
Higher timeframe overlay to view HTF ICC levels on lower timeframe charts for precise entry timing
Smart defaults that adjust swing length and consolidation detection based on your timeframe
Advanced Phase Tracking:
Complete ICC cycle tracking: Indication, Correction, Consolidation, Continuation, and No Setup phases
Live structure detection shows potential peaks/troughs before full confirmation
Intelligent invalidation logic detects failed setups when market structure reverses
Dynamic phase backgrounds for instant visual confirmation
Three Types of Entry Signals:
Traditional Entries - Price crosses back through the original indication level (strongest signals)
"BUY" (green) / "SELL" (red)
Breakout Entries - Price breaks out of consolidation range in the same direction
"BUY" (green) / "SELL" (red)
Reversal Entries (Optional, can be toggled off) - Price breaks consolidation in opposite direction, indicating failed setup
"⚠ BUY" (yellow) / "⚠ SELL" (orange)
More aggressive, counter-trend signals
Can be disabled for more conservative trading
Professional Features:
Volatility-based support/resistance zones (ATR-adjusted) that adapt to market conditions
Historical zone tracking (0-3 configurable) with visual hierarchy
Comprehensive real-time info table displaying all key metrics
Full alert system for entries, indications, and consolidation detection
Visual distinction between high-confidence trend entries and cautionary reversal entries
📖 USAGE GUIDE
Entry Signal Types:
The indicator provides three types of entry signals with visual distinction:
Strong Entries (High Confidence):
"BUY" (bright green) / "SELL" (bright red)
Includes traditional entries (crossing back through indication level) and breakout entries (breaking consolidation in trend direction)
These are trend continuation or breakout signals with higher probability
Recommended for all traders
Reversal Entries (Caution - Counter-Trend):
"⚠ BUY" (yellow) / "⚠ SELL" (orange)
Triggered when price breaks out of correction/consolidation in the OPPOSITE direction
Indicates a failed setup and potential trend reversal
More aggressive, counter-trend plays
Can be toggled off in settings for more conservative trading
Recommended only for experienced traders or after thorough backtesting
Swing Length Settings:
The swing length determines how many bars on each side are needed to confirm a swing high/low. This is the most important setting for tuning the indicator to your style.
Auto Mode (Recommended for beginners): Toggle "Use Auto Timeframe Settings" ON
5-minute: 30 bars
15-minute: 20 bars
30-minute: 12 bars
1-hour: 7 bars
4-hour: 5 bars
Daily: 3 bars
Manual Mode: Toggle "Use Auto Timeframe Settings" OFF
Lower values (3-7): More aggressive, detects smaller swings
Pros: More signals, faster entries, catches smaller moves
Cons: More noise, more false signals, requires tighter stops
Best for: Scalping, active day trading, volatile markets
Higher values (12-20): More conservative, only major swings
Pros: More reliable signals, fewer false breakouts, clearer structure
Cons: Fewer signals, delayed entries, might miss smaller opportunities
Best for: Swing trading, position trading, trending markets
Default Manual Setting: 7 bars (balanced for 1H charts)
Minimum: 3 bars
Consolidation Bars Setting:
Determines how many bars without new structure are needed before flagging consolidation.
Lower values (3-10): Faster detection, catches brief pauses, more sensitive
Best for: Lower timeframes, volatile markets, avoiding any chop
Higher values (20-40): More reliable, only flags true extended consolidation
Best for: Higher timeframes, trending markets, patient traders
Current defaults scale with timeframe (more bars needed on shorter timeframes)
Historical S/R Zones:
Shows previous support and resistance levels to provide context.
Default: 2 historical zones (shows current + 2 previous)
Range: 0-3 zones
Visual Hierarchy: Older zones are more transparent with dashed borders
Usage: Higher numbers (2-3) show more historical context but can clutter the chart. Start with 2 and adjust based on your preference.
Live Structure Feature (Yellow Warning ⚠):
Provides early warning of potential structure changes before full confirmation.
What it does: Detects potential swing highs/lows after just 2 bars instead of waiting for full swing_length confirmation
Live Peak: Shows when a high is followed by 2 lower closes (potential top forming)
Live Trough: Shows when a low is followed by 2 higher closes (potential bottom forming)
Important: These are UNCONFIRMED - they may be invalidated if price reverses
Use case: Get early awareness of potential reversals while waiting for confirmation
Displayed in: Info table only (no visual markers on chart to reduce clutter)
Only shows: Peaks higher than last swing high, or troughs lower than last swing low (filters out noise)
Higher Timeframe (HTF) Analysis:
View higher timeframe ICC structure while trading on lower timeframes.
How to enable: Toggle "Show Higher Timeframe ICC" ON
Setup: Set "Higher Timeframe" to your reference timeframe
Example: Trading on 15-minute? Set HTF to 240 (4-hour) or 60 (1-hour)
Example: Trading on 5-minute? Set HTF to 60 (1-hour) or 15 (15-minute)
What it shows:
HTF indication levels displayed as dashed lines
Blue = HTF Bullish Indication
Purple = HTF Bearish Indication
HTF phase and levels shown in info table
Trading workflow:
Check HTF phase for overall market direction
Wait for HTF correction phase
Drop to lower timeframe to find precise entries
Enter when lower TF shows continuation in alignment with HTF
Best practice: HTF should be 3-4x your trading timeframe for best results
Reversal Entries Toggle:
Default: ON (shows all signal types)
Toggle OFF for more conservative trading (only trend continuation signals)
Recommended: Backtest with both settings to see which works better for your style
New traders should consider disabling reversal entries initially
Volatility-Based Zones:
When enabled, support/resistance zones automatically adjust their height based on ATR (Average True Range).
More volatile = wider zones
Less volatile = tighter zones
Toggle OFF for fixed-width zones
Community Feedback Welcome:
This is an evolving project and your input is valuable! Please share:
Bug reports and issues you encounter
Feature requests and suggestions for improvement
Results from your backtesting and live trading experience
Feedback on the reversal entry feature (too aggressive? working well?)
Ideas for better aligning with the ICC methodology
Perfect for traders learning or implementing the ICC methodology with the benefit of modern automation, multi-timeframe analysis, and flexible entry signal options.
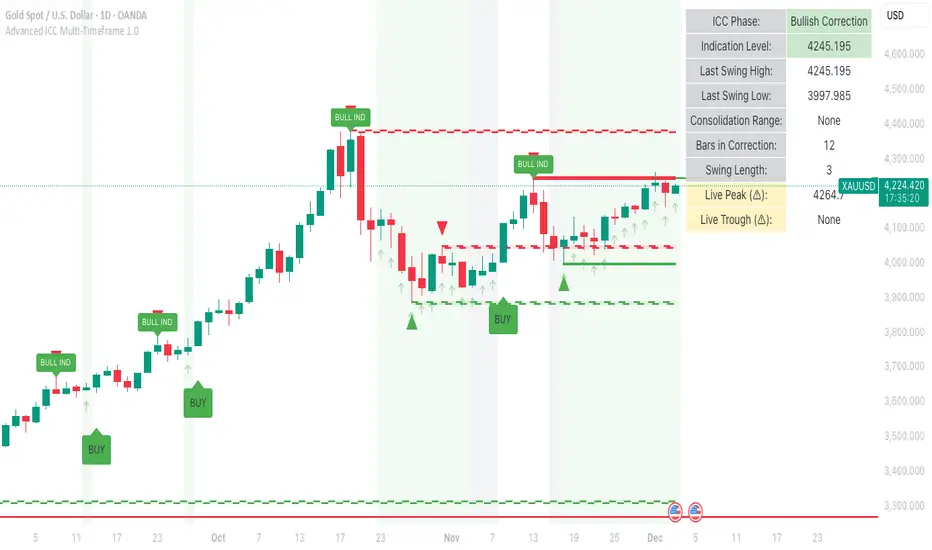
ORB_RDORB_RD - Opening Range Box (Ryan DeBraal)
This indicator automatically draws a high/low box for the first portion of
each trading day, automatically stepping the range window from 15, 30, 45,
up to 60 minutes after the session starts. The box updates live as the range
forms, then optionally extends across the rest of the session.
FEATURES
-----------------------------------------------------------------------------
• Opening Range Detection
- Automatically ladders the range window: 0–15, 0–30, 0–45, 0–60 minutes
- Automatic reset at each new trading day
- Live high/low updates while inside the 0–60 minute window
• Auto-Drawing Range Box
- Draws a dynamic rectangle as the range forms
- Top and bottom update with every new high/low
- Extends sideways in real time during formation
- Optional full-day extension after the 60-minute range finalizes
• Customizable Visuals
- Adjustable fill transparency
- Mild green tint by default for clarity
PURPOSE
-----------------------------------------------------------------------------
This tool highlights the evolving opening range, a widely used intraday
reference for breakout traders, mean-reversion setups, and session structure
analysis. Ideal for:
• Identifying early support and resistance
• Framing breakout and pullback decisions
• Tracking intraday trend bias after the morning range

Watchlist Volume Surge AlertOverview
This indicator is designed for traders who monitor large watchlists and need instant notification when a stock is experiencing unusual volume activity relative to its recent history.
Standard volume indicators often include the current day's volume in the average calculation. This causes a problem: if a stock is having a massive breakout, that high volume pulls the average up immediately, making it harder to hit the "relative" threshold.
This script solves that by comparing the current volume against the Simple Moving Average (SMA) of the previous n bars. This ensures a clean baseline and accurate alerts, even during massive volatility.
Key Features
Smart RVOL Calculation: Calculates Relative Volume (RVOL) based on the previous 30 bars (adjustable), ensuring the current breakout doesn't skew the average.
Visual Clarity:
Bars: Normal volume is transparent. Surge volume turns bright Teal (Bullish Close) or Red (Bearish Close).
Background: The indicator panel background highlights when a surge is active, making it impossible to miss when scanning visually.
Data Window: Displays the exact RVOL ratio (e.g., 2.11) in the Data Window for verification.
Watchlist Alert Optimized: Specifically designed to work with TradingView's "Any alert function call" or standard condition alerts across multiple tickers.
How to Set Up Alerts
This script is perfect for setting a single alert on a large watchlist to catch breakouts as they happen.
Add the indicator to your chart.
Go to the Alerts menu and create a new alert.
Condition: Select Watchlist Volume Surge Alert.
Trigger: Select "Once Per Bar".
Note: Using "Once Per Bar" ensures you are notified the moment the volume crosses the threshold during the trading day, rather than waiting for the market to close.
Message: The script includes a dynamic message: "Volume Surge! {{ticker}} volume is {{plot("RVOL Ratio")}}x the average."
Settings
Average Length (Days): The lookback period for the volume average (Default: 30).
Alert Threshold (x Average): The multiple required to trigger an alert (Default: 1.5x).
Note: This works better when you have a watchlist with similar volatility and/or market cap

Multi-Tool VWAP + EMAs (Multi-Timeframe) + Key LevelsDescription
This indicator combines several commonly used technical analysis tools into a single script, especially useful for traders using the free version of TradingView or anyone looking to reduce the number of indicators on their chart.
The goal is to provide clear visual references for trend, structure, and key levels—without generating buy/sell signals or automated trading functions.
Included Features
1. VWAP (session-anchored)
Source: HLC3
Purple line, thickness 2
Useful as a reference for daily institutional average price.
2. EMAs of the current timeframe
EMA 200 (red, thickness 3)
EMA 9 (green, thickness 1)
These EMAs help visualize long-term trend and short-term momentum.
3. Dynamic EMAs (MTF – Multi-Timeframe)
The indicator displays the 200 EMA from higher timeframes as dynamic horizontal levels:
5 minutes
15 minutes
30 minutes
1 hour
4 hours
1 day
Each level includes a descriptive label such as “15 min EMA 200”.
These EMAs serve as reference points for potential support/resistance areas coming from higher timeframes.
4. Automatic Key Levels
The indicator plots several important price levels:
Previous day:
PDH (Previous Day High)
PDL (Previous Day Low)
Previous Day 50% Fibonacci level
Pre-market (04:00–09:30 exchange time):
PMH (Pre-Market High)
PML (Pre-Market Low)
Current session:
Open (session opening price)
Previous Close (prior day’s closing price)
Purpose and Scope
This script is designed to provide basic visual reference points to support discretionary analysis.
It does not generate signals or trading suggestions, and it is not intended to predict future price movements.
How to Use It
Enable or disable each block in the Inputs section according to your analysis style.
Observe how the levels, EMAs, and VWAP interact with market structure.
Use it as a visual complement to your personal technical analysis.
Limitations
This indicator is not a trading system and does not guarantee results.
It does not include alerts, backtesting, or entry/exit logic.
Some values (such as PMH/PML) depend on the symbol’s exchange trading hours.
Credits
Designed as an educational and analytical tool for traders seeking to simplify their charts without losing key information.

Market Regime & Bias Assistant [Prototype v1.1]
Market Regime & Bias Assistant
### **Overview**
The **Market Regime & Bias Assistant** is an all-in-one trend filtration and trading system designed to keep traders on the right side of the market. Instead of relying on a single moving average, this indicator combines **ADX (Trend Strength)**, **Multi-Timeframe EMAs**, **RSI**, and **Volume Spread Analysis (VSA)** concepts to generate a quantitative "Confidence Score" for the current market bias.
It automatically adapts its settings based on your timeframe (Intraday vs. Swing) and provides clear visual cues via background shading, candle coloring, and a data panel.
---
### **Key Features**
* **Auto-Adaptive Modes:** Automatically switches between "Intraday" and "Swing" settings based on your timeframe.
* *Intraday:* Uses faster EMAs (Aggressive 9/30 or Conservative 20/50) and VWAP.
* *Swing:* Uses standard 20/50 EMAs with 200/800 long-term context moving averages.
* **Market Regime Detection:** Identifies if the market is in a **Trend (Bull/Bear)** or a **Range (Neutral)** using a combination of ADX thresholds and EMA alignment.
* **Confidence Scoring (0-100):** A proprietary algorithm that scores the quality of the trend based on RSI alignment, Volume confirmation, and Long-term EMA context.
* **Vector Volume Candles:** Color-coded candles to highlight institutional activity (High Volume) vs. Climactic Volume (Exhaustion).
* **Pullback Signals:** "L" and "S" markers indicating high-probability entries after a pullback into the EMA value zone.
* **Data Dashboard:** A bottom-right panel displaying the current Mode, Regime, Bias, and quantitative Confidence Score.
---
### **How to Read the Visuals**
#### **1. Background Colors (The Regime)**
* **Green Background:** Confirmed **Bullish Trend**. Only look for Longs.
* **Red Background:** Confirmed **Bearish Trend**. Only look for Shorts.
* **Gray Background:** **Neutral / Range**. The market is chopping or consolidating. Stand aside or trade strictly mean-reversion.
#### **2. Candle Colors (Vector Volume)**
* **Green/Red Borders:** Normal volume.
* **Blue / Fuchsia:** **High Volume (1.2x Average)**. Indicates institutional interest or a breakout.
* **Lime / Bright Red:** **Climactic Volume (1.8x Average)**. Indicates potential exhaustion or a stopping volume event.
#### **3. The EMAs**
* **Fast/Slow Lines:** Show the immediate trend direction.
* **Gray/White Lines:** The 200 and 800 EMAs. These act as major support/resistance levels and define the "Big Picture" bias.
* **Lime Line (Intraday Only):** The VWAP (Volume Weighted Average Price).
---
### **How to Use This Indicator**
**Step 1: Check the Regime**
Look at the background color and the Dashboard panel. Is the Trend Strength "Strong" or "Very Strong"?
* *Rule:* Do not take trend-following trades if the Regime is "Range/Neutral."
**Step 2: Check the Confidence**
The dashboard calculates a score from 0 to 100.
* **High Confidence (>67):** All systems go. Alignment of RSI, Volume, and Trend.
* **Medium Confidence (34-66):** Caution warranted. Usually implies divergence in RSI or low volume.
* **Low Confidence (<34):** The trend is weak or failing.
**Step 3: Wait for the Setup (The Arrows)**
The indicator looks for pullbacks into the "Value Zone" (the space between the Fast and Slow EMA).
* **Triangle Up (L):** Appears when price pulls back into the zone during a Bull trend, then bounces out with volume confirmation.
* **Triangle Down (S):** Appears when price rallies into the zone during a Bear trend, then rejects lower.
---
### **Settings & Customization**
* **Mode:** Default is "Auto," but you can force "Intraday" or "Swing" manually.
* **Intraday Style:** Choose between "Aggressive" (9 EMA / 30 EMA) for scalping or "Conservative" (20 EMA / 50 EMA) for day trading.
* **ADX Threshold:** Adjusts how strict the trend filter is (Default: 20).
* **Visual Toggles:** Turn off/on the Panel, Background shading, or Vector candles to clean up your chart.
### **Alerts**
This script comes with built-in alert conditions for:
1. **Bullish Regime Start**
2. **Bearish Regime Start**
3. **High-Confidence Setup Detected**

MFI Volume Profile [Kodexius]The MFI Volume Profile indicator blends a classic volume profile with the Money Flow Index so you can see not only where volume traded, but also how strong the buying or selling pressure was at those prices. Instead of showing a simple horizontal histogram of volume, this tool adds a money flow dimension and turns the profile into a price volume momentum heat map.
The script scans a user controlled lookback window and builds a set of price levels between the lowest and highest price in that period. For every bar inside that window, its volume is distributed across the price levels that the bar actually touched, and that volume is combined with the bar’s MFI value. This creates a volume weighted average MFI for each price level, so every row of the profile knows both how much volume traded there and what the typical money flow condition was when that volume appeared.
On the chart, the indicator plots a stack of horizontal boxes to the right of current price. The length of each box represents the relative amount of volume at that price, while the color represents the average MFI there. Levels with stronger positive money flow will lean toward warmer shades, and levels with weaker or negative money flow will lean toward cooler or more neutral shades inside the configured MFI band. Each row is also labeled in the format Volume , so you can instantly read the exact volume and money flow value at that level instead of guessing.
This gives you a detailed map of where the market really cared about price, and whether that interest came with strong inflow or outflow. It can help you spot areas of accumulation, distribution, absorption, or exhaustion, and it does so in a compact visual that sits next to price without cluttering the candles themselves.
Features
Combined volume profile and MFI weighting
The indicator builds a volume profile over a user selected lookback and enriches each price row with a volume weighted average MFI. This lets you study both participation and money flow at the same price level.
Volume distributed across the bar price range
For every bar in the window, volume is not assigned to a single price. Instead, it is proportionally distributed across all price rows between the bar low and bar high. This creates a smoother and more realistic profile of where trading actually happened.
MFI based color gradient between 30 and 70
Each price row is colored according to its average MFI. The gradient is anchored between MFI values of 30 and 70, which covers typical oversold, neutral and overbought zones. This makes strong demand or distribution areas easier to spot visually.
Configurable structure resolution and depth
Main user inputs are the lookback length, the number of rows, the width of the profile in bars, and the label text size. You can quickly switch between coarse profiles for a big picture and higher resolution profiles for detailed structure.
Numeric labels with volume and MFI per row
Every box is labeled with the total volume at that level and the average MFI for that level, in the format Volume . This gives you exact values while still keeping the visual profile clean and compact.
Calculations
Money Flow Index calculation
currentMfi is calculated once using ta.mfi(hlc3, mfiLen) as usual,
Creation of the profileBins array
The script creates an array named profileBins that will hold one VPBin element per price row.
Each VPBin contains
volume which is the total volume accumulated at that price row
mfiProduct which is the sum of volume multiplied by MFI for that row
The loop;
for i = 0 to rowCount - 1 by 1
array.push(profileBins, VPBin.new(0.0, 0.0))
pre allocates a clean structure with zero values for all rows.
Finding highest and lowest price across the lookback
The script starts from the current bar high and low, then walks backward through the lookback window
for i = 0 to lookback - 1 by 1
highestPrice := math.max(highestPrice, high )
lowestPrice := math.min(lowestPrice, low )
After this loop, highestPrice and lowestPrice define the full price range covered by the chosen lookback.
Price range and step size for rows
The code computes
float rangePrice = highestPrice - lowestPrice
rangePrice := rangePrice == 0 ? syminfo.mintick : rangePrice
float step = rangePrice / rowCount
rangePrice is the total height of the profile in price terms. If the range is zero, the script replaces it with the minimum tick size for the symbol. Then step is the price height of each row. This step size is used to map any price into a row index.
Processing each bar in the lookback
For every bar index i inside the lookback, the script checks that currentMfi is not missing. If it is valid, it reads the bar high, low, volume and MFI
float barTop = high
float barBottom = low
float barVol = volume
float barMfi = currentMfi
Mapping bar prices to bin indices
The bar high and low are converted into row indices using the known lowestPrice and step
int indexTop = math.floor((barTop - lowestPrice) / step)
int indexBottom = math.floor((barBottom - lowestPrice) / step)
Then the indices are clamped into valid bounds so they stay between zero and rowCount - 1. This ensures that every bar contributes only inside the profile range
Splitting bar volume across all covered bins
Once the top and bottom indices are known, the script calculates how many rows the bar spans
int coveredBins = indexTop - indexBottom + 1
float volPerBin = barVol / coveredBins
float mfiPerBin = volPerBin * barMfi
Here the total bar volume is divided equally across all rows that the bar touches. For each of those rows, the same fraction of volume and volume times MFI is used.
Accumulating into each VPBin
Finally, a nested loop iterates from indexBottom to indexTop and updates the corresponding VPBin
for k = indexBottom to indexTop by 1
VPBin binData = array.get(profileBins, k)
binData.volume := binData.volume + volPerBin
binData.mfiProduct := binData.mfiProduct + mfiPerBin
Over all bars in the lookback window, each row builds up
total volume at that price range
total volume times MFI at that price range
Later, during the drawing stage, the script computes
avgMfi = bin.mfiProduct / bin.volume
for each row. This is the volume weighted average MFI used both for coloring the box and for the numeric MFI value shown in the label Volume .

Gold AI RSI Monitor [Stacked + KNN]Here is a comprehensive description and user guide for the Gold AI RSI Monitor. You can copy and paste this into the "Description" field if you publish the script on TradingView, or save it for your own reference.
Gold AI RSI Monitor
🚀 Overview
The Gold AI RSI Monitor is a next-generation dashboard designed specifically for trading volatile assets like Gold (XAUUSD). It completely reimagines the traditional RSI by "stacking" 10 different timeframes (from 1-minute to Monthly) into a single, vertical view.
Integrated into this dashboard is a K-Nearest Neighbors (KNN) Machine Learning algorithm. This AI analyzes historical price action to find patterns similar to the current market and predicts the next likely move with a confidence score.
📊 Visual Guide: How to Read the Chart
1. The "Stacked" Lanes Instead of switching timeframes constantly, this indicator displays them all at once using vertical offsets.
Bottom Lane (0-100): 1-Minute RSI
Middle Lanes: 5m, 15m, 30m, 1H, 2H, 4H, Daily
Top Lane (900-1000): Monthly RSI
2. Gradient Color System The RSI lines change color based on momentum strength:
🔴 Red: Oversold / Bearish (Approaching 30 or lower)
🟡 Yellow: Neutral (Around 50)
🟢 Green: Overbought / Bullish (Approaching 70 or higher)
3. Tracker Lines Each timeframe has a dotted horizontal line extending to the right. This allows you to instantly see the exact RSI value for every timeframe without squinting.
🤖 The AI Engine (KNN)
The "AI" component uses a K-Nearest Neighbors algorithm.
Learning: It scans the last 1,000 bars of history.
Matching: It finds the 5 historical moments that look mathematically identical to the current market conditions (based on RSI and Volatility).
Predicting: It checks if price went UP or DOWN after those historical matches.
The Signals:
Buying Signal: If the majority of historical matches resulted in a price increase, the AI triggers a BUY.
Selling Signal: If the majority resulted in a drop, the AI triggers a SELL.
🎯 How to Trade with This Indicator
1. The "Crosshair" Signal
When the AI detects a high-probability setup, a massive Crosshair appears on your chart:
Green Crosshair: Strong BUY signal.
Red Crosshair: Strong SELL signal.
Note: The crosshair consists of a thick vertical line and a dashed horizontal line intersecting at the signal candle.
2. Timeframe Alignment (Confluence)
Do not rely on the AI alone. Look at the stacked RSIs:
Strong Long: The AI shows a Green Crosshair AND the lower timeframes (1m, 5m, 15m) are all turning Green/upward.
Strong Short: The AI shows a Red Crosshair AND the lower timeframes are turning Red/downward.
3. Support & Resistance Zones
Bottom Dotted Line (30): Support. If RSI hits this and turns up, it's a buying opportunity.
Top Dotted Line (70): Resistance. If RSI hits this and turns down, it's a selling opportunity.
⚙️ Settings Guide
RSI Length: Default is 14. Lower (e.g., 7) makes it faster/choppier; higher (e.g., 21) makes it smoother.
Enable AI Signals: Toggles the KNN calculation on/off.
Neighbors (K): How many historical matches to check. Default is 5.
Increase to 9-10 for fewer, more conservative signals.
Decrease to 3 for faster, more aggressive signals.
AI Timeframe: CRITICAL SETTING.
If left empty, the AI calculates based on your current chart.
Recommendation: For Gold scalping, set this to 15m or 1h. This ensures the AI looks at the bigger trend even if you are zooming in on the 1-minute chart.
⚠️ Disclaimer
This tool is for educational and analytical purposes. The "AI" is a statistical probability algorithm based on past performance, which is not indicative of future results. Always manage your risk.

Kịch bản của tôi//@version=6
indicator(title="Relative Strength Index", shorttitle="Gấu Trọc RSI", format=format.price, precision=2, timeframe="", timeframe_gaps=true)
rsiLengthInput = input.int(14, minval=1, title="RSI Length", group="RSI Settings")
rsiSourceInput = input.source(close, "Source", group="RSI Settings")
calculateDivergence = input.bool(false, title="Calculate Divergence", group="RSI Settings", display = display.data_window, tooltip = "Calculating divergences is needed in order for divergence alerts to fire.")
change = ta.change(rsiSourceInput)
up = ta.rma(math.max(change, 0), rsiLengthInput)
down = ta.rma(-math.min(change, 0), rsiLengthInput)
rsi = down == 0 ? 100 : up == 0 ? 0 : 100 - (100 / (1 + up / down))
rsiPlot = plot(rsi, "RSI", color=#7E57C2)
rsiUpperBand1 = hline(98, "RSI Upper Band1", color=#787B86)
rsiUpperBand = hline(70, "RSI Upper Band", color=#787B86)
midline = hline(50, "RSI Middle Band", color=color.new(#787B86, 50))
rsiLowerBand = hline(30, "RSI Lower Band", color=#787B86)
rsiLowerBand2 = hline(14, "RSI Lower Band2", color=#787B86)
fill(rsiUpperBand, rsiLowerBand, color=color.rgb(126, 87, 194, 90), title="RSI Background Fill")
midLinePlot = plot(50, color = na, editable = false, display = display.none)
fill(rsiPlot, midLinePlot, 100, 70, top_color = color.new(color.green, 0), bottom_color = color.new(color.green, 100), title = "Overbought Gradient Fill")
fill(rsiPlot, midLinePlot, 30, 0, top_color = color.new(color.red, 100), bottom_color = color.new(color.red, 0), title = "Oversold Gradient Fill")
// Smoothing MA inputs
GRP = "Smoothing"
TT_BB = "Only applies when 'SMA + Bollinger Bands' is selected. Determines the distance between the SMA and the bands."
maTypeInput = input.string("SMA", "Type", options = , group = GRP, display = display.data_window)
var isBB = maTypeInput == "SMA + Bollinger Bands"
maLengthInput = input.int(14, "Length", group = GRP, display = display.data_window, active = maTypeInput != "None")
bbMultInput = input.float(2.0, "BB StdDev", minval = 0.001, maxval = 50, step = 0.5, tooltip = TT_BB, group = GRP, display = display.data_window, active = isBB)
var enableMA = maTypeInput != "None"
// Smoothing MA Calculation
ma(source, length, MAtype) =>
switch MAtype
"SMA" => ta.sma(source, length)
"SMA + Bollinger Bands" => ta.sma(source, length)
"EMA" => ta.ema(source, length)
"SMMA (RMA)" => ta.rma(source, length)
"WMA" => ta.wma(source, length)
"VWMA" => ta.vwma(source, length)
// Smoothing MA plots
smoothingMA = enableMA ? ma(rsi, maLengthInput, maTypeInput) : na
smoothingStDev = isBB ? ta.stdev(rsi, maLengthInput) * bbMultInput : na
plot(smoothingMA, "RSI-based MA", color=color.yellow, display = enableMA ? display.all : display.none, editable = enableMA)
bbUpperBand = plot(smoothingMA + smoothingStDev, title = "Upper Bollinger Band", color=color.green, display = isBB ? display.all : display.none, editable = isBB)
bbLowerBand = plot(smoothingMA - smoothingStDev, title = "Lower Bollinger Band", color=color.green, display = isBB ? display.all : display.none, editable = isBB)
fill(bbUpperBand, bbLowerBand, color= isBB ? color.new(color.green, 90) : na, title="Bollinger Bands Background Fill", display = isBB ? display.all : display.none, editable = isBB)
// Divergence
lookbackRight = 5
lookbackLeft = 5
rangeUpper = 60
rangeLower = 5
bearColor = color.red
bullColor = color.green
textColor = color.white
noneColor = color.new(color.white, 100)
_inRange(bool cond) =>
bars = ta.barssince(cond)
rangeLower <= bars and bars <= rangeUpper
plFound = false
phFound = false
bullCond = false
bearCond = false
rsiLBR = rsi
if calculateDivergence
//------------------------------------------------------------------------------
// Regular Bullish
// rsi: Higher Low
plFound := not na(ta.pivotlow(rsi, lookbackLeft, lookbackRight))
rsiHL = rsiLBR > ta.valuewhen(plFound, rsiLBR, 1) and _inRange(plFound )
// Price: Lower Low
lowLBR = low
priceLL = lowLBR < ta.valuewhen(plFound, lowLBR, 1)
bullCond := priceLL and rsiHL and plFound
//------------------------------------------------------------------------------
// Regular Bearish
// rsi: Lower High
phFound := not na(ta.pivothigh(rsi, lookbackLeft, lookbackRight))
rsiLH = rsiLBR < ta.valuewhen(phFound, rsiLBR, 1) and _inRange(phFound )
// Price: Higher High
highLBR = high
priceHH = highLBR > ta.valuewhen(phFound, highLBR, 1)
bearCond := priceHH and rsiLH and phFound
plot(
plFound ? rsiLBR : na,
offset = -lookbackRight,
title = "Regular Bullish",
linewidth = 2,
color = (bullCond ? bullColor : noneColor),
display = display.pane,
editable = calculateDivergence)
plotshape(
bullCond ? rsiLBR : na,
offset = -lookbackRight,
title = "Regular Bullish Label",
text = " Bull ",
style = shape.labelup,
location = location.absolute,
color = bullColor,
textcolor = textColor,
display = display.pane,
editable = calculateDivergence)
plot(
phFound ? rsiLBR : na,
offset = -lookbackRight,
title = "Regular Bearish",
linewidth = 2,
color = (bearCond ? bearColor : noneColor),
display = display.pane,
editable = calculateDivergence)
plotshape(
bearCond ? rsiLBR : na,
offset = -lookbackRight,
title = "Regular Bearish Label",
text = " Bear ",
style = shape.labeldown,
location = location.absolute,
color = bearColor,
textcolor = textColor,
display = display.pane,
editable = calculateDivergence)
alertcondition(bullCond, title='Regular Bullish Divergence', message="Found a new Regular Bullish Divergence, `Pivot Lookback Right` number of bars to the left of the current bar.")
alertcondition(bearCond, title='Regular Bearish Divergence', message='Found a new Regular Bearish Divergence, `Pivot Lookback Right` number of bars to the left of the current bar.')

Volume Pressure OscillatorThe Volume Pressure Oscillator (VPO) is a momentum-based indicator that measures the directional pressure of cumulative volume delta (CVD) combined with price efficiency. It oscillates between 0 and 100, with readings above 50 indicating net buying pressure and readings below 50 indicating net selling pressure.
The indicator is designed to identify the strength and sustainability of volume-driven trends while remaining responsive during consolidation periods.
How the Indicator Works
The VPO analyzes volume flow by examining price action at lower timeframes to build a Cumulative Volume Delta (CVD). For each chart bar, the indicator looks at intrabar price movements to classify volume as either buying volume or selling volume. These classifications are accumulated into a running total that tracks net directional volume.
The indicator then measures the momentum of this CVD over both short-term and longer-term periods, providing responsiveness to recent changes while maintaining awareness of the broader trend. These momentum readings are normalized using percentile ranking, which creates a stable 0-100 scale that works consistently across different instruments and market conditions.
A key feature is the extreme zone persistence mechanism. When the indicator enters extreme zones (above 80 or below 20), it maintains elevated readings as long as volume pressure continues in the same direction. This allows the VPO to stay in extreme zones during strong trends rather than quickly reverting to neutral, making it useful for identifying sustained volume pressure rather than just temporary spikes.
What Makes This Indicator Different
While many indicators measure volume or volume delta, the VPO specifically measures how aggressively CVD is currently changing and whether that pressure is being sustained. It's the difference between knowing "more volume has accumulated on the buy side" versus "buying pressure is intensifying right now and shows signs of continuation."
1. Focus on CVD Momentum, Not CVD Levels
Most CVD indicators display the cumulative volume delta as a line that trends up or down indefinitely. The VPO is fundamentally different - it measures the slope of CVD rather than the absolute level. This transforms CVD from an unbounded cumulative metric into a bounded 0-100 oscillator that shows the intensity and direction of current volume pressure, not just the historical accumulation.
2. Designed to Stay in Extremes During Trends
Unlike traditional oscillators that treat extreme readings (above 80 or below 20) as overbought/oversold reversal signals, the VPO is engineered to oscillate within extreme zones during strong trends. When sustained buying or selling pressure exists, the indicator remains elevated (e.g., 80-95 or 5-20) rather than quickly reverting to neutral. This makes it useful for trend continuation identification rather than exclusively for reversal trading.
3. Percentile-Based Normalization
The VPO uses percentile ranking over a lookback window, which provides consistent behavior across different instruments, timeframes, and volatility regimes without constant recalibration.
4. Dual-Timeframe Momentum Synthesis
The indicator simultaneously considers short-term CVD momentum (responsive to recent changes) and longer-term CVD momentum (tracking trend direction), weighted and combined with a slow-moving trend bias. This multi-timeframe approach helps it stay responsive in ranging markets while maintaining context during trends.
How to Use the Indicator
Understanding the Zones:
80-100 (Strong Buying Pressure): CVD momentum is strongly positive. In trending markets, the indicator oscillates within this zone rather than immediately reverting to neutral. This suggests sustained accumulation and trend continuation probability.
60-80 (Moderate Buying): Positive volume pressure but not extreme. Suitable for identifying pullback entry opportunities within uptrends.
40-60 (Neutral Zone): Volume pressure is balanced or unclear. No strong directional edge from volume. Often seen during consolidation or trend transitions.
20-40 (Moderate Selling): Negative volume pressure developing. May indicate distribution or downtrend continuation setups.
0-20 (Strong Selling Pressure): CVD momentum is strongly negative. During downtrends, sustained readings in this zone suggest continued distribution and downside follow-through probability.
Practical Applications:
Trend Confirmation: When price makes new highs/lows, check if VPO confirms with similarly elevated readings. Divergences (price making new highs while VPO fails to reach prior highs) may indicate weakening momentum.
Range Trading: During consolidation, the VPO typically oscillates between 30-70. Readings toward the low end of the range (30-40) may present accumulation opportunities, while readings at the high end (60-70) may indicate distribution zones.
Extreme Persistence: If VPO reaches 90+ or drops below 10, this indicates exceptional volume pressure. Rather than fading these extremes immediately, monitor whether the indicator stays elevated. Sustained extreme readings suggest strong trend continuation potential.
Context with Price Action: The VPO is most effective when combined with price action or other orderflow indicators. Use the indicator to gauge whether volume is confirming or contradicting.
What the Indicator Does NOT Do:
It does not provide specific entry or exit signals
It does not predict future price direction
It does not guarantee profitable trades
It should not be used as a standalone trading system
Settings Explanation
Momentum Period (Default: 14)
This parameter controls the lookback period for CVD rate-of-change calculations.
Lower values (5-10): Make the indicator more responsive to recent volume changes. Useful for shorter-term trading and more active oscillation. May produce more whipsaws in choppy markets.
Default value (14): Provides balanced responsiveness while filtering out most noise. Suitable for swing trading and daily timeframe analysis.
Higher values (20-50): Create smoother readings and focus on longer-term volume trends. Better for position trading and reducing false signals, but with slower reaction to genuine changes in volume pressure.
Important Notes:
This indicator requires intrabar data to function properly. On some instruments or timeframes where lower timeframe data is not available, the indicator may not display.
The indicator uses request.security_lower_tf() which has a limit of intrabars. On higher timeframes, this provides extensive history, but on very low timeframes (<1-minute charts), the indicator may only cover limited historical bars.
Volume data quality varies by exchange and instrument. The indicator's effectiveness depends on accurate volume reporting from the data feed.

VCP Base Detector
📊 VCP BASE DETECTOR - AUTO-DETECT CONSOLIDATION ZONES
🎯 WHAT IS THIS INDICATOR?
This indicator automatically detects and marks ALL consolidation bases (VCP bases) on your chart. It:
✅ Auto-detects when price enters consolidation
✅ Measures base tightness (volatility contraction)
✅ Tracks base duration (how long consolidating)
✅ Rates base quality (1-5 stars)
✅ Shows volume drying confirmation
✅ Detects base breakouts
✅ Shows progression of multiple bases (VCP pattern)
Use this WITH the "Mark Minervini SEPA Balanced" indicator for complete trading setups!
✅ Mark Minervini SEPA Balanced = Trend + RS + Stage
✅ VCP Base Detector = Base Quality + Progression
Combined = Complete professional trading system!
🎨 WHAT YOU SEE ON YOUR CHART
1️⃣ COLORED BOXES (Base Zones):
🟦 Aqua Box = ⭐⭐⭐⭐⭐ Excellent base (tightest)
🔵 Blue Box = ⭐⭐⭐⭐ Very good base
🟣 Purple Box = ⭐⭐⭐ Good base
🟠 Orange Box = ⭐⭐ Fair base
⬜ Gray Box = ⭐ Weak base
2️⃣ BASE LABELS (With Metrics):
Shows above each base:
• Duration: 20 days
• Tightness: 0.9%
• Quality: ⭐⭐⭐⭐⭐
3️⃣ BREAKOUT LABELS (When price exits base):
Green "BREAKOUT ✓" label shows:
• Price: ₹800
• Volume: 1.6x
4️⃣ DASHBOARD (Top-Left Panel):
Real-time base metrics showing:
• In Base: YES/NO
• Tightness: 0.8%
• Duration: 22 days
• Range: 3.5%
• Volume: Drying/Normal
• Quality: ⭐⭐⭐⭐
📊 UNDERSTANDING BASE QUALITY (⭐ Rating System)
⭐⭐⭐⭐⭐ (EXCELLENT)
├─ Tightness: < 0.8% ATR
├─ Duration: 15-40 days
├─ Volume: Significantly drying
├─ Price Range: < 5%
└─ Result: Most explosive breakouts (best quality)
⭐⭐⭐⭐ (VERY GOOD)
├─ Tightness: 0.8-1.0% ATR
├─ Duration: 15-35 days
├─ Volume: Very dry
├─ Price Range: < 7%
└─ Result: High probability breakouts
⭐⭐⭐ (GOOD)
├─ Tightness: 1.0-1.3% ATR
├─ Duration: 15-30 days
├─ Volume: Drying
├─ Price Range: < 8%
└─ Result: Decent breakout probability
⭐⭐ (FAIR)
├─ Tightness: 1.3-1.5% ATR
├─ Duration: 15-25 days
├─ Volume: Moderate drying
├─ Price Range: < 10%
└─ Result: Lower quality, riskier
⭐ (WEAK)
├─ Tightness: > 1.5% ATR
├─ Duration: Varies
├─ Volume: Not drying enough
├─ Price Range: > 10%
└─ Result: Low quality, skip these
📈 HOW TO USE - STEP BY STEP
STEP 1: ADD INDICATOR TO CHART
────────────────────────────────
1. Open any stock chart (use 1D timeframe for swing trading)
2. Click "Indicators"
3. Search "VCP Base Detector"
4. Click to add to chart
5. Wait a moment for boxes to appear
STEP 2: SCAN FOR BASES
───────────────────────
Look for:
✓ Colored boxes appearing on chart (bases forming)
✓ Dashboard showing "In Base: YES"
✓ Tightness below 1.5%
✓ Volume Dry: YES
STEP 3: MONITOR BASE QUALITY
──────────────────────────────
Dashboard shows stars:
⭐⭐⭐⭐⭐ = Wait for breakout (best setup)
⭐⭐⭐⭐ = Good quality, watch for breakout
⭐⭐⭐ = Decent, but not ideal
⭐⭐ or ⭐ = Skip (lower probability)
STEP 4: WAIT FOR BREAKOUT
──────────────────────────
When price breaks above the box:
✓ Green "BREAKOUT ✓" label appears
✓ Shows breakout price and volume
✓ If volume shows 1.3x+, breakout is confirmed
✓ This is your entry signal!
STEP 5: CHECK MINERVINI CRITERIA (Use Both Indicators)
───────────────────────────────────────────────────────
Before entering:
✓ VCP Base Detector shows ⭐⭐⭐⭐+ quality base
✓ Mark Minervini indicator shows BUY SIGNAL
✓ Dashboard shows 10+ criteria GREEN
✓ Stage shows S2
Result: HIGH-PROBABILITY SETUP! 🎯
📋 DASHBOARD INDICATORS - WHAT EACH MEANS
BASE METRICS SECTION:
─────────────────────
In Base = ✓ YES or ✗ NO
Show if price is currently consolidating
Tightness = 0-3% (lower = tighter = better)
< 0.8% = ⭐⭐⭐⭐⭐ (excellent)
0.8-1.0% = ⭐⭐⭐⭐ (very good)
1.0-1.3% = ⭐⭐⭐ (good)
1.3-1.5% = ⭐⭐ (fair)
> 1.5% = ⭐ (weak)
Duration = Number of days in consolidation
15 days = ⭐ (too short, weak)
20 days = ⭐⭐⭐ (ideal)
30 days = ⭐⭐⭐⭐ (very long, strong)
> 40 days = ⚠️ (too long, may break down)
Range = % movement within the base
< 5% = ⭐⭐⭐⭐⭐ (excellent, very tight)
5-8% = ⭐⭐⭐ (good)
> 10% = ⭐ (loose, not ideal)
Vol Dry = Volume status during consolidation
✓ YES = Volume contracting (good)
✗ NO = Normal/high volume (weak setup)
QUALITY SECTION:
────────────────
Stars = Overall base quality rating
⭐⭐⭐⭐⭐ = Best quality bases (most explosive)
⭐⭐⭐⭐ = Excellent quality
⭐⭐⭐ = Good quality
⭐⭐ = Fair quality
⭐ = Weak quality (skip)
52W INFO SECTION:
─────────────────
From 52W Hi = How far below 52-week high is price?
< 25% = In sweet zone ✓
> 25% = Too far from highs ✗
From 52W Lo = How far above 52-week low is price?
> 30% = In sweet zone ✓
< 30% = Too close to lows ✗
⚙️ CUSTOMIZATION GUIDE
Click ⚙️ gear icon next to indicator to adjust:
MINIMUM BASE DAYS (Default: 15)
──────────────────────────────
Current: 15 = Include shorter bases
Change to 20 = Longer bases only (higher quality)
Change to 10 = Include very short bases (more frequent)
Why: Longer bases = better breakouts, but fewer opportunities
ATR% TIGHTNESS THRESHOLD (Default: 1.5)
────────────────────────────────────────
Current: 1.5 = BALANCED for Indian stocks
Change to 1.0 = ONLY very tight bases (⭐⭐⭐⭐⭐)
Change to 2.0 = Looser bases included (more frequent)
Why: Lower = tighter bases = better quality, fewer signals
VOLUME DRYING THRESHOLD (Default: 0.7)
──────────────────────────────────────
Current: 0.7 = Volume at 70% of average (good drying)
Change to 0.6 = Stricter (more volume drying required)
Change to 0.8 = Looser (less volume drying required)
Why: Volume drying = consolidation confirmation
52W PERIOD (Default: 252)
─────────────────────────
Current: 252 = Full year lookback
Don't change unless you know what you're doing
📈 REAL TRADING EXAMPLE
SCENARIO: Trading MARUTI over 6 weeks
WEEK 1: Nothing happening
─────────────────────────
- No boxes on chart
- Dashboard: "In Base: NO"
- Action: SKIP (not consolidating)
WEEK 2: Base Starting to Form
─────────────────────────────
- Purple box appears (⭐⭐⭐ quality)
- Dashboard: "In Base: YES"
- Tightness: 1.2%
- Duration: 3 days (too new)
- Action: MONITOR (let it develop)
WEEK 3-4: Base Tightening
──────────────────────────
- Box color changes from Purple → Blue (⭐⭐⭐⭐ quality)
- Dashboard: Duration: 12 days
- Tightness: 0.9%
- Vol Dry: YES
- Action: GET READY (high-quality base forming)
WEEK 4-5: Perfect Base Formed
──────────────────────────────
- Box changes to Aqua (⭐⭐⭐⭐⭐ EXCELLENT!)
- Dashboard: Duration: 22 days ✓
- Tightness: 0.8% ✓
- Vol Dry: YES ✓
- Range: 4.2% ✓
- Action: WATCH FOR BREAKOUT
WEEK 5: BREAKOUT HAPPENS!
──────────────────────────
- Price closes above box
- Green "BREAKOUT ✓" label appears
- Shows: Price ₹850, Volume 1.6x
- Mark Minervini indicator: BUY SIGNAL ✓
- Dashboard all GREEN ✓
- Action: ENTER TRADE
Entry: ₹850
Stop: Box low (₹820)
Target: ₹980 (20% move)
RESULT: +15.3% profit in 2 weeks! ✅
💡 PRO TIPS FOR BEST RESULTS
1. COMBINE WITH MINERVINI INDICATOR
Use BOTH indicators together:
✓ VCP Detector = Base quality
✓ Minervini = Trend + RS + Volume
Result = Best high-probability setups
2. PREFER ⭐⭐⭐⭐+ QUALITY BASES
Don't trade ⭐⭐ or ⭐ quality bases
Only trade ⭐⭐⭐+ (ideally ⭐⭐⭐⭐+)
Higher quality = Higher win rate
3. WAIT FOR VOLUME CONFIRMATION
Base must show "Vol Dry: YES"
Breakout must have 1.3x+ volume
Low volume breakouts fail often
4. USE 1D TIMEFRAME ONLY
This indicator optimized for daily charts
Intraday = Too many false signals
Weekly = Misses good setups
5. MONITOR MULTIPLE BASES (VCP PATTERN)
Multiple bases getting tighter = VCP pattern
Each base should be better quality than last
Tightest base = Biggest breakout
6. COMBINE WITH 52W CONTEXT
Dashboard shows "From 52W Hi" and "From 52W Lo"
Price should be in sweet zone:
< 25% from 52W high (uptrend territory)
> 30% above 52W low (not oversold)
7. BACKTEST FIRST
Use TradingView Replay
Go back 6-12 months
See how many bases appeared
See which were profitable
❌ BASES TO SKIP (Lower Probability)
Skip if:
❌ Quality rating < ⭐⭐⭐ (only 1-2 stars)
❌ Tightness > 1.5% (too loose)
❌ Duration < 10 days (too short, weak)
❌ Duration > 50 days (too long, may break down)
❌ Vol Dry: NO (volume not contracting)
❌ Range > 10% (not tight consolidation)
❌ Price < 30% from 52W low (too weak)
❌ Price > 30% from 52W high (too far up, late entry)
⚠️ IMPORTANT DISCLAIMERS
✓ This indicator is for educational purposes only
✓ Past performance does not guarantee future results
✓ Always use proper risk management (position sizing, stop loss)
✓ Never risk more than 2% of your account on one trade
✓ Base detection is technical analysis, not investment advice
✓ Losses can occur - trade at your own risk
✓ Combine with other indicators for best results
🎓 LEARNING RESOURCES
To understand VCP bases better:
→ Study "Trade Like a Stock Market Wizard" by Mark Minervini
→ Watch: "VCP Pattern" videos on YouTube
→ Practice: Backtest on 1-2 years of historical data
→ Learn: How consolidation precedes breakouts
🚀 YOU'RE READY!
Happy trading! 📈🎯

Tomo's Pivots // last W, last M, last Q, last30d, last90d.These are pivots that you can use to look back at various time periods to find magnetic Price points of support and resistance. There are: weekly, last 30 days, last month, last 90 days, and last quarter. You can change the color and style of every indicator and its label. So if it happens to be November 29 today, you will see the last 90 days representing 90 days before November 29. But you will also see last quarter which represents from July 1 to September 30. These values are fair value equilibrium price point by averaging the high low and close of that time period. Weekly is great for intraday trading and the last 30 is great for momentum. Consider using the monthly for swing trading. Stay in the green.

RSI Forecast Colorful [DiFlip]RSI Forecast Colorful
Introducing one of the most complete RSI indicators available — a highly customizable analytical tool that integrates advanced prediction capabilities. RSI Forecast Colorful is an evolution of the classic RSI, designed to anticipate potential future RSI movements using linear regression. Instead of simply reacting to historical data, this indicator provides a statistical projection of the RSI’s future behavior, offering a forward-looking view of market conditions.
⯁ Real-Time RSI Forecasting
For the first time, a public RSI indicator integrates linear regression (least squares method) to forecast the RSI’s future behavior. This innovative approach allows traders to anticipate market movements based on historical trends. By applying Linear Regression to the RSI, the indicator displays a projected trendline n periods ahead, helping traders make more informed buy or sell decisions.
⯁ Highly Customizable
The indicator is fully adaptable to any trading style. Dozens of parameters can be optimized to match your system. All 28 long and short entry conditions are selectable and configurable, allowing the construction of quantitative, statistical, and automated trading models. Full control over signals ensures precise alignment with your strategy.
⯁ Innovative and Science-Based
This is the first public RSI indicator to apply least-squares predictive modeling to RSI calculations. Technically, it incorporates machine-learning logic into a classic indicator. Using Linear Regression embeds strong statistical foundations into RSI forecasting, making this tool especially valuable for traders seeking quantitative and analytical advantages.
⯁ Scientific Foundation: Linear Regression
Linear regression is a fundamental statistical method that models the relationship between a dependent variable y and one or more independent variables x. The general formula for simple linear regression is:
y = β₀ + β₁x + ε
where:
y = predicted variable (e.g., future RSI value)
x = explanatory variable (e.g., bar index or time)
β₀ = intercept (value of y when x = 0)
β₁ = slope (rate of change of y relative to x)
ε = random error term
The goal is to estimate β₀ and β₁ by minimizing the sum of squared errors. This is achieved using the least squares method, ensuring the best linear fit to historical data. Once the coefficients are calculated, the model extends the regression line forward, generating the RSI projection based on recent trends.
⯁ Least Squares Estimation
To minimize the error between predicted and observed values, we use the formulas:
β₁ = Σ((xᵢ - x̄)(yᵢ - ȳ)) / Σ((xᵢ - x̄)²)
β₀ = ȳ - β₁x̄
Σ denotes summation; x̄ and ȳ are the means of x and y; and i ranges from 1 to n (number of observations). These equations produce the best linear unbiased estimator under the Gauss–Markov assumptions — constant variance (homoscedasticity) and a linear relationship between variables.
⯁ Linear Regression in Machine Learning
Linear regression is a foundational component of supervised learning. Its simplicity and precision in numerical prediction make it essential in AI, predictive algorithms, and time-series forecasting. Applying regression to RSI is akin to embedding artificial intelligence inside a classic indicator, adding a new analytical dimension.
⯁ Visual Interpretation
Imagine a time series of RSI values like this:
Time →
RSI →
The regression line smooths these historical values and projects itself n periods forward, creating a predictive trajectory. This projected RSI line can cross the actual RSI, generating sophisticated entry and exit signals. In summary, the RSI Forecast Colorful indicator provides both the current RSI and the forecasted RSI, allowing comparison between past and future trend behavior.
⯁ Summary of Scientific Concepts Used
Linear Regression: Models relationships between variables using a straight line.
Least Squares: Minimizes squared prediction errors for optimal fit.
Time-Series Forecasting: Predicts future values from historical patterns.
Supervised Learning: Predictive modeling based on known output values.
Statistical Smoothing: Reduces noise to highlight underlying trends.
⯁ Why This Indicator Is Revolutionary
Scientifically grounded: Built on statistical and mathematical theory.
First of its kind: The first public RSI with least-squares predictive modeling.
Intelligent: Incorporates machine-learning logic into RSI interpretation.
Forward-looking: Generates predictive, not just reactive, signals.
Customizable: Exceptionally flexible for any strategic framework.
⯁ Conclusion
By combining RSI and linear regression, the RSI Forecast Colorful allows traders to predict market momentum rather than simply follow it. It's not just another indicator: it's a scientific advancement in technical analysis technology. Offering 28 configurable entry conditions and advanced signals, this open-source indicator paves the way for innovative quantitative systems.
⯁ Example of simple linear regression with one independent variable
This example demonstrates how a basic linear regression works when there is only one independent variable influencing the dependent variable. This type of model is used to identify a direct relationship between two variables.
⯁ In linear regression, observations (red) are considered the result of random deviations (green) from an underlying relationship (blue) between a dependent variable (y) and an independent variable (x)
This concept illustrates that sampled data points rarely align perfectly with the true trend line. Instead, each observed point represents the combination of the true underlying relationship and a random error component.
⯁ Visualizing heteroscedasticity in a scatterplot with 100 random fitted values using Matlab
Heteroscedasticity occurs when the variance of the errors is not constant across the range of fitted values. This visualization highlights how the spread of data can change unpredictably, which is an important factor in evaluating the validity of regression models.
⯁ The datasets in Anscombe’s quartet were designed to have nearly the same linear regression line (as well as nearly identical means, standard deviations, and correlations) but look very different when plotted
This classic example shows that summary statistics alone can be misleading. Even with identical numerical metrics, the datasets display completely different patterns, emphasizing the importance of visual inspection when interpreting a model.
⯁ Result of fitting a set of data points with a quadratic function
This example illustrates how a second-degree polynomial model can better fit certain datasets that do not follow a linear trend. The resulting curve reflects the true shape of the data more accurately than a straight line.
⯁ What Is RSI?
The RSI (Relative Strength Index) is a technical indicator developed by J. Welles Wilder. It measures the velocity and magnitude of recent price movements to identify overbought and oversold conditions. The RSI ranges from 0 to 100 and is commonly used to identify potential reversals and evaluate trend strength.
⯁ How RSI Works
RSI is calculated from average gains and losses over a set period (commonly 14 bars) and plotted on a 0–100 scale. It consists of three key zones:
Overbought: RSI above 70 may signal an overbought market.
Oversold: RSI below 30 may signal an oversold market.
Neutral Zone: RSI between 30 and 70, indicating no extreme condition.
These zones help identify potential price reversals and confirm trend strength.
⯁ Entry Conditions
All conditions below are fully customizable and allow detailed control over entry signal creation.
📈 BUY
🧲 Signal Validity: Signal remains valid for X bars.
🧲 Signal Logic: Configurable using AND or OR.
🧲 RSI > Upper
🧲 RSI < Upper
🧲 RSI > Lower
🧲 RSI < Lower
🧲 RSI > Middle
🧲 RSI < Middle
🧲 RSI > MA
🧲 RSI < MA
🧲 MA > Upper
🧲 MA < Upper
🧲 MA > Lower
🧲 MA < Lower
🧲 RSI (Crossover) Upper
🧲 RSI (Crossunder) Upper
🧲 RSI (Crossover) Lower
🧲 RSI (Crossunder) Lower
🧲 RSI (Crossover) Middle
🧲 RSI (Crossunder) Middle
🧲 RSI (Crossover) MA
🧲 RSI (Crossunder) MA
🧲 MA (Crossover)Upper
🧲 MA (Crossunder)Upper
🧲 MA (Crossover) Lower
🧲 MA (Crossunder) Lower
🧲 RSI Bullish Divergence
🧲 RSI Bearish Divergence
🔮 RSI (Crossover) Forecast MA
🔮 RSI (Crossunder) Forecast MA
📉 SELL
🧲 Signal Validity: Signal remains valid for X bars.
🧲 Signal Logic: Configurable using AND or OR.
🧲 RSI > Upper
🧲 RSI < Upper
🧲 RSI > Lower
🧲 RSI < Lower
🧲 RSI > Middle
🧲 RSI < Middle
🧲 RSI > MA
🧲 RSI < MA
🧲 MA > Upper
🧲 MA < Upper
🧲 MA > Lower
🧲 MA < Lower
🧲 RSI (Crossover) Upper
🧲 RSI (Crossunder) Upper
🧲 RSI (Crossover) Lower
🧲 RSI (Crossunder) Lower
🧲 RSI (Crossover) Middle
🧲 RSI (Crossunder) Middle
🧲 RSI (Crossover) MA
🧲 RSI (Crossunder) MA
🧲 MA (Crossover)Upper
🧲 MA (Crossunder)Upper
🧲 MA (Crossover) Lower
🧲 MA (Crossunder) Lower
🧲 RSI Bullish Divergence
🧲 RSI Bearish Divergence
🔮 RSI (Crossover) Forecast MA
🔮 RSI (Crossunder) Forecast MA
🤖 Automation
All BUY and SELL conditions can be automated using TradingView alerts. Every configurable condition can trigger alerts suitable for fully automated or semi-automated strategies.
⯁ Unique Features
Linear Regression Forecast
Signal Validity: Keep signals active for X bars
Signal Logic: AND/OR configuration
Condition Table: BUY/SELL
Condition Labels: BUY/SELL
Chart Labels: BUY/SELL markers above price
Automation & Alerts: BUY/SELL
Background Colors: bgcolor
Fill Colors: fill
Linear Regression Forecast
Signal Validity: Keep signals active for X bars
Signal Logic: AND/OR configuration
Condition Table: BUY/SELL
Condition Labels: BUY/SELL
Chart Labels: BUY/SELL markers above price
Automation & Alerts: BUY/SELL
Background Colors: bgcolor
Fill Colors: fill

VaCs Pro Max by CS (Final Version - V9)VaCs Pro Max by CS (Final Version - V9) – TradingView Indicator Overview
Introduction:
The VaCs Pro Max indicator is a comprehensive, all-in-one technical analysis tool designed for traders who seek a clear, visual, and flexible overview of market trends, levels, sessions, and key signals. This advanced TradingView script integrates multiple technical indicators, market level trackers, session visualizations, and the innovative AlphaTrend module to provide actionable insights across any timeframe.
1. Technical Indicators:
This module combines essential trend-following and market momentum tools:
VWAP (Volume Weighted Average Price): Shows the average price weighted by volume, helping traders identify key support/resistance levels. Customizable color allows easy chart visibility.
EMAs (Exponential Moving Averages): Two EMAs (fast and long) track short-term and long-term price trends. Traders can adjust lengths and colors for personalized analysis.
Parabolic SAR: Highlights potential trend reversals with dots above/below candles. Step and maximum settings allow fine-tuning for sensitivity.
S2F Bands (Stock-to-Flow): A dynamic band system representing mid, upper, and lower levels derived from EMA. Useful for identifying overbought/oversold zones.
Logarithmic Growth Channel (LGC): Provides logarithmic regression channels, highlighting long-term price structure and growth trends. Adjustable length and band colors.
Linear Regressions: Two regression lines (short and long) detect trend directions and deviations over customizable periods.
Liquidity Zones: Highlights recent highs/lows over a defined lookback period, showing potential support/resistance clusters.
SMC Markers (Swing Market Context): Marks pivot highs and lows using visual labels, helping identify swing points and trend continuation patterns.
2. Market Levels:
Track weekly and Monday high/low levels for precise intraday and swing trading decisions:
Weekly Levels: Highlight the previous week’s high and low for reference.
Monday Levels: Focus on the day’s opening range, particularly useful for weekly breakout strategies.
3. Session Boxes (UTC):
Visual boxes mark major trading sessions (London, New York) in UTC time:
London Session Box: Highlights market activity between 08:00–16:30 UTC.
New York Session Box: Highlights market activity between 13:30–20:00 UTC.
Boxes automatically adjust to session highs and lows for clear intraday structure visualization.
4. Vertical Session Lines (Turkey Time – UTC+3):
These vertical lines provide an easy-to-read visualization of key market opens and closes:
US (NYSE), EU (LSE), JP (TSE), CN (SSE) lines: Color-coded and labeled, showing market opening and closing times in Turkish local time.
Ideal for identifying session overlaps and liquidity spikes.
5. AlphaTrend Module:
The AlphaTrend module is a dynamic trend-following system offering both visual guidance and trade signals:
Trend Calculation: Uses ATR and RSI/MFI logic to determine dynamic trend levels.
Signals: Generates BUY and SELL markers based on trend crossovers.
Customizable Settings: Multiplier, period, source input, and volume data modes allow tailored sensitivity.
Visuals: Filled areas between main and lag lines highlight trend direction, making it easy to interpret market bias at a glance.
Alerts: Includes multiple alert conditions such as potential and confirmed BUY/SELL, and price crossovers, suitable for automated notifications.
Usage & Benefits:
All modules have on/off toggles in the input panel, allowing users to customize the chart view without losing performance.
Color-coded visuals, session boxes, and trend channels improve readability, especially during high volatility.
Suitable for day trading, swing trading, and long-term analysis due to multi-timeframe adaptability.
The combination of trend indicators, liquidity zones, and session analysis provides a holistic view of market structure.
Alerts enable traders to automate monitoring without constantly staring at the chart.
Conclusion:
VaCs Pro Max by CS (V9) is designed for both professional and semi-professional traders who want an all-inclusive, visually intuitive, and highly configurable TradingView indicator. It merges classical technical indicators with modern trend and session analysis tools, making it an indispensable tool for informed trading decisions.

Money Flow Matrix This comprehensive indicator is a multi-faceted momentum and volume oscillator designed to identify trend strength, potential reversals, and market confluence. It combines a volume-weighted RSI (Money Flow) with a double-smoothed momentum oscillator (Hyper Wave) to filter out noise and provide high-probability signals.
Core Components
1. Money Flow (The Columns) This is the backbone of the indicator. It calculates a normalized RSI and weights it by relative volume.
Green Columns: Positive money flow (Buying pressure).
Red Columns: Negative money flow (Selling pressure).
Neon Colors (Overflow): When the columns turn bright Neon Green or Neon Red, the Money Flow has breached the dynamic Bollinger Band thresholds. This indicates an extreme overbought or oversold condition, suggesting a potential climax in the current move.
2. Hyper Wave (The Line) This is a double-smoothed Exponential Moving Average (EMA) derived from price changes. It acts as the "signal line" for the system. It is smoother than standard RSI or MACD, reducing false signals during choppy markets.
Green Line: Momentum is increasing.
Red Line: Momentum is decreasing.
3. Confluence Zones (Background) The background color changes based on the agreement between Money Flow and Hyper Wave.
Green Background: Both Money Flow and Hyper Wave are bullish. This represents a high-probability long environment.
Red Background: Both Money Flow and Hyper Wave are bearish. This represents a high-probability short environment.
Signal Guide
The Matrix provides three tiers of signals, ranging from early warnings to confirmation entries.
1. Warning Dots (Circles) These appear when the Hyper Wave crosses specific internal levels (-30/30).
Green Dot: Early warning of a bullish rotation.
Red Dot: Early warning of a bearish rotation.
Usage: These are not immediate entry signals but warnings to tighten stop-losses or prepare for a reversal.
2. Major Crosses (Triangles) These occur when Money Flow crosses the zero line, confirmed by momentum direction.
Green Triangle Up: Major Buy Signal (Money Flow crosses above 0).
Red Triangle Down: Major Sell Signal (Money Flow crosses below 0).
Usage: These are the primary trend-following entry signals.
3. Divergences (Labels "R" and "H") The script automatically detects discrepancies between Price action and the Hyper Wave oscillator.
"R" (Regular Divergence): Indicates a potential Reversal.
Bullish R: Price makes a lower low, but Oscillator makes a higher low.
Bearish R: Price makes a higher high, but Oscillator makes a lower high.
"H" (Hidden Divergence): Indicates a potential Trend Continuation.
Bullish H: Price makes a higher low, but Oscillator makes a lower low.
Bearish H: Price makes a lower high, but Oscillator makes a higher high.
Dashboard (Confluence Meter)
Located in the bottom right of the chart, the dashboard provides a snapshot of the current candle's status. It calculates a score based on three factors:
Is Money Flow positive?
Is Hyper Wave positive?
Is Hyper Wave trending up?
Readings:
STRONG BUY: All metrics are bullish.
WEAK BUY: Mixed metrics, but leaning bullish.
NEUTRAL: Metrics are conflicting.
WEAK/STRONG SELL: Bearish equivalents of the buy signals.
Trading Strategies
Strategy A: The Trend Rider
Entry: Wait for a Green Triangle (Major Buy).
Confirmation: Ensure the Background is highlighted Green (Confluence).
Exit: Exit when the background turns off or a Red Warning Dot appears.
Strategy B: The Reversal Catch
Setup: Look for a Neon Red Column (Overflow/Oversold).
Trigger: Wait for a Green "R" Label (Regular Bullish Divergence) or a Green Warning Dot.
Confirmation: Wait for the Hyper Wave line to turn green.
Strategy C: The Pullback (Continuation)
Context: The market is in a strong trend (Green Background).
Trigger: Price pulls back, but a Green "H" Label (Hidden Bullish Divergence) appears.
Action: Enter in the direction of the original trend.
Settings Configuration
The code includes tooltips for all inputs to assist with configuration.
Money Flow Length: Adjusts the sensitivity of the volume calculation. Lower numbers are faster but noisier; higher numbers are smoother.
Threshold Multiplier: Controls the "Neon" overflow bars. Increasing this (e.g., to 2.5 or 3.0) will result in fewer, more extreme signals.
Divergence Lookback: Determines how many candles back the script looks to identify pivots. Increase this number to find larger, macro divergences.
Disclaimer
This source code and the accompanying documentation are for educational and informational purposes only. They do not constitute financial, investment, or trading advice.

RCV Essentials════════════════════════════════════════════
RCV ESSENTIALS - MULTI-TIMEFRAME & SESSION ANALYSIS TOOL
════════════════════════════════════════════
📊 WHAT THIS INDICATOR DOES
This professional-grade indicator combines two powerful analysis modules:
1. TRADING SESSION TRACKER - Visualizes high/low ranges for major global market sessions (NY Open, London Open, Asian Session, etc.)
2. MULTI-TIMEFRAME CANDLE DISPLAY - Shows up to 8 higher timeframes simultaneously on your chart (15m, 30m, 1H, 4H, 1D, 1W, 1M, 3M)
════════════════════════════════════════════
🎯 KEY FEATURES
════════════════════════════════════════════
TRADING SESSIONS MODULE:
✓ Track up to 6 custom trading sessions simultaneously
✓ Real-time high/low range detection during active sessions
✓ Pre-configured for NYO (7-9am), LNO (2-3am), Asian Session (4:30pm-12am)
✓ 60+ global timezone options
✓ Customizable colors, labels, and transparency
✓ Daily divider lines (optional Sunday skip for traditional markets)
✓ Only displays on ≤30m timeframes for optimal clarity
MULTI-TIMEFRAME CANDLES MODULE:
✓ Display 1-8 higher timeframes with up to 10 candles each
✓ Real-time candle updates (non-repainting)
✓ Fully customizable colors (separate bullish/bearish for body/border/wick)
✓ Adjustable candle width, spacing, and positioning
✓ Smart label system (top/bottom/both, aligned or follow candles)
✓ Automatic timeframe validation (only shows TFs higher than chart)
✓ Memory-optimized with automatic cleanup
════════════════════════════════════════════
🔧 HOW IT WORKS
════════════════════════════════════════════
TECHNICAL IMPLEMENTATION:
Session Tracking Algorithm:
• Detects session start/end using time() function with timezone support
• Continuously monitors and updates high/low during active session
• Finalizes range when session ends using var persistence
• Draws boxes using real-time bar_index positioning
• Maintains session ranges across multiple days for reference
Multi-Timeframe System:
• Uses ta.change(time()) detection to identify new MTF candle formation
• Constructs candles using custom Type definitions (Candle, CandleSet, Config)
• Stores OHLC data in arrays with automatic size management
• Renders using box objects (bodies) and line objects (wicks)
• Updates current candle every tick; historical candles remain static
• Calculates dynamic positioning based on user settings (offset, spacing, width)
Object-Oriented Architecture:
• Custom Type "Candle" - Stores OHLC values, timestamps, visual elements
• Custom Type "CandleSet" - Manages arrays of candles + settings per timeframe
• Custom Type "Config" - Centralizes all display configuration
• Efficient memory management via unshift() for new candles, pop() for old
Performance Optimizations:
• var declarations minimize recalculation overhead
• Conditional execution (sessions only on short timeframes)
• Maximum display limits prevent excessive object creation
• Timeframe validation at barstate.isfirst reduces redundant checks
════════════════════════════════════════════
📈 HOW TO USE
════════════════════════════════════════════
SETUP:
1. Add indicator to chart (works best on 1m-30m timeframes)
2. Open Settings → "Trading Sessions" group
- Enable desired sessions (NYO, LNO, AS, or custom)
- Select your timezone from 60+ options
- Adjust colors and transparency
3. Open Settings → "Multi-TF Candles" group
- Enable timeframes (TF1-TF8)
- Configure each timeframe and display count
- Customize colors and layout
READING THE CHART:
• Session boxes show high/low ranges during active sessions
• MTF candles display to the right of current price
• Labels identify each timeframe (15m, 1H, 4H, etc.)
• Real-time updates on the most recent MTF candle
TRADING APPLICATIONS:
Session Breakout Strategy:
→ Identify session high/low (e.g., Asian session 16:30-00:00)
→ Wait for break above/below range
→ Confirm with higher timeframe candle close
→ Enter in breakout direction, stop at opposite side of range
Multi-Timeframe Confirmation:
→ Spot setup on primary chart (e.g., 5m)
→ Verify 15m, 1H, 4H candles align with trade direction
→ Only take trades where higher TFs confirm
→ Exit when higher TF candles show reversal
Combined Session + MTF:
→ Asian session establishes range overnight
→ London Open breaks Asian high
→ Confirm with bullish 15m + 1H candles
→ Enter long with stop below Asian high
════════════════════════════════════════════
🎨 ORIGINALITY & INNOVATION
════════════════════════════════════════════
What makes this indicator original:
1. INTEGRATED DUAL-MODULE DESIGN
Unlike separate session or MTF indicators, this combines both in a single performance-optimized script, enabling powerful correlation analysis between session behavior and timeframe structure.
2. ADVANCED RENDERING SYSTEM
Uses custom Pine Script v5 Types with dynamic box/line object management instead of basic plot functions. This enables:
• Precise visual control over positioning and spacing
• Real-time updates without repainting
• Efficient memory handling via automatic cleanup
• Support for 8 simultaneous timeframes with independent settings
3. INTELLIGENT SESSION TRACKING
The algorithm continuously recalculates ranges bar-by-bar during active sessions, then preserves the final range. This differs from static zone indicators that simply draw fixed boxes at predefined levels.
4. MODULAR ARCHITECTURE
Custom Type definitions (Candle, CandleSet, Config) create extensible, maintainable code structure while supporting complex multi-timeframe operations with minimal performance impact.
5. PROFESSIONAL FLEXIBILITY
Extensive customization: 6 configurable sessions, 8 timeframe slots, 60+ timezones, granular color/sizing/spacing controls, multiple label positioning modes—adaptable to any market or trading style.
6. SMART VISUAL DESIGN
Automatic timeframe validation, dynamic label alignment options, and intelligent spacing calculations ensure clarity even with multiple timeframes displayed simultaneously.
════════════════════════════════════════════
⚙️ CONFIGURATION OPTIONS
════════════════════════════════════════════
TRADING SESSIONS:
• Session 1-6: On/Off toggles
• Time Ranges: Custom start-end times
• Labels: Custom text for each session
• Colors: Individual color per session
• Timezone: 60+ options (Americas, Europe, Asia, Pacific, Africa)
• Range Transparency: 0-100%
• Outline: Optional border
• Label Display: Show/hide session names
• Daily Divider: Dotted lines at day changes
• Skip Sunday: For traditional markets vs 24/7 crypto
MULTI-TF CANDLES:
• Timeframes 1-8: Enable/disable individually
• Timeframe Selection: Any TF (seconds to months)
• Display Count: 1-10 candles per timeframe
• Bullish Colors: Body/Border/Wick (independent)
• Bearish Colors: Body/Border/Wick (independent)
• Candle Width: 1-10+ bars
• Right Margin: 0-200+ bars from edge
• TF Spacing: Gap between timeframe groups
• Label Color: Any color
• Label Size: Tiny/Small/Normal/Large/Huge
• Label Position: Top/Bottom/Both
• Label Alignment: Follow Candles or Align
════════════════════════════════════════════
📋 TECHNICAL SPECIFICATIONS
════════════════════════════════════════════
• Pine Script Version: v5
• Chart Overlay: True
• Max Boxes: 500
• Max Lines: 500
• Max Labels: 500
• Max Bars Back: 5000
• Update Frequency: Real-time (every tick)
• Timeframe Compatibility: Chart TF must be lower than selected MTFs
• Session Display: Activates only on ≤30 minute timeframes
• Memory Management: Automatic cleanup via array operations

RSI adaptive zones [AdaptiveRSI]This script introduces a unified mathematical framework that auto-scales oversold/overbought and support/resistance zones for any period length. It also adds true RSI candles for spotting intrabar signals.
Built on the Logit RSI foundation, this indicator converts RSI into a statistically normalized space, allowing all RSI lengths to share the same mathematical footing.
What was once based on experience and observation is now grounded in math.
✦ ✦ ✦ ✦ ✦
💡 Example Use Cases
RSI(14): Classic overbought/oversold signals + divergence
Support in an uptrend using RSI(14)
Range breakouts using RSI(21)
Short-term pullbacks using RSI(5)
✦ ✦ ✦ ✦ ✦
THE PAST: RSI Interpretation Required Multiple Rulebooks
Over decades, RSI practitioners discovered that RSI behaves differently depending on trend and lookback length:
• In uptrends, RSI tends to hold higher support zones (40–50)
• In downtrends, RSI tends to resist below 50–60
• Short RSIs (e.g., RSI(2)) require far more extreme threshold values
• Longer RSIs cluster near the center and rarely reach 70/30
These observations were correct — but lacked a unifying mathematical explanation.
✦ ✦ ✦ ✦ ✦
THE PRESENT: One Framework Handles RSI(2) to RSI(200)
Instead of using fixed thresholds (70/30, 90/10, etc.), this indicator maps RSI into a normalized statistical space using:
• The Logit transformation to remove 0–100 scale distortion
• A universal scaling based on 2/√(n−1) scaling factor to equalize distribution shapes
As a result, RSI values become directly comparable across all lookback periods.
✦ ✦ ✦ ✦ ✦
💡 How the Adaptive Zones Are Calculated
The adaptive framework defines RSI zones as statistical regimes derived from the Logit-transformed RSI .
Each boundary corresponds to a standard deviation (σ) threshold, scaled by 2/√(n−1), making RSI distributions comparable across periods.
This structure was inspired by Nassim Nicholas Taleb’s body–shoulders–tails regime model:
Body (±0.66σ) — consolidation / equilibrium
Shoulders (±1σ to ±2.14σ) — trending region
Tails (outside of ±2.14σ) — rare, high-volatility behavior
Transitions between these regimes are defined by the derivatives of the position (CDF) function :
• ±1σ → shift from consolidation to trend
• ±√3σ → shift from trend to exhaustion
Adaptive Zone Summary
Consolidation: −0.66σ to +0.66σ
Support/Resistance: ±0.66σ to ±1σ
Uptrend/Downtrend: ±1σ to ±√3σ
Overbought/Oversold: ±√3σ to ±2.14σ
Tails: outside of ±2.14σ
✦ ✦ ✦ ✦ ✦
📌 Inverse Transformation: From σ-Space Back to RSI
A final step is required to return these statistically normalized boundaries back into the familiar 0–100 RSI scale. Because the Logit transform maps RSI into an unbounded real-number domain, the inverse operation uses the hyperbolic tangent function to compress σ-space back into the bounded RSI range.
RSI(n) = 50 + 50 · tanh(z / √(n − 1))
The result is a smooth, mathematically consistent conversion where the same statistical thresholds maintain identical meaning across all RSI lengths, while still expressing themselves as intuitive RSI values traders already understand.
✦ ✦ ✦ ✦ ✦
Key Features
Mathematically derived adaptive zones for any RSI period
Support/resistance zone identification for trend-aligned reversals
Optional OHLC RSI bars/candles for intrabar zone interactions
Fully customizable zone visibility and colors
Statistically consistent interpretation across all markets and timeframes
Inputs
RSI Length — core parameter controlling zone scaling
RSI Display : Line / Bar / Candle visualization modes
✦ ✦ ✦ ✦ ✦
💡 How to Use
This indicator is a framework , not a binary signal generator.
Start by defining the question you want answered, e.g.:
• Where is the breakout?
• Is price overextended or still trending?
• Is the correction ending, or is trend reversing?
Then:
Choose the RSI length that matches your timeframe
Observe which adaptive zone price is interacting with
Interpret market behavior accordingly
Example: Long-Term Trend Assesment using RSI(200)
A trader may ask: "Is this a long term top?"
Unlikely, because RSI(200) holds above Resistance zone , therefore the trend remains strong.
✦ ✦ ✦ ✦ ✦
👉 Practical tip:
If you used to overlay weekly RSI(14) on a daily chart (getting a line that waits 5 sessions to recalculate), you can now read the same long-horizon state continuously : set RSI(70) on the daily chart (~14 weeks × 5 days/week = 70 days) and let the adaptive zones update every bar .
Note: It won’t be numerically identical to the weekly RSI due to lookback period used, but it tracks the same regime on a standardized scale with bar-by-bar updates.
✦ ✦ ✦ ✦ ✦
Note: This framework describes statistical structure, not prediction. Use as part of a complete trading approach. Past behavior does not guarantee future outcomes.
framework ≠ guaranteed signal
---
Attribution & License
This indicator incorporates:
• Logit transformation of RSI
• Variance scaling using 2/√(n−1)
• Zone placement derived from Taleb’s body–shoulders–tails regime model and CDF derivatives
• Inverse TANH(z) transform for mapping z-scores back into bounded RSI space
Released under CC BY-NC-SA 4.0 — free for non-commercial use with credit.
© AdaptiveRSI

DarkPool's RSi DarkPool's RSi is an enhanced momentum oscillator designed to automatically detect structural discrepancies between price action and the Relative Strength Index. While retaining the standard RSI visualization, this script overlays advanced divergence recognition logic to identify potential trend reversals.
The tool identifies pivot points in real-time and compares recent peaks and valleys against historical data. When the momentum of the RSI contradicts the direction of price action, the indicator highlights these events using dynamic trendlines, shape markers, and background coloring. A built-in dashboard table provides an immediate status check of active divergence signals.
Key Features
Automated Divergence Detection: Automatically spots both Regular Bullish and Regular Bearish divergences based on pivot lookback settings.
Dynamic Visuals: Draws physical lines connecting RSI peaks or troughs to visualize the divergence angle, alongside triangle markers indicating the signal direction.
Active Status Dashboard: A data table located on the chart monitors the current state of the market, flagging signals as "Active" when detected.
Standard RSI Overlay: Includes standard Overbought (70) and Oversold (30) reference lines for traditional momentum trading.
How to Use
1. Reading the Standard RSI The black line represents the Relative Strength Index.
Overbought (Above 70): Suggests the asset may be overvalued and due for a pullback.
Oversold (Below 30): Suggests the asset may be undervalued and due for a bounce.
Midline (50): Acts as a trend filter; values above 50 indicate bullish momentum, while values below 50 indicate bearish momentum.
2. Trading Divergences The primary function of this tool is to identify reversal setups.
Bullish Divergence (Green Triangle/Line): Occurs when Price makes a Lower Low, but the RSI makes a Higher Low. This indicates that selling momentum is exhausting and a price increase may follow.
Bearish Divergence (Red Triangle/Line): Occurs when Price makes a Higher High, but the RSI makes a Lower High. This indicates that buying momentum is fading and a price decrease may follow.
3. Visual Aids
Lines: The script draws solid lines directly on the RSI pane connecting the relevant pivot points to confirm the divergence slope.
Background Color: When a divergence is detected, the background of the indicator pane will highlight briefly (Green for Bullish, Red for Bearish) to draw attention to the new signal.
4. The Dashboard A small table in the bottom right corner tracks the status of the signals.
Status: ACTIVE: A divergence has been detected within the last 10 bars.
Status: None: No recent divergence patterns have been identified.
Disclaimer This indicator is provided for educational and informational purposes only. It does not constitute financial advice, investment recommendations, or a guarantee of future results. Trading cryptocurrencies and financial markets involves a high level of risk. Always perform your own due diligence before making any trading decisions.

Grok/Claude Quantum Signal Pro * Grok/Claude X Series*Grok/Claude Quantum Signal Pro
This is a TradingView indicator focused on catching momentum reversals at price extremes, with a sophisticated divergence detection system as its standout feature. The "Quantum" branding is marketing flair — under the hood, it's a well-structured combination of momentum oscillators, volatility bands, and divergence analysis working together to identify high-probability turning points.
Core Philosophy
The indicator asks: "Is price at an extreme level where momentum is exhausted, and is there evidence that a reversal or continuation is likely?"
It approaches this by requiring multiple confirming factors before generating a signal. Price must be at a band extreme, momentum indicators must be at extreme readings, and the market must be trending (not choppy). Optionally, it can also require RSI divergence and volume confirmation.
The Dynamic Envelope Bands
The foundation is an adaptive channel built around a moving average (EMA or SMA, user's choice). The bands extend above and below this centerline using ATR (Average True Range) multiplied by a dynamic factor.
What makes these bands "adaptive" is that the multiplier adjusts based on ADX — when trends are stronger, the bands widen to accommodate larger directional moves. In weaker trend environments, the bands stay tighter. This helps the bands stay relevant across different market conditions rather than being too loose in quiet markets or too tight during volatile trends.
The centerline itself is color-coded based on its slope: green when rising, red when falling, yellow when flat. This gives immediate visual feedback on short-term directional bias.
The Multi-Layer Filter System
Signals must pass through several filters before being displayed. Here's what each filter does:
FilterWhat It ChecksDefault StateADX TrendingIs ADX above threshold (20)? Avoids signals in choppy, directionless marketsRequired (always on)RSI ExtremesIs RSI oversold (<30) for buys, overbought (>70) for sells?Required (always on)Fisher TransformIs Fisher below -2.0 for buys, above +2.0 for sells? Confirms momentum exhaustionRequired (always on)Trend AlignmentIs price above/below the trend EMA in the right direction?Optional (off by default)Volume SurgeIs current volume significantly above average?Optional (off by default)DivergenceIs there an active RSI divergence pattern?Optional (off by default)
The Fisher Transform
The Fisher Transform is a lesser-known oscillator that converts price into a Gaussian normal distribution, making extreme values much more pronounced. When Fisher readings hit +2.0 or -2.0, it indicates statistically significant momentum exhaustion. By requiring both RSI and Fisher to be at extremes simultaneously, the indicator filters out many false signals that would occur using just one oscillator.
The Detrended Price Oscillator (DPO)
The indicator also calculates DPO, which removes the trend component from price to show where current price sits relative to a historical average. This is displayed in the info panel as a percentage — positive values mean price is extended above its typical level, negative values mean it's extended below. This helps gauge how "stretched" price is from its mean.
RSI Divergence Detection — The Core Feature
This is where the indicator really shines. It detects both regular divergences (reversal signals) and hidden divergences (continuation signals).
Regular Divergences
Regular divergences suggest potential reversals:
Regular Bullish Divergence: Price makes a lower low, but RSI makes a higher low. This indicates that despite price falling further, selling momentum is actually weakening — a potential bottom signal. These are marked with cyan/light blue solid lines on the chart.
Regular Bearish Divergence: Price makes a higher high, but RSI makes a lower high. Despite price rising further, buying momentum is weakening — a potential top signal. Also marked with cyan solid lines.
Hidden Divergences
Hidden divergences suggest trend continuation (often overlooked by traders):
Hidden Bullish Divergence: Price makes a higher low, but RSI makes a lower low. The uptrend is healthy (higher lows in price), but RSI dipped lower, creating a "hidden" bullish setup that often precedes another leg up. Marked with purple dashed lines.
Hidden Bearish Divergence: Price makes a lower high, but RSI makes a higher high. The downtrend structure is intact, but RSI bounced higher, suggesting another leg down is coming. Also marked with purple dashed lines.
The divergence detection uses pivot points (local highs and lows) to identify the comparison points. Users can adjust the pivot lookback (how many bars to use for pivot identification) and the maximum lookback window for finding divergence pairs.
Signal Generation Logic
A buy signal fires when all these conditions align:
Market is trending (ADX above threshold)
RSI is in oversold territory (below 30)
Fisher Transform is oversold (below -2.0)
Plus any optional filters that are enabled
A sell signal requires the mirror conditions: trending market, overbought RSI (above 70), and overbought Fisher (above +2.0).
There's also a cooldown mechanism requiring at least 5 bars between signals to prevent clustering.
Visual Elements
The indicator provides layered visual information:
Adaptive bands with color-coded centerline (green/red/yellow based on slope)
Cloud fill between bands, colored by trend direction
Signal arrows (triangles) at entry points
Price labels showing exact entry price at each signal
Divergence lines connecting the pivot points that form the divergence pattern
Divergence labels ("REG BULL", "HID BEAR", etc.) with tooltips explaining what each pattern means
Info panel showing current status of all indicators and any active divergences
The Info Panel
The top-right panel displays real-time status for all the indicator components. Each row is color-coded to show whether that factor is currently bullish, bearish, or neutral. The last two rows specifically track whether regular and hidden divergences are currently active, making it easy to see at a glance if a divergence pattern has recently formed.
Alert System
The indicator includes a comprehensive alert system covering not just buy/sell signals, but also "setup building" conditions (when RSI and Fisher are at extremes but ADX hasn't confirmed yet), market regime changes (trending to ranging and vice versa), and individual divergence detections for all four types.
Summary
This indicator is designed for traders who want to catch reversals at price extremes with multiple layers of confirmation. Its strength lies in the divergence detection system, which identifies both potential reversals and trend continuation setups. The modular filter system lets users dial in their preferred level of strictness — from the default configuration that requires just the core filters, to a highly selective mode requiring trend alignment, volume confirmation, and divergence all at once. It's best suited for swing trading or identifying key turning points on higher timeframes.
