BO - Bar M15 2/3 SignalBO - Bar M15 2/3 Signal show the signal to trade Binary Option with rule below:
A. Indicator
* Bollinger Band (20,2): avoid waterfall
B. Rule of Signal
1. Rule1: Split Bar M15 to 3 part and load them on M5 chart (recommend use M5 IDC chart)
2. Rule 2: Delay 10' after bar M15 open => wait for price's pattern
3. Rule 3: Put Signal row 30-32
* Delay 10' after bar M15 open.
* Direction of 1/3 and 2/3 Bar M15 is upward
* close of 2/3 Bar M15 below upper band Bb(20,2) on M5 chart => avoid strong buy
4. Rule 4: Call Signal row 36-38
* Delay 10' after bar M15 open.
* Direction of 1/3 and 2/3 Bar M15 is downward
* close of 2/3 Bar M15 above lower band Bb(20,2) on M5 chart => avoid strong sell
C. Recommend Expiry time: Bar M15 close
* We try to catch the shadow of Bar M15 but dont trade when price run on the upper or lower band of BB(20,2,M5)
ابحث في النصوص البرمجية عن "黄金近20年走势"

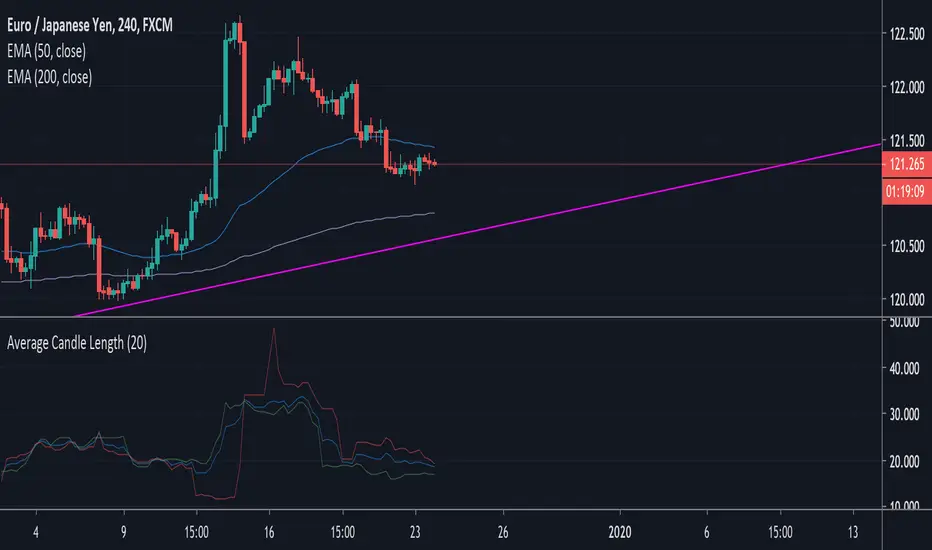
Average Candle Length 2.0This script will tell you the following:
• Average length of all the candles (wick to wick) for the last 20 candles
-- shown in blue
• Average length of bull (green) candles (wick to wick) for the last 20 candles
-- shown in green
• Average length of bear (red) candles (wick to wick) for the last 20 candles
-- shown in red
___________________________________________
Inputs:
• # of Candles to analyze (default = 20)
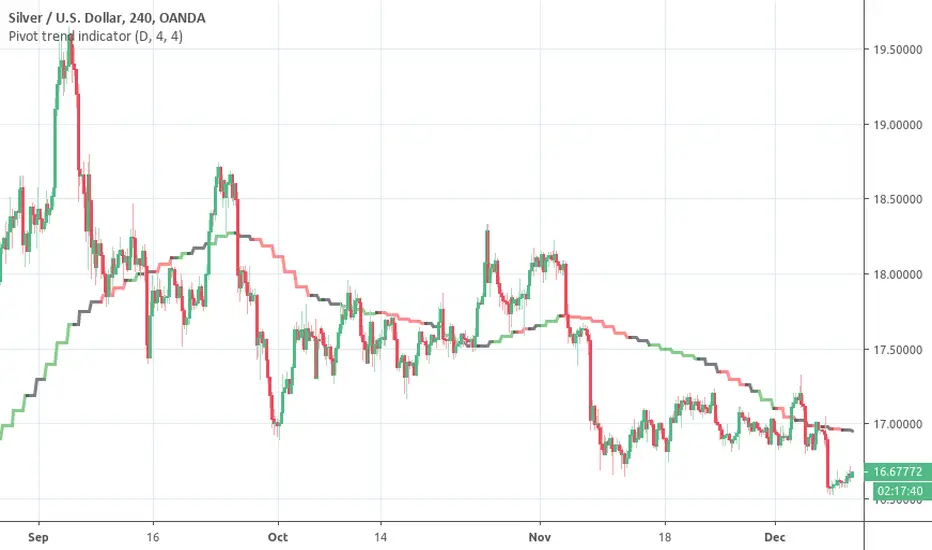
Pivot trend indicatorThis is a LAGGING indicator which can provide a good indication of trend. It require a certain (configurable) number of candles to have closed before it can determine whether a pivot has formed.
It provides a 20 period SMA for the timeframe of your choice which is color coded to show the trend according to confirmed pivots.
Anticipated usage:
Long / Short bias is determined by pivot trend
Trader seeks entries according to their strategy
Black consolidation areas may trigger a re-evaluation of the trade and can serve as good profit taking areas
The SMA colors:
Green -> Higher highs & Higher lows
Red -> Lower highs & Lowers lows
Black -> No clear trend from the pivots
Why the 20 SMA?
Feel free to adjust it for your purposes. I personally find that using a higher time frame 20 SMA is a better indication of trend than longer period MAs on shorter time frames. This can be seen from comparing the 20 daily SMA and 200 hourly SMA.
Pivot adjustment
The pivots use the selected time frame (not) the MA trend time frame. You can specify the left and right candles required to confirm a pivot
VIX reversion-Buschi
English:
A significant intraday reversion (commonly used: 3 points) on a high (over 20 points) S&P 500 Volatility Index (VIX) can be a sign of a market bottom, because there is the assumption that some of the "big guys" liquidated their options / insurances because the worst is over.
This indicator shows these reversions (3 points as default) when the VIX was over 20 points. The character "R" is then shown directly over the daily column, the VIX need not to be loaded explicitly.
Deutsch:
Eine deutliche Intraday-Umkehr (3 Punkte im Normalfall) bei einem hohen (über 20 Punkte) S&P 500 Volatility Index (VIX) kann ein Zeichen für eine Bodenbildung im Markt sein, weil möglicherweise einige "große Jungs" ihre Optionen / Versicherungen auflösen, weil das schlimmste vorbei ist.
Dieser Indikator zeigt diese Umkehr (Standardwert: 3 Punkte), wenn der VIX vorher über 20 Punkte lag. Der Buchstabe "R" wird dabei direkt über dem Tagesbalken angezeigt, wobei der VIX nicht explizit geladen werden muss.

Triple Moving Average HeatmapHi everyone
I didn't publish on Friday because I was working on an Expert Advisor in MT4. The day I don't publish, some scripts spamming guys published many (not useful) scripts the same to kick me out of the TOP #1 ranking.
So what I'm going to do about it? crying or sharing more quality scripts than before? :)
I guess you know the answer :) I'm gonna share a few quality scripts that I have in my library. I noticed that you guys tend to like more the scripts useful for your trading actually making you money rather than a copy-paste (of another copy-paste)
Alright, enough for the trolling now let's introduce the Three MA heatmap which is an upgrade of that script : MA-heatmap-Double-cross-edition/
The challenge was to keep the heatmap not rolling and to make it match with the MA cross. I did it using this
```
since_ma_buy = barssince(macrossover)
since_ma_sell = barssince(macrossunder)
heatmap_color() =>
since_ma_buy < since_ma_sell ? color.new(color.green, 20) : since_ma_buy > since_ma_sell ? color.new(color.red, 20) : na
```
This is a technique that I found after drinking three glasses of red wine (#french) to keep the heatmap stable and not rolling.
To get what I'm saying I invite you to replace the piece of code above by what everyone would normally do
```
heatmap_color() =>
macrossunder() ? color.new(color.green, 20) : macrossover() ? color.new(color.red, 20) : na
```
Ah and I'm not done sharing for the day, a few scripts are coming also after that one and tonight !!!!! I want to live in a world where you guys can enjoy quality scripts (mostly) :)
PS
____________________________________________________________
Feel free to hit the thumbs up as it shows me that I'm not doing this for nothing and will motivate to deliver more quality content in the future.
- I'm an officially approved PineEditor/LUA/MT4 approved mentor on codementor. You can request a coaching with me if you want and I'll teach you how to build kick-ass indicators and strategies
Jump on a 1 to 1 coaching with me
- You can also hire for a custom dev of your indicator/strategy/bot/chrome extension/python

Palex 2.0Atualização do SETUP do saudoso Professor Alexandre Fernandes "Palex"
- Bandas de Bolliger (Standard) =
*Banda Superior = Média Móvel Simples (20 dias) + (2 x Desvio Padrão de 20 dias)
*Banda Inferior = Média Móvel Simples (20 dias) – (2 x Desvio Padrão de 20 dias)
- EMA 9 (Média Móvel Exponencial)
- SMA 21 (Média Móvel Simples)
- SMA 200 (Média Móvel Simples) Clássica MA 200 períodos
- SMA 400 (Média Móvel Simples)
- EMA 400 (Média Móvel Exponencial)
- WILD (Média Móvel Welles Wilder)
O mesmo usado pelo nosso grande Mestre PALEX!
The 6 Line Death PunchIf you are looking to discover what trend you are in, you need to first what direction the price is going in...
I've been using and testing a mixture of EMA's and SMA's for a long time and I've found that these ones are by far the best.
EMA 3
EMA 8
MA 20
EMA 55
MA 100
MA 200
EMA 3 & 8 Crossover is a good method for confirming a coin going to the upside or to the downside.
EMA 8 is known as the Trigger Line (trademarked brand) as one of the fib numbers it shows good support or resistance of a trend.
MA 20 universal way of seeing trend direction in the stock market, works well with crypto too.
EMA 55, another trusty fib number. Works very well and could trade off that alone as support and resistance.
MA 100 and MA 200. Long ranged moving averages which govern the overall longer-term trend.
LONG ENTRY
Option 1 - 3/8 crossover
Option 2 - Candles above EMA 8
Option 3 - Candles above MA 20
Option 4 - Candles Above EMA 55.
SHORT ENTRY
Option 1 - 3/8 crossover
Option 2 - Candles below EMA 8
Option 3 - Candles below MA 20
Option 4 - Candles below EMA 55.

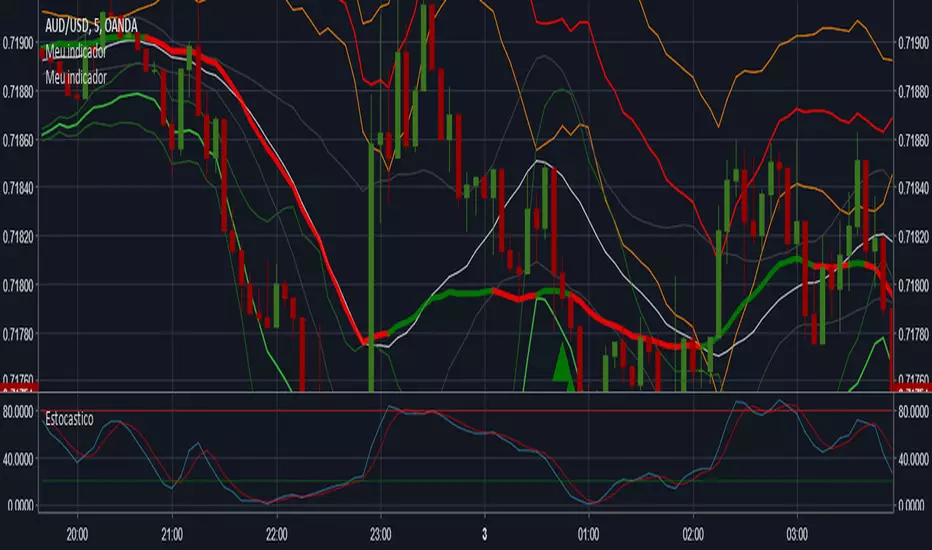
Signals for call and putSorry for the Google Translate English
Indicator for signals of call and put, using Bollinger bands (period 20, standard deviation 2.5), market trend of (sma, períod 100) and stochastic (period 20, %D 3).
I was overthrown but in pine scrip, the function "stoch()" no way to smooth (3). If anyone knows how to smooth inside the script, help me! Please.
With smoothed stochastic the hit rate grows a lot.
Português (Pt-Br)
Indicador de sinais de compra e venda, usando bandas de Bollinger (período de 20, desvio de 2,5), tendencia de mercado com (sma período 100) e estocástico (período 20, %D de 3).
Eu travei porque no pine script, a função "stoch()" não tem como aplicar a suavização (3). Se alguem souber como suavizar dentro do script, me ajude! Por favor.
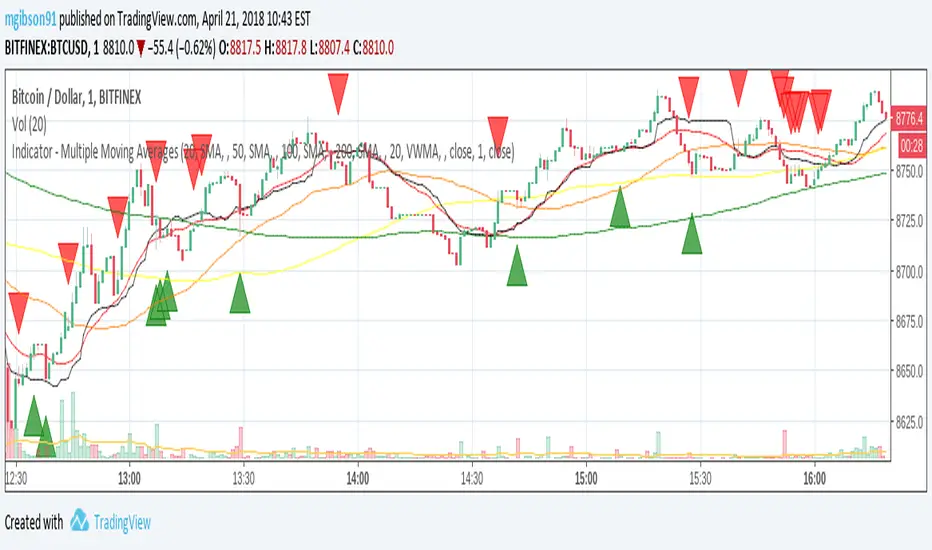
MG - Multiple Moving Averages & Candle Wick Alerts - 1.0Features:
- Each moving average has customizable length, type and source
- The ability to change the source of all moving averages with one input (changing an individual MA source will override the general for that MA)
- At a glance comparison of 20 SMA and 20 VWMA to gauge volume trend
- Wick alerts which can be toggled for each moving average.
- Bullish wick alerts are when the wick is the only part of the candle to drop below the moving average
- Bearish wick alerts are when the wick is the only part of the candle to reach above the moving average
- Simple candle closed alert if you want a notification, for example each hour.
Defaults: Four SMAs (20, 50, 100, 200) and a 20 VWMA .
Recommended Usage:
- Set the general source (sets the source of all moving averages) to 'low' when in an uptrend and 'high' in a downtrend to maximize Risk : Reward.
- Use Fibonacci levels, oscillators .etc for confluence
NOTE: The moving average component of this indicator is the same as the previous indicator ()
Indicator - Multiple Moving Averages 1.0Features:
- Each moving average has customizable length, type and source
- The ability to change the source of all moving averages with one input (changing an individual MA source will override the general for that MA)
- At a glance comparison of 20 SMA and 20 VWMA to gauge volume trend
Defaults: Four SMAs (20, 50, 100, 200) and a 20 VWMA.
Usage:
- Use Fibonacci levels, pivots .etc for confluence
- Personally, I like to set overall source to low in uptrends, to high in downtrends and then set alerts for when the price crosses any of the averages. Then pay particular attention to the candlesticks and other indicators.
TODO:
- Add alerts option so that it send alert on crossing up or down any alert lines.

XPloRR MA-Trailing-Stop StrategyXPloRR MA-Trailing-Stop Strategy
Long term MA-Trailing-Stop strategy with Adjustable Signal Strength to beat Buy&Hold strategy
None of the strategies that I tested can beat the long term Buy&Hold strategy. That's the reason why I wrote this strategy.
Purpose: beat Buy&Hold strategy with around 10 trades. 100% capitalize sold trade into new trade.
My buy strategy is triggered by the fast buy EMA (blue) crossing over the slow buy SMA curve (orange) and the fast buy EMA has a certain up strength.
My sell strategy is triggered by either one of these conditions:
the EMA(6) of the close value is crossing under the trailing stop value (green) or
the fast sell EMA (navy) is crossing under the slow sell SMA curve (red) and the fast sell EMA has a certain down strength.
The trailing stop value (green) is set to a multiple of the ATR(15) value.
ATR(15) is the SMA(15) value of the difference between the high and low values.
The scripts shows a lot of graphical information:
The close value is shown in light-green. When the close value is lower then the buy value, the close value is shown in light-red. This way it is possible to evaluate the virtual losses during the trade.
the trailing stop value is shown in dark-green. When the sell value is lower then the buy value, the last color of the trade will be red (best viewed when zoomed)(in the example, there are 2 trades that end in gain and 2 in loss (red line at end))
the EMA and SMA values for both buy and sell signals are shown as a line
the buy and sell(close) signals are labeled in blue
How to use this strategy?
Every stock has it's own "DNA", so first thing to do is tune the right parameters to get the best strategy values voor EMA , SMA, Strength for both buy and sell and the Trailing Stop (#ATR).
Look in the strategy tester overview to optimize the values Percent Profitable and Net Profit (using the strategy settings icon, you can increase/decrease the parameters)
Then keep using these parameters for future buy/sell signals only for that particular stock.
Do the same for other stocks.
Important : optimizing these parameters is no guarantee for future winning trades!
Here are the parameters:
Fast EMA Buy: buy trigger when Fast EMA Buy crosses over the Slow SMA Buy value (use values between 10-20)
Slow SMA Buy: buy trigger when Fast EMA Buy crosses over the Slow SMA Buy value (use values between 30-100)
Minimum Buy Strength: minimum upward trend value of the Fast SMA Buy value (directional coefficient)(use values between 0-120)
Fast EMA Sell: sell trigger when Fast EMA Sell crosses under the Slow SMA Sell value (use values between 10-20)
Slow SMA Sell: sell trigger when Fast EMA Sell crosses under the Slow SMA Sell value (use values between 30-100)
Minimum Sell Strength: minimum downward trend value of the Fast SMA Sell value (directional coefficient)(use values between 0-120)
Trailing Stop (#ATR): the trailing stop value as a multiple of the ATR(15) value (use values between 2-20)
Example parameters for different stocks (Start capital: 1000, Order=100% of equity, Period 1/1/2005 to now) compared to the Buy&Hold Strategy(=do nothing):
BEKB(Bekaert): EMA-Buy=12, SMA-Buy=44, Strength-Buy=65, EMA-Sell=12, SMA-Sell=55, Strength-Sell=120, Stop#ATR=20
NetProfit: 996%, #Trades: 6, %Profitable: 83%, Buy&HoldProfit: 78%
BAR(Barco): EMA-Buy=16, SMA-Buy=80, Strength-Buy=44, EMA-Sell=12, SMA-Sell=45, Strength-Sell=82, Stop#ATR=9
NetProfit: 385%, #Trades: 7, %Profitable: 71%, Buy&HoldProfit: 55%
AAPL(Apple): EMA-Buy=12, SMA-Buy=45, Strength-Buy=40, EMA-Sell=19, SMA-Sell=45, Strength-Sell=106, Stop#ATR=8
NetProfit: 6900%, #Trades: 7, %Profitable: 71%, Buy&HoldProfit: 2938%
TNET(Telenet): EMA-Buy=12, SMA-Buy=45, Strength-Buy=27, EMA-Sell=19, SMA-Sell=45, Strength-Sell=70, Stop#ATR=14
NetProfit: 129%, #Trade

EMA Indicators with BUY sell SignalCombine 3 EMA indicators into 1. Buy and Sell signal is based on
- Buy signal based on 20 Days Highest High resistance
- Sell signal based on 10 Days Lowest Low support
Input :-
1 - Short EMA (20), Mid EMA (50) and Long EMA (200)
2 - Resistance (20) = 20 Days Highest High line
3 - Support (10) = 10 Days Lowest Low line

Reversal_Detector//@version=6
indicator("상승 반전 탐지기 (Reversal Detector)", overlay=true)
// ==========================================
// 1. 설정 (Inputs)
// ==========================================
rsiLen = input.int(14, title="RSI 길이")
lbR = input.int(5, title="다이버전스 확인 범위 (오른쪽)")
lbL = input.int(5, title="다이버전스 확인 범위 (왼쪽)")
rangeUpper = input.int(60, title="RSI 과매수 기준")
rangeLower = input.int(30, title="RSI 과매도 기준")
// ==========================================
// 2. RSI 상승 다이버전스 계산 (핵심 로직)
// ==========================================
osc = ta.rsi(close, rsiLen)
// 피벗 로우(Pivot Low) 찾기: 주가의 저점
plFound = na(ta.pivotlow(osc, lbL, lbR)) ? false : true
// 다이버전스 조건 확인
// 1) 현재 RSI 저점이 이전 RSI 저점보다 높아야 함 (상승)
// 2) 현재 주가 저점이 이전 주가 저점보다 낮아야 함 (하락)
showBull = false
if plFound
// 이전 피벗 지점 찾기
oscLow = osc
priceLow = low
// 과거 데이터를 탐색하여 직전 저점과 비교
for i = 1 to 60
if not na(ta.pivotlow(osc, lbL, lbR) ) // 이전에 저점이 있었다면
prevOscLow = osc
prevPriceLow = low
// 다이버전스 조건: 가격은 더 떨어졌는데(Lower Low), RSI는 올랐을 때(Higher Low)
if priceLow < prevPriceLow and oscLow > prevOscLow and oscLow < rangeLower
showBull := true
break // 하나 찾으면 루프 종료
// ==========================================
// 3. 보조 조건 (MACD 골든크로스 & 이평선)
// ==========================================
= ta.macd(close, 12, 26, 9)
macdCross = ta.crossover(macdLine, signalLine) // MACD 골든크로스
ma5 = ta.sma(close, 5)
ma20 = ta.sma(close, 20)
maCross = ta.crossover(ma5, ma20) // 5일선이 20일선 돌파
// ==========================================
// 4. 시각화 (Plotting)
// ==========================================
// 1) 상승 다이버전스 발생 시 (강력한 바닥 신호)
plotshape(showBull,
title="상승 다이버전스",
style=shape.labelup,
location=location.belowbar,
color=color.red,
textcolor=color.white,
text="Bull Div\n(바닥신호)",
size=size.small,
offset=-lbR) // 과거 시점에 표시
// 2) MACD 골든크로스 (추세 확인용)
plotshape(macdCross and macdLine < 0, // 0선 아래에서 골든크로스 날 때만
title="MACD 골든크로스",
style=shape.triangleup,
location=location.belowbar,
color=color.yellow,
size=size.tiny,
text="MACD")
// 3) 이동평균선
plot(ma5, color=color.blue, title="5일선")
plot(ma20, color=color.orange, title="20일선")
// 알림 설정
alertcondition(showBull, title="상승 다이버전스 포착", message="상승 다이버전스 발생! 추세 반전 가능성")

Trinity CCI Pro PlusWhat It Is
Trinity CCI Pro Plus is an innovative overlay indicator that reimagines the classic Commodity Channel Index (CCI) by plotting its levels directly on the price chart. No more separate oscillator panel—instead, you get dynamic price-based bands and lines for instant momentum insights.
What You See on the Chart
Orange line: The CCI zero line (20-period SMA of typical price, hlc3)—acts as the baseline.
Aqua line: Dynamic upper band at CCI = +100 (overbought threshold).
Purple line: Dynamic lower band at CCI = -100 (oversold threshold).
Optional thick purple line: The extra SMA of CCI (14-period smooth) scaled back to price—serves as a signal line for crossovers.
Optional outer zones: ±200 bands (aqua/purple extensions) for extreme momentum levels, often added as dotted or filled areas to spot blow-off tops/bottoms.
Key Differences from Regular CCI
Standard CCI lives in a lower pane with fixed horizontal lines at +100, 0, and -100, forcing you to split your focus. This version overlays everything on price: the bands curve with market volatility, the zero line becomes a moving average, and the extra SMA/signal line integrates seamlessly for price-action trading. Plus, it naturally supports outer ±200 zones without extra coding, making extremes visually pop.
How Traders Use It
Momentum breakouts: Buy when price closes above the +100 aqua band (or +200 for aggressive entries); sell below -100 purple (or -200).
Mean reversion: Fade touches on the bands—take profits if price rejects the +100/-100 levels, or watch for exhaustion at ±200.
Trend bias: Price above orange zero = bullish filter; below = bearish. Use the extra SMA for confirmation (e.g., price crossing above it signals upside).
Crossover signals: Price vs. the thick purple SMA line—bullish above, bearish below—pairs perfectly with band breaks.
Range trading: Treat ±100 bands as dynamic support/resistance; outer ±200 zones highlight potential breakout setups.
This setup shines in trending markets (e.g., stocks or forex on 1H/daily charts), turning CCI into a one-glance channel system. Start with the defaults, add the ±200 and extra SMA via simple code tweaks, and backtest for your style—it's versatile and reduces screen clutter dramatically.
More Info
The 20 period MA is the original and still the most common setting for CCI, and it is exactly what the creator of the CCI, Donald Lambert, published it in 1980 with these exact parameters:
Length: 20 periods
Constant: 0.015 (to make CCI fall between +100 and –100 about 70–80 % of the time)
Typical Price: hlc3 (or sometimes (high + low + close)/3)
Deviation measure: Mean Deviation (not standard deviation)
So the “Trinity CCI Pro Plus” you are using is 100 % faithful to Lambert’s original design when the length is set to 20.

Volume Profile DeltaMap [MHA Finverse]Volume Profile DeltaMap with Session Analysis
SHORT DESCRIPTION (for listing)
Advanced Volume Profile indicator with Delta Analysis, Value Area, Volume Nodes, Imbalance Zones, and Multi-Session Profiles. Professional tool for institutional-style volume analysis and market structure understanding.
---
DETAILED DESCRIPTION
📊 OVERVIEW
The Volume Profile DeltaMap is a comprehensive institutional-grade indicator that visualizes volume distribution across price levels, revealing where the most significant trading activity occurred. Unlike traditional indicators that plot data over time, Volume Profile analyzes price levels to identify key support/resistance zones, equilibrium areas, and buyer/seller dominance.
This indicator combines multiple advanced features:
- Volume Profile Analysis with customizable bins
- Delta Heat Map showing buyer vs seller pressure
- Value Area (VAH/VAL) calculations
- High/Low Volume Node Detection
- Imbalance Zone Identification
- Multi-Session Profile Separation (Tokyo, London, NY, Sydney)
- Point of Control (POC) highlighting
---
🎯 KEY FEATURES
1. Volume Profile Core
- Divides price range into customizable bins (10-100 levels)
- Accumulates volume at each price level over a lookback period
- Displays volume distribution horizontally on the chart
- Configurable lookback period (default: 200 bars)
2. Delta Analysis & Heat Map
- Delta (Δ) : Measures the difference between buying and selling pressure
- Color-coded visualization :
- Green/Teal = Buyer dominance
- Red/Pink = Seller dominance
- Heat map intensity : Shows volume concentration with gradient colors
- Percentage labels : Displays exact buyer/seller ratios at each level
3. Point of Control (POC)
- Automatically identifies the price level with maximum volume
- Marked with cyan border and volume label
- Acts as a strong magnetic level where price tends to return
- Often serves as major support/resistance
4. Value Area (VAH/VAL)
- Value Area : Price range containing 70% of total volume (configurable 50-90%)
- VAH (Value Area High) : Upper boundary - resistance level
- VAL (Value Area Low) : Lower boundary - support level
- Displayed with dashed lines and labels
- Represents fair value zone where institutional traders are most active
5. Volume Nodes
- HVN (High Volume Nodes) : Areas with ≥80% of maximum volume
- Highlighted in yellow/amber
- Strong support/resistance zones
- Price tends to consolidate here
- LVN (Low Volume Nodes) : Areas with ≤30% of maximum volume
- Highlighted in orange
- Low liquidity gaps
- Price moves quickly through these zones
- Potential breakout areas
6. Imbalance Zones
- Identifies areas with extreme directional bias (≥70% threshold)
- Buy Imbalance : Green overlay - exhaustion of buying pressure
- Sell Imbalance : Red overlay - exhaustion of selling pressure
- Indicates potential reversal or continuation zones
7. Session-Based Analysis
- Session Background Overlay : Color-codes current trading session
- Separate Session Profiles : Creates individual volume profiles for:
- 🇯🇵 Tokyo Session (00:00-09:00)
- 🇬🇧 London Session (07:00-16:00)
- 🇺🇸 New York Session (13:00-22:00)
- 🇦🇺 Sydney Session (21:00-06:00)
- Compare volume patterns across different market sessions
- Identify session-specific support/resistance levels
---
⚙️ CONFIGURATION SETTINGS
Basic Settings
- LookBack : Number of bars to analyze (50-500 recommended)
- Bins : Number of price levels (10-100, default: 30)
- Horizontal Offset : Adjust profile position on chart
#### Features Toggle
- Delta Heat Map
- Delta Labels
- Volume Bars (Buy/Sell split)
- POC Line
- Custom colors for positive/negative volume
Advanced Features
- Value Area calculation with adjustable percentage
- Volume Nodes (HVN/LVN) with custom thresholds
- Imbalance Zones with adjustable sensitivity
- Session backgrounds and separate profiles
- Profile spacing for multi-session view
---
📈 HOW TO USE THIS INDICATOR
Installation & Setup
1. Add to Chart :
- Search for "Volume Profile DeltaMap"
- Click "Add to favorites" ⭐
- Apply to your chart
2. Recommended Timeframes :
- Scalping : 1-5 minute charts
- Day Trading : 5-15 minute charts
- Swing Trading : 1-4 hour charts
- Position Trading : Daily charts
3. Initial Settings :
- Start with default settings
- For intraday: Set LookBack to 200-400 bars
- For higher timeframes: Use 100-200 bars
4. Enable Session Profiles (Optional):
- Go to Settings → Advanced Features
- Enable "Separate Profiles Per Session"
- Adjust "Profile Spacing" for better visibility
---
🔍 READING THE INDICATOR
Understanding the Display
Main Profile Elements:
- Horizontal bars : Length represents volume at that price
- Color gradient : Shows delta (buyer vs seller dominance)
- Bright cyan line : Point of Control (POC) - highest volume
- Green dashed line : Value Area High (VAH)
- Red dashed line : Value Area Low (VAL)
- Yellow highlights : High Volume Nodes (HVN)
- Orange highlights : Low Volume Nodes (LVN)
Volume Bars (if enabled):
- Top half (Red) : Selling volume percentage
- Bottom half (Teal) : Buying volume percentage
Delta Labels:
- Shows Δ percentage
- Positive = More buyers
- Negative = More sellers
---
📊 MARKET ANALYSIS & TRADING STRATEGIES
1. Support & Resistance Trading
POC as Key Level:
- Price tends to return to POC (magnetic effect)
- Strategy :
- When price is above POC → Look for pullbacks to POC for long entries
- When price is below POC → Look for rallies to POC for short entries
- POC acts as dynamic support/resistance
Value Area Trading:
- Inside Value Area (between VAH & VAL):
- Market is in balance/equilibrium
- Range-bound trading strategies
- Look for mean reversion
- Outside Value Area :
- Price accepted above VAH = Bullish breakout
- Price accepted below VAL = Bearish breakdown
- Trend-following strategies
Example Setup:
Price above VAH + Strong buying delta = Bullish trend
→ Wait for pullback to VAH
→ Enter long with stop below VAH
→ Target: Next HVN or previous session high
2. Volume Node Trading
High Volume Nodes (HVN):
- Characteristics : Strong support/resistance, consolidation zones
- Trading Strategy :
- Price approaching HVN from above → Potential support
- Price approaching HVN from below → Potential resistance
- Breakout from HVN → Strong momentum move
- Setup : Place limit orders at HVN boundaries
Low Volume Nodes (LVN):
- Characteristics : Low liquidity, fast price movement
- Trading Strategy :
- Price in LVN = Don't chase, wait for next HVN
- LVN breakout = Rapid moves, use wider stops
- Price rejection from LVN = Quick return to HVN
- Setup : Avoid placing stops in LVN zones
Example:
Price consolidating at HVN (yellow) near $50,000
→ Breakout above with volume
→ Fast move through LVN (orange) gap
→ Next target: Upper HVN at $51,500
3. Delta Analysis for Entry Timing
Strong Buying Delta (Green zones):
- Δ > +20% = Buyers in control
- Bullish Signal : Accumulation zone
- Strategy : Look for long entries on pullbacks
- Confirmation : Rising price + positive delta
Strong Selling Delta (Red zones):
- Δ < -20% = Sellers in control
- Bearish Signal : Distribution zone
- Strategy : Look for short entries on rallies
- Confirmation : Falling price + negative delta
Delta Divergence (Advanced):
- Bullish Divergence : Price making lower lows, but delta improving (less negative)
- Indicates selling pressure weakening
- Potential reversal signal
- Bearish Divergence : Price making higher highs, but delta weakening (less positive)
- Indicates buying pressure exhausting
- Potential reversal signal
4. Imbalance Zone Trading
Buy Imbalance (Bright Green):
- 70%+ buying pressure
- Interpretation :
- Potential exhaustion of buyers
- Smart money distribution
- Strategy :
- Look for reversal signals (bearish candles, resistance)
- Take profits on long positions
- Consider short entries with confirmation
Sell Imbalance (Bright Red):
- 70%+ selling pressure
- Interpretation :
- Potential exhaustion of sellers
- Smart money accumulation
- Strategy :
- Look for reversal signals (bullish candles, support)
- Take profits on short positions
- Consider long entries with confirmation
Example:
```
Price at VAH with 80% sell imbalance
→ Selling exhaustion likely
→ Wait for bullish reversal candle
→ Enter long with stop below VAL
```
5. Multi-Session Analysis
When "Separate Profiles Per Session" is enabled:
Session-Specific Levels:
- Each session creates its own POC and value area
- Compare sessions to identify:
- Where institutions accumulated/distributed
- Which levels each session respected
- Unfinished business from previous sessions
Trading Strategies:
A. Session POC Confluence
London POC: $49,500
NY POC: $49,550
→ Strong support zone at $49,500-$49,550
→ High probability long setup on pullback
B. Value Area Overlap
London VAH: $50,000
NY VAL: $49,800
→ Overlap creates strong consolidation zone
→ Breakout strategy: Enter on break above $50,000
C. Unfinished Business
London session rejected $51,000 (sell imbalance)
NY session hasn't tested this level yet
→ Watch for NY session to revisit $51,000
→ Potential reversal zone
D. Session Handoff
Tokyo session: Sideways, low volume
London session: Strong buying delta, break above VAH
NY session: Continuation or reversal?
→ Monitor NY open for direction confirmation
6. Market Profile Analysis
Profile Shape Interpretation:
A. P-Shape (Peak at Top)
- High volume at top of range
- Interpretation : Distribution, potential reversal down
- Strategy : Look for shorts at resistance
B. b-Shape (Peak at Bottom)
- High volume at bottom of range
- Interpretation : Accumulation, potential reversal up
- Strategy : Look for longs at support
C. D-Shape (Peak in Middle)
- Balanced profile, POC in center
- Interpretation : Equilibrium, neutral market
- Strategy : Range trading between VAH/VAL
D. Thin Profile (LVN Gap)
- Low volume throughout
- Interpretation : Trending market, little acceptance
- Strategy : Trend following, avoid counter-trend trades
---
🎯 COMPLETE TRADING WORKFLOW
Step 1: Market Structure Analysis
1. Identify overall profile shape
2. Locate POC, VAH, VAL
3. Note HVN and LVN zones
4. Check current price position relative to value area
Step 2: Delta & Imbalance Check
1. Review delta distribution (where are buyers/sellers?)
2. Identify imbalance zones
3. Look for delta divergences
4. Note any exhaustion signals
Step 3: Session Analysis (if enabled)
1. Compare current session vs previous sessions
2. Identify key levels each session created
3. Look for level confluences or gaps
4. Note unfinished business
Step 4: Trade Setup
1. Define your bias (long/short/neutral)
2. Identify entry zone (HVN, VAH/VAL, POC)
3. Set stop loss (below/above key level or opposite LVN)
4. Set target (next HVN, VAH/VAL, or session high/low)
Step 5: Execution & Management
1. Wait for price to reach entry zone
2. Confirm with price action (candlestick patterns)
3. Enter trade with defined risk
4. Move stop to breakeven at first target
5. Trail stop or take profits at resistance/support
---
📋 EXAMPLE TRADE SCENARIOS
Scenario 1: Long Setup at VAL
Setup:
- Price pulled back to VAL ($49,200)
- VAL coincides with HVN (yellow zone)
- Delta showing +15% buying (green)
- London session POC also at $49,200
Entry:
- Buy at $49,200 (VAL/HVN confluence)
- Stop loss: $49,000 (below VAL, in LVN)
- Target 1: $49,800 (POC)
- Target 2: $50,200 (VAH)
Management:
- Move stop to breakeven when Target 1 reached
- Trail stop below recent swing lows
- Exit 50% at VAH, let remainder run
Risk:Reward : 200 points risk / 1000 points potential = 1:5 R:R
---
Scenario 2: Short Setup at Sell Imbalance
Setup:
- Price at VAH ($50,500)
- Sell imbalance zone (85% sellers, bright red)
- Bearish divergence (higher high, weaker delta)
- Previous session rejected this level
Entry:
- Short at $50,500 after bearish engulfing candle
- Stop loss: $50,750 (above VAH + imbalance zone)
- Target 1: $50,000 (POC)
- Target 2: $49,600 (VAL)
Management:
- Take 50% profit at POC
- Trail stop above recent swing highs
- Exit remainder at VAL or if delta turns positive
Risk:Reward : 250 points risk / 900 points potential = 1:3.6 R:R
---
Scenario 3: Range Trading Inside Value Area
Setup:
- Market consolidating between VAH ($50,200) and VAL ($49,600)
- POC at $49,900
- Multiple HVNs creating range boundaries
- Delta oscillating between +/-10%
Long Trade:
- Entry: $49,650 (near VAL)
- Stop: $49,500 (below VAL)
- Target: $50,150 (near VAH)
- Risk:Reward: 150/500 = 1:3.3
Short Trade:
- Entry: $50,150 (near VAH)
- Stop: $50,300 (above VAH)
- Target: $49,700 (near VAL)
- Risk:Reward: 150/450 = 1:3
Management:
- Reduce position size in range trading
- Take profits at opposite boundary
- Exit if breakout occurs (stop hunt possible)
---
Scenario 4: Session Breakout Trade
Setup:
- London session: Range-bound $49,500-$50,000
- London VAH at $50,000 (resistance)
- NY session opens: Strong buying delta (+35%)
- Price breaks above $50,000 with momentum
Entry:
- Buy on breakout above $50,000
- Or buy on retest of $50,000 (old resistance = new support)
- Stop loss: $49,700 (below breakout level + buffer)
- Target 1: $50,500 (next HVN from previous day)
- Target 2: $51,000 (measured move)
Management:
- Enter 50% position on breakout
- Add remaining 50% on successful retest
- Move stop to breakeven when price +$300
- Trail stop below 20 EMA or recent higher lows
Risk:Reward : 300 points risk / 1000 points potential = 1:3.3 R:R
---
⚠️ BEST PRACTICES & RISK MANAGEMENT
Do's:
✅ Use on liquid markets (major crypto, forex, indices)
✅ Combine with price action and candlestick patterns
✅ Wait for confirmation before entering trades
✅ Always use stop losses based on volume structure
✅ Take partial profits at key levels (HVN, VAH/VAL)
✅ Adjust lookback period based on timeframe
✅ Use higher timeframe profiles for context
✅ Compare current profile with previous day/session
✅ Consider volume trends (increasing/decreasing)
✅ Backtest strategies on your specific market
Don'ts:
❌ Don't trade solely based on this indicator
❌ Don't ignore price action and market context
❌ Don't place stops in LVN zones (prone to spikes)
❌ Don't chase price in low volume areas
❌ Don't overtrade - wait for quality setups
❌ Don't use on extremely low volume/illiquid assets
❌ Don't forget to adjust for different market conditions
❌ Don't ignore fundamental news events
❌ Don't use excessive leverage even with good setups
❌ Don't force trades - patience is key
Risk Management Rules:
1. Risk per trade : Never risk more than 1-2% of capital
2. Position sizing : Based on stop loss distance
3. Stop placement : Always below/above key volume levels
4. Profit taking : Scale out at multiple targets
5. Drawdown limits : Stop trading after 3 consecutive losses
6. Win rate expectation : 50-60% is realistic
7. Risk:Reward minimum : Aim for 1:2 or better
8. Correlation : Don't take correlated positions
---
🔧 TROUBLESHOOTING & OPTIMIZATION
If profiles look too compressed:
- Increase "Bins" to 40-50
- Reduce "LookBack" period
- Adjust "Horizontal Offset"
If too cluttered:
- Disable "Delta Labels"
- Disable "Volume Bars"
- Keep only POC and Value Area
- Use "Session Background Overlay" instead of separate profiles
For scalping (1-5 min):
- LookBack: 300-500 bars
- Bins: 20-30
- Enable separate session profiles
- Focus on imbalance zones
For swing trading (1H-4H):
- LookBack: 100-200 bars
- Bins: 25-35
- Focus on VAH/VAL and HVN
- Disable session features
For position trading (Daily):
- LookBack: 50-100 bars
- Bins: 30-40
- Focus on weekly/monthly POC
- Compare with previous week profiles
---
📚 ADVANCED CONCEPTS
1. Composite Profiles
- Build profiles across multiple days
- Increase LookBack to 500+ bars on 15-min chart
- Identifies major support/resistance from weeks of data
- Use for swing trading key levels
2. Profile Migration
- Track how POC moves day over day
- Uptrend : POC migrating higher
- Downtrend : POC migrating lower
- Range : POC oscillating in same area
3. Failed Auctions
- Price briefly leaves value area but quickly returns
- Failed auction high : Bearish signal
- Failed auction low : Bullish signal
- Indicates rejection of new price levels
4. Overnight Inventory
- Compare previous day's close to value area
- Close above VAH : Bullish bias for next day
- Close below VAL : Bearish bias for next day
- Close in value area : Neutral, range expected
5. Volume Delta Momentum
- Track cumulative delta across time
- Rising cumulative delta + rising price : Strong trend
- Falling cumulative delta + rising price : Weak/topping
- Rising cumulative delta + falling price : Potential reversal
---
📊 INTEGRATION WITH OTHER INDICATORS
Complementary Indicators:
1. Moving Averages (20/50/200 EMA)
- Use with POC and VAH/VAL
- Confluence with EMAs = stronger levels
2. RSI/Stochastic
- Overbought at resistance (VAH/HVN) = strong short
- Oversold at support (VAL/HVN) = strong long
3. VWAP
- POC often aligns with VWAP
- Deviation from VWAP + Volume Profile = trade setup
4. Order Flow/Footprint Charts
- Confirm delta analysis
- Detailed buyer/seller pressure
5. Market Profile (TPO)
- Similar concept, different visualization
- Use together for complete picture
Example Multi-Indicator Setup:
Price at VAL ✓
+ 200 EMA support ✓
+ RSI oversold (30) ✓
+ Positive delta zone ✓
+ Bullish engulfing candle ✓
= High probability long entry
---
🎓 LEARNING CURVE & PRACTICE
Week 1-2: Understanding
- Study each feature individually
- Identify POC, VAH, VAL on historical charts
- Note HVN and LVN patterns
- Observe how price reacts to these levels
Week 3-4: Pattern Recognition
- Track different profile shapes
- Identify session-specific patterns
- Note delta distribution patterns
- Document imbalance zone outcomes
Week 5-6: Paper Trading
- Take simulated trades based on setups
- Record entry/exit reasoning
- Track win rate and R:R
- Refine strategy based on results
Week 7-8: Live Trading (Small Size)
- Start with minimal position sizes
- Focus on execution and discipline
- Build confidence with real money
- Gradually increase size as proficiency grows
Ongoing:
- Review trades weekly
- Keep trading journal
- Adapt to changing market conditions
- Continuously refine strategy
---
💡 KEY TAKEAWAYS
1. Volume Profile shows WHERE the market is most active (POC, HVN)
2. Delta shows WHO is in control (buyers vs sellers)
3. Value Area shows FAIR VALUE (equilibrium zone)
4. Volume Nodes show STRUCTURE (support/resistance)
5. Imbalances show EXHAUSTION (potential reversals)
6. Sessions show PARTICIPATION (institutional activity)
The indicator is a MAP, not a SIGNAL:
- It shows you the battlefield terrain
- You still need to decide when/how to engage
- Combine with price action for best results
- Risk management is always paramount
---
⚖️ DISCLAIMER
This indicator is for educational and informational purposes only.
- Not financial advice
- Past performance does not guarantee future results
- Trading involves substantial risk of loss
- Only trade with capital you can afford to lose
- Always do your own research and due diligence
- Test strategies thoroughly before risking real money
- Consider consulting a licensed financial advisor
The creator is not responsible for any trading losses incurred while using this indicator.
---
Happy Trading! 📈🚀

VCP Base Detector
📊 VCP BASE DETECTOR - AUTO-DETECT CONSOLIDATION ZONES
🎯 WHAT IS THIS INDICATOR?
This indicator automatically detects and marks ALL consolidation bases (VCP bases) on your chart. It:
✅ Auto-detects when price enters consolidation
✅ Measures base tightness (volatility contraction)
✅ Tracks base duration (how long consolidating)
✅ Rates base quality (1-5 stars)
✅ Shows volume drying confirmation
✅ Detects base breakouts
✅ Shows progression of multiple bases (VCP pattern)
Use this WITH the "Mark Minervini SEPA Balanced" indicator for complete trading setups!
✅ Mark Minervini SEPA Balanced = Trend + RS + Stage
✅ VCP Base Detector = Base Quality + Progression
Combined = Complete professional trading system!
🎨 WHAT YOU SEE ON YOUR CHART
1️⃣ COLORED BOXES (Base Zones):
🟦 Aqua Box = ⭐⭐⭐⭐⭐ Excellent base (tightest)
🔵 Blue Box = ⭐⭐⭐⭐ Very good base
🟣 Purple Box = ⭐⭐⭐ Good base
🟠 Orange Box = ⭐⭐ Fair base
⬜ Gray Box = ⭐ Weak base
2️⃣ BASE LABELS (With Metrics):
Shows above each base:
• Duration: 20 days
• Tightness: 0.9%
• Quality: ⭐⭐⭐⭐⭐
3️⃣ BREAKOUT LABELS (When price exits base):
Green "BREAKOUT ✓" label shows:
• Price: ₹800
• Volume: 1.6x
4️⃣ DASHBOARD (Top-Left Panel):
Real-time base metrics showing:
• In Base: YES/NO
• Tightness: 0.8%
• Duration: 22 days
• Range: 3.5%
• Volume: Drying/Normal
• Quality: ⭐⭐⭐⭐
📊 UNDERSTANDING BASE QUALITY (⭐ Rating System)
⭐⭐⭐⭐⭐ (EXCELLENT)
├─ Tightness: < 0.8% ATR
├─ Duration: 15-40 days
├─ Volume: Significantly drying
├─ Price Range: < 5%
└─ Result: Most explosive breakouts (best quality)
⭐⭐⭐⭐ (VERY GOOD)
├─ Tightness: 0.8-1.0% ATR
├─ Duration: 15-35 days
├─ Volume: Very dry
├─ Price Range: < 7%
└─ Result: High probability breakouts
⭐⭐⭐ (GOOD)
├─ Tightness: 1.0-1.3% ATR
├─ Duration: 15-30 days
├─ Volume: Drying
├─ Price Range: < 8%
└─ Result: Decent breakout probability
⭐⭐ (FAIR)
├─ Tightness: 1.3-1.5% ATR
├─ Duration: 15-25 days
├─ Volume: Moderate drying
├─ Price Range: < 10%
└─ Result: Lower quality, riskier
⭐ (WEAK)
├─ Tightness: > 1.5% ATR
├─ Duration: Varies
├─ Volume: Not drying enough
├─ Price Range: > 10%
└─ Result: Low quality, skip these
📈 HOW TO USE - STEP BY STEP
STEP 1: ADD INDICATOR TO CHART
────────────────────────────────
1. Open any stock chart (use 1D timeframe for swing trading)
2. Click "Indicators"
3. Search "VCP Base Detector"
4. Click to add to chart
5. Wait a moment for boxes to appear
STEP 2: SCAN FOR BASES
───────────────────────
Look for:
✓ Colored boxes appearing on chart (bases forming)
✓ Dashboard showing "In Base: YES"
✓ Tightness below 1.5%
✓ Volume Dry: YES
STEP 3: MONITOR BASE QUALITY
──────────────────────────────
Dashboard shows stars:
⭐⭐⭐⭐⭐ = Wait for breakout (best setup)
⭐⭐⭐⭐ = Good quality, watch for breakout
⭐⭐⭐ = Decent, but not ideal
⭐⭐ or ⭐ = Skip (lower probability)
STEP 4: WAIT FOR BREAKOUT
──────────────────────────
When price breaks above the box:
✓ Green "BREAKOUT ✓" label appears
✓ Shows breakout price and volume
✓ If volume shows 1.3x+, breakout is confirmed
✓ This is your entry signal!
STEP 5: CHECK MINERVINI CRITERIA (Use Both Indicators)
───────────────────────────────────────────────────────
Before entering:
✓ VCP Base Detector shows ⭐⭐⭐⭐+ quality base
✓ Mark Minervini indicator shows BUY SIGNAL
✓ Dashboard shows 10+ criteria GREEN
✓ Stage shows S2
Result: HIGH-PROBABILITY SETUP! 🎯
📋 DASHBOARD INDICATORS - WHAT EACH MEANS
BASE METRICS SECTION:
─────────────────────
In Base = ✓ YES or ✗ NO
Show if price is currently consolidating
Tightness = 0-3% (lower = tighter = better)
< 0.8% = ⭐⭐⭐⭐⭐ (excellent)
0.8-1.0% = ⭐⭐⭐⭐ (very good)
1.0-1.3% = ⭐⭐⭐ (good)
1.3-1.5% = ⭐⭐ (fair)
> 1.5% = ⭐ (weak)
Duration = Number of days in consolidation
15 days = ⭐ (too short, weak)
20 days = ⭐⭐⭐ (ideal)
30 days = ⭐⭐⭐⭐ (very long, strong)
> 40 days = ⚠️ (too long, may break down)
Range = % movement within the base
< 5% = ⭐⭐⭐⭐⭐ (excellent, very tight)
5-8% = ⭐⭐⭐ (good)
> 10% = ⭐ (loose, not ideal)
Vol Dry = Volume status during consolidation
✓ YES = Volume contracting (good)
✗ NO = Normal/high volume (weak setup)
QUALITY SECTION:
────────────────
Stars = Overall base quality rating
⭐⭐⭐⭐⭐ = Best quality bases (most explosive)
⭐⭐⭐⭐ = Excellent quality
⭐⭐⭐ = Good quality
⭐⭐ = Fair quality
⭐ = Weak quality (skip)
52W INFO SECTION:
─────────────────
From 52W Hi = How far below 52-week high is price?
< 25% = In sweet zone ✓
> 25% = Too far from highs ✗
From 52W Lo = How far above 52-week low is price?
> 30% = In sweet zone ✓
< 30% = Too close to lows ✗
⚙️ CUSTOMIZATION GUIDE
Click ⚙️ gear icon next to indicator to adjust:
MINIMUM BASE DAYS (Default: 15)
──────────────────────────────
Current: 15 = Include shorter bases
Change to 20 = Longer bases only (higher quality)
Change to 10 = Include very short bases (more frequent)
Why: Longer bases = better breakouts, but fewer opportunities
ATR% TIGHTNESS THRESHOLD (Default: 1.5)
────────────────────────────────────────
Current: 1.5 = BALANCED for Indian stocks
Change to 1.0 = ONLY very tight bases (⭐⭐⭐⭐⭐)
Change to 2.0 = Looser bases included (more frequent)
Why: Lower = tighter bases = better quality, fewer signals
VOLUME DRYING THRESHOLD (Default: 0.7)
──────────────────────────────────────
Current: 0.7 = Volume at 70% of average (good drying)
Change to 0.6 = Stricter (more volume drying required)
Change to 0.8 = Looser (less volume drying required)
Why: Volume drying = consolidation confirmation
52W PERIOD (Default: 252)
─────────────────────────
Current: 252 = Full year lookback
Don't change unless you know what you're doing
📈 REAL TRADING EXAMPLE
SCENARIO: Trading MARUTI over 6 weeks
WEEK 1: Nothing happening
─────────────────────────
- No boxes on chart
- Dashboard: "In Base: NO"
- Action: SKIP (not consolidating)
WEEK 2: Base Starting to Form
─────────────────────────────
- Purple box appears (⭐⭐⭐ quality)
- Dashboard: "In Base: YES"
- Tightness: 1.2%
- Duration: 3 days (too new)
- Action: MONITOR (let it develop)
WEEK 3-4: Base Tightening
──────────────────────────
- Box color changes from Purple → Blue (⭐⭐⭐⭐ quality)
- Dashboard: Duration: 12 days
- Tightness: 0.9%
- Vol Dry: YES
- Action: GET READY (high-quality base forming)
WEEK 4-5: Perfect Base Formed
──────────────────────────────
- Box changes to Aqua (⭐⭐⭐⭐⭐ EXCELLENT!)
- Dashboard: Duration: 22 days ✓
- Tightness: 0.8% ✓
- Vol Dry: YES ✓
- Range: 4.2% ✓
- Action: WATCH FOR BREAKOUT
WEEK 5: BREAKOUT HAPPENS!
──────────────────────────
- Price closes above box
- Green "BREAKOUT ✓" label appears
- Shows: Price ₹850, Volume 1.6x
- Mark Minervini indicator: BUY SIGNAL ✓
- Dashboard all GREEN ✓
- Action: ENTER TRADE
Entry: ₹850
Stop: Box low (₹820)
Target: ₹980 (20% move)
RESULT: +15.3% profit in 2 weeks! ✅
💡 PRO TIPS FOR BEST RESULTS
1. COMBINE WITH MINERVINI INDICATOR
Use BOTH indicators together:
✓ VCP Detector = Base quality
✓ Minervini = Trend + RS + Volume
Result = Best high-probability setups
2. PREFER ⭐⭐⭐⭐+ QUALITY BASES
Don't trade ⭐⭐ or ⭐ quality bases
Only trade ⭐⭐⭐+ (ideally ⭐⭐⭐⭐+)
Higher quality = Higher win rate
3. WAIT FOR VOLUME CONFIRMATION
Base must show "Vol Dry: YES"
Breakout must have 1.3x+ volume
Low volume breakouts fail often
4. USE 1D TIMEFRAME ONLY
This indicator optimized for daily charts
Intraday = Too many false signals
Weekly = Misses good setups
5. MONITOR MULTIPLE BASES (VCP PATTERN)
Multiple bases getting tighter = VCP pattern
Each base should be better quality than last
Tightest base = Biggest breakout
6. COMBINE WITH 52W CONTEXT
Dashboard shows "From 52W Hi" and "From 52W Lo"
Price should be in sweet zone:
< 25% from 52W high (uptrend territory)
> 30% above 52W low (not oversold)
7. BACKTEST FIRST
Use TradingView Replay
Go back 6-12 months
See how many bases appeared
See which were profitable
❌ BASES TO SKIP (Lower Probability)
Skip if:
❌ Quality rating < ⭐⭐⭐ (only 1-2 stars)
❌ Tightness > 1.5% (too loose)
❌ Duration < 10 days (too short, weak)
❌ Duration > 50 days (too long, may break down)
❌ Vol Dry: NO (volume not contracting)
❌ Range > 10% (not tight consolidation)
❌ Price < 30% from 52W low (too weak)
❌ Price > 30% from 52W high (too far up, late entry)
⚠️ IMPORTANT DISCLAIMERS
✓ This indicator is for educational purposes only
✓ Past performance does not guarantee future results
✓ Always use proper risk management (position sizing, stop loss)
✓ Never risk more than 2% of your account on one trade
✓ Base detection is technical analysis, not investment advice
✓ Losses can occur - trade at your own risk
✓ Combine with other indicators for best results
🎓 LEARNING RESOURCES
To understand VCP bases better:
→ Study "Trade Like a Stock Market Wizard" by Mark Minervini
→ Watch: "VCP Pattern" videos on YouTube
→ Practice: Backtest on 1-2 years of historical data
→ Learn: How consolidation precedes breakouts
🚀 YOU'RE READY!
Happy trading! 📈🎯

Support & Resistance Pro by 🅰🅻🅿Support & Resistance Pro by 🅰🅻🅿
A Multi-Layer Market Structure Engine for Professional Price Analysis
Support & Resistance Pro is a next-generation price structure algorithm designed to identify the most meaningful support and resistance levels across any market or timeframe.
Instead of relying on simple fractals, random pivots, or fixed-distance lines, this script analyzes the way price interacts with historical levels — including wick reactions, close rejections, structural pivots, retests, and liquidity sweeps.
The result is a clean, intelligent, and highly accurate market structure map that adapts to every style of trading.
🚀 Key Features
1. Multi-Layer S/R Engine (Up to 20 Dynamic Levels)
The algorithm computes and ranks up to 20 unique levels , from strongest to weakest.
Each level is scored using:
Structural pivot strength
Number of historical touches
Closeness of each interaction
Market memory & reaction weight
Breakout and retest behavior
This produces an objective hierarchy of price levels — ideal for scalping, day trading, or swing analysis.
2. Smart Strength Filter
To remove noise, the Smart Strength Filter evaluates how often price has interacted with each level and hides the ones that lack significance.
You can customize:
Lookback range
Minimum touch count
Touch tolerance sensitivity
This ensures your chart displays only the most relevant and reliable structural zones for the current environment.
3. Heat Map Intensity Coloring
Levels automatically change opacity based on their strength:
More touches → stronger color
Fewer touches → lighter color
This creates a natural visual heat map that highlights where market memory is strongest — perfect for identifying high-probability breakout or reversal zones.
4. Multi-Timeframe Compatibility
Project higher timeframe S/R onto lower timeframe charts to enhance confluence:
Day traders: render 4H levels on 5m–15m
Swing traders: render 1D levels on 1H
Scalpers: render 1H levels on 1m–3m
This gives you powerful structural awareness without switching charts.
5. Clean Visual Design
Every element has been designed to stay out of your way:
Choose your preferred level count (8–20)
Adjustable line thickness
Label sizing and offset controls
Optional price tags
Light or dark color-friendly styling
The visual layout is clean, modern, and tailored for long chart sessions.
6. Profile Presets for Every Trader
Four built-in trading profiles are included:
Scalp Mode
Reactive levels
Tight tolerance
Best for 1m–5m
Day Trade Mode
Balanced structure
Ideal for 5m–1H
Swing Mode
Broad pivots
Higher significance
Perfect for 4H–1D
Custom Mode
Full control over every parameter.
🎯 How Traders Use This
Identify major reversal zones
Find liquidity pockets before they form
Improve breakout accuracy
Locate fair-value areas for entries
Combine HTF structure with LTF setups
Simplify noise-heavy charts
Whether you’re looking for scalping precision or long-term structure, the indicator adapts instantly.
⚠️ Disclaimer
This script is intended for market analysis and educational purposes only.
It does not constitute financial advice.
Always backtest and verify settings before trading live markets.
🅐🅛🅟 – Author
Created with care, precision, and countless hours of testing by alpprofitmax.
Licensed under the Mozilla Public License 2.0.

Minervini VCP Pattern -Indian ContextThis script implements Mark Minervini's Trend Template and VCP (Volatility Contraction Pattern) pattern, specifically adapted for Indian stock markets (NSE). It helps identify stocks that are in strong uptrends and ready to break out.
Core Concepts Explained
1. What is the Minervini Trend Template?
Mark Minervini's method identifies stocks in Stage 2 uptrends - the sweet spot where institutional money is accumulating and stocks show the strongest momentum. Think of it as finding stocks that are "leaders" rather than "laggards."
2. What is VCP (Volatility Contraction Pattern)?
A VCP occurs when:
Stock price consolidates (moves sideways) after an uptrend
Price swings get tighter and tighter (like a coiled spring)
Volume dries up (fewer people trading)
Then it breaks out with force.
You can customize the strategy settings without editing code.
Key Settings:
Minimum Price (₹50): Filters out penny stocks that are too volatile
Min Distance from 52W Low (30%): Stock should be at least 30% above its yearly low
Max Distance from 52W High (25%): Stock should be within 25% of its yearly high (showing strength)
Moving Average Periods: 10, 50, 150, 200 days (industry standard)
Minimum Volume (100,000 shares): Ensures the stock is liquid enough to trade
Indian Market Adaptation: The default values (₹50 minimum, volume thresholds) are adjusted for NSE stocks, which behave differently than US markets.
The script pulls weekly chart data even when you're viewing daily charts.
Why it matters: Weekly trends are more reliable than daily noise. Professional traders use weekly charts to confirm the bigger picture.
What are Moving Averages (MAs)?
Simple averages of closing prices over X days
They smooth out price action to show trends
Think of them as the "average cost" of buyers over different time periods
The 4 Key MAs:
10 MA (Fast): Very short-term trend
50 MA: Short to medium-term trend
150 MA: Medium to long-term trend
200 MA: Long-term trend (the "grandfather" of all MAs)
Why Weekly MAs?
The script also calculates 10 and 50 MAs on weekly data for additional confirmation of the bigger trend.
The script Finds the highest and lowest prices over the past 52 weeks (1 year).
Why it matters:
Stocks near 52-week highs are showing strength (institutions buying)
Stocks far from 52-week lows have "room to run" upward
This is a psychological level that influences trader behaviour.
What is Volume here ?
The number of shares traded each day
High volume = many traders interested (conviction)
Low volume = lack of interest (weakness or consolidation)
Volume in VCP:
During consolidation (sideways movement), volume should dry up - this shows sellers are exhausted and buyers are holding. When volume spikes on a breakout, it confirms the move.
NSE Context: Indian stocks often have different volume patterns than US stocks, so the 50-day average is used as a baseline.
Relative Strength vs Nifty:
Example:
If your stock is up 20% and Nifty is up 10%, your stock has strong RS
If your stock is up 5% and Nifty is up 15%, your stock has weak RS (avoid it!)
Why it matters: The best performing stocks almost always have strong relative strength before major moves.
The 13 Minervini Conditions:-
Condition 1: Price > 50/150/200 MA
Meaning: Current price must be above ALL three major moving averages.
Why: This confirms the stock is in a clear uptrend. If price is below these MAs, the stock is weak or in a downtrend.
Condition 2: MA 50 > 150 > 200
Meaning: The moving averages themselves must be in proper order.
Analogy: Think of this like layers in a cake - short-term on top, long-term at bottom. If they're tangled, the trend is unclear.
Condition 3: 200 MA Rising (1 Month)
Meaning: The 200 MA today must be higher than it was 20 days ago.
Why: This confirms the long-term trend is UP, not flat or down. The means "20 bars ago."
Condition 4: 50 MA Rising
Meaning: The 50 MA today must be higher than 5 days ago.
Why: Confirms short-term momentum is accelerating upward.
Condition 5: Within 25% of 52-Week High
Meaning: Current price should be within 25% of its 1-year high.
Example:
52-week high = ₹1000
Current price must be above ₹750 (within 25%)
Why: Strong stocks stay near their highs. Weak stocks fall far from highs.
Condition 6: 30%+ Above 52-Week Low (OPTIONAL)
Meaning: Stock should be at least 30% above its yearly low.
Note: The script marks this as "SECONDARY - Optional" because the other conditions are more important. However, it's still a good confirmation.
Condition 7: Price > 10 MA
Meaning: Very short-term strength - price above the 10-day moving average.
Why: Ensures the stock hasn't just rolled over in the immediate term.
Condition 8: Price >= ₹50
Meaning: Filters out stocks below ₹50.
Why: In Indian markets, stocks below ₹50 tend to be penny stocks with poor liquidity and higher manipulation risk.
Condition 9: Weekly Uptrend
Meaning: On the weekly chart, price must be above both weekly MAs, and they must be properly aligned.
Why: Confirms the bigger picture trend, not just daily fluctuations.
Condition 10: 150 MA Rising
Meaning: The 150 MA is trending upward over the past 10 days.
Why: Another confirmation of medium-term trend health.
Condition 11: Sufficient Volume
Meaning: Average volume must exceed 100,000 shares (or your custom setting).
Why: Ensures you can actually buy/sell the stock without moving the price too much (liquidity).
Condition 12: RS vs Nifty Strong
Meaning: The stock's relative strength vs Nifty must be improving.
Why: You want stocks that are outperforming the market, not underperforming.
Condition 13: Nifty in Uptrend
Meaning: The Nifty 50 index itself must be above its 50 MA.
Why: "A rising tide lifts all boats." It's easier to make money in individual stocks when the overall market is bullish.
VCP Requirements:
Volatility Contracting: Price swings getting tighter (coiling spring)
Volume Drying Up: Fewer shares trading + trending lower
The Setup: When volatility contracts and volume dries up WHILE all 13 trend conditions are met, you have a VCP setup ready to explode.
What You See on Chart:
Colored Lines: 10 MA (green), 50 MA (blue), 150 MA (orange), 200 MA (red)
Blue Background: Trend template conditions met (watch zone)
Green Background: Full VCP setup detected (buy zone)
↟ Symbol Below Price: New VCP buy signal just triggered
Information Table:
What it does: Creates a checklist table on your chart showing the status of all conditions.
Table Structure:
Column 1: Condition name
Column 2: Status (✓ green = met, ✗ red = not met)
Final Row: Shows "BUY" (green) or "WAIT" (red) based on full VCP setup status.
Dos:
Example:
Account size: ₹5,00,000
Risk per trade: 1% = ₹5,000
Entry: ₹1000
Stop loss: ₹920 (8% below)
Distance to stop: ₹80
Shares to buy: ₹5,000 / ₹80 = 62 shares
Exit Strategy:
Sell 1/3 at +20% profit
Sell another 1/3 at +40% profit
Let the final 1/3 run with a trailing stop
Always exit if price closes below 10 MA on heavy volume
What This Script Does NOT Do:
Guarantee profits - No strategy works 100% of the time
Account for news events - Earnings, regulatory changes, etc.
Consider fundamentals - Company financials, debt, management quality
Adapt to market crashes - Works best in bull markets
Best Market Conditions:
✅ Nifty in uptrend (above 50 MA)
✅ Market breadth positive (more stocks advancing)
✅ Sector rotation happening
❌ Avoid in bear markets or high volatility periods
References:
Trade Like a Stock Market Wizard by Mark Minervini
Think & Trade Like a Champion by Mark Minervini
Chart attached: AU Small Finance Bank as on EoD dated 28/11/25
This script is a powerful tool for educational purpose only, remember: It's a tool, not a crystal ball. Use it to find high-probability setups, then apply proper risk management and patience. Good luck!

DarkPool's Gann High Low Activator DarkPool's Gann High-Low Activator.
It enhances the traditional trend-following logic by integrating Heikin Ashi smoothing, Multi-Timeframe (MTF) analysis, and volatility filtering. It is designed to filter out market noise and provide clearer trend signals during volatile conditions.
Underlying Concepts
Heikin Ashi Smoothing: Standard price candles can produce erratic signals due to wicks and short-term volatility. This script includes a "Calculation Mode" setting that allows the Gann logic to run on Heikin Ashi average prices. This smoothes out price data, helping traders stay in trends longer by ignoring temporary pullbacks.
Gann High-Low Logic: The core algorithm tracks the Simple Moving Average (SMA) of Highs and Lows over a user-defined period.
Bullish Trend: Price closes above the trailing SMA of Highs.
Bearish Trend: Price closes below the trailing SMA of Lows.
Volatility & Trend Filtering: To reduce false signals during sideways markets, this tool employs two filters:
ADX Filter (Choppiness): Uses the Average Directional Index to detect low-volatility environments. If the ADX is below the defined threshold (default 20), the indicator identifies the market as "choppy" and suppresses signals to preserve capital.
EMA Filter (Baseline): An optional Exponential Moving Average filter ensures trades are only taken in the direction of the longer-term trend (e.g., Longs only above the 200 EMA).
Features
Dual Calculation Modes: Switch between Standard price logic and Heikin Ashi smoothing logic.
Multi-Timeframe (MTF): Calculate the trend based on a higher timeframe (e.g., 4-Hour) while viewing a lower timeframe chart (e.g., 15-Minute).
Automated JSON Alerts: Generates machine-readable JSON alert payloads compatible with external trading bots and webhooks.
Live Dashboard: A data table displaying the current Trend State, Calculation Mode, ADX Value, and risk percentage.
How to Use
Buy Signal: Generated when the trend flips Bullish, provided the ADX indicates sufficient momentum and the price satisfies the EMA filter (if enabled).
Sell Signal: Generated when the trend flips Bearish, subject to the same momentum and trend filters.
Neutral State (Gray Cloud): When the cloud fill turns gray, the market is in consolidation. It is recommended to avoid entering new positions during this state.
Trailing Stop: The Gann Line serves as a dynamic trailing stop-loss level. A close beyond this line invalidates the current trend.
Settings Configuration
Calculation Mode: Select "Standard" for raw price action or "Heikin Ashi" for smoothed trend following.
Gann Length: Lower values (3-5) are suitable for short-term scalping; higher values (10+) are better for swing trading.
MTF Mode: Enable to lock the calculation to a specific higher timeframe.
ADX Threshold: Adjust based on asset volatility. Recommended: 20-25 for Crypto, 15-20 for Forex/Indices.
Disclaimer
This source code and the information presented here are for educational purposes only. This script does not constitute financial advice, trading recommendations, or a solicitation to buy or sell any financial instruments. Trading in financial markets involves a high degree of risk and may not be suitable for all investors. Past performance is not indicative of future results. The author assumes no responsibility for any losses incurred while using this indicator. Use this tool at your own discretion and risk.

Student Wyckoff Target Shooter
**Target Shooter — Equal Move Target Tool (Larry Williams idea)**
**1. What this indicator does**
Target Shooter is a tool that measures the last meaningful price swing and projects an **equal move target** in the direction of the breakout.
The logic is simple:
* The market makes a move from point A to point B (a swing high to a swing low, or vice versa).
* Then price breaks out above or below this swing range.
* Target Shooter takes the size of that swing and **adds it in the direction of the breakout**, showing a logical **price target zone** where the move may:
* slow down,
* react,
* or potentially reverse.
This is a practical implementation of the “Equal Moves” idea often referenced by Larry Williams.
---
**2. Core idea (example)**
Example from the classic explanation:
* Price drops from **80 down to 20** → the move is **60 points**.
* The swing range is now: **High = 80, Low = 20**.
* Later, price **breaks above 80**.
Target Shooter assumes:
> “If the market could move 60 points in one direction, after a breakout it may travel another 60 points in the opposite direction.”
So the upside target becomes:
* Move size: 80 − 20 = 60
* Breakout above 80
* **Target = 80 + 60 = 140**
The indicator finds such swings automatically and draws:
* **UT (Upper Target)** on upside breakouts
* **DT (Down Target)** on downside breakouts
---
**3. What you see on the chart**
1. **Target lines**
* When price breaks **above** a previous swing range, the indicator plots a horizontal **UT (Upper Target)** line — the projected equal move target.
* When price breaks **below** the previous swing range, it plots a **DT (Down Target)** line — the downside target.
* Each line is drawn from the breakout bar and extended to the right for a user-defined number of bars.
2. **Price labels**
* A small label “UT” or “DT” is shown at the end of the line with the exact target price.
* This makes it easy to see where the projected target is without checking the scale.
3. **Optional swing range (debug view)**
* There is an option to display the **swing range** that the target is based on (similar to a Donchian channel on previous bars).
* This shows the upper (swing high) and lower (swing low) boundaries the indicator used to define the last move.
---
**4. Key inputs (plain language)**
* **Swing window length (bars)**
How many bars back the indicator looks to find the last meaningful swing (highest high and lowest low).
This is like the length of a Donchian channel used to define the previous range.
Smaller values → more frequent, shorter targets.
Larger values → bigger swings and more distant targets.
* **Minimum move size (in ticks)**
This is a noise filter.
If the distance between the swing high and swing low is smaller than this threshold, no targets are drawn.
The indicator will only react to moves that are big enough to matter for your trading.
* **Breakout type: Close vs High/Low**
* **Breakout by Close**:
The target appears only when the **bar closes** above/below the swing range.
More conservative and fewer false signals.
* **Breakout by High/Low**:
The target appears as soon as the **high** or **low** of the bar breaks the swing range.
Faster and more aggressive, but more sensitive to noise.
* **Target line length (bars)**
How far to the right the UT/DT lines should be extended.
Shorter length → local target zones.
Longer length → important levels visible far into the future.
* **Appearance settings**
* Separate color, width and style for **UT** and **DT** lines.
* Option to show or hide labels with price and “UT/DT” text.
---
**5. How to use Target Shooter in trading**
> Important: this is **not** an entry signal indicator.
> Target Shooter is a **targeting and context tool**, not a standalone system.
Typical uses:
1. **Planning take-profit zones**
* You already have an entry signal from your own strategy (Wyckoff, Larry Williams patterns, levels, volume, whatever you use).
* Target Shooter shows a **logical equal move target** where the current wave can reasonably “shoot”.
* You can:
* place your main take-profit around the target,
* scale out part of the position,
* tighten stops when price approaches the target.
2. **Finding potential reaction / reversal areas**
* Equal move targets often act as **zones of interest**.
* If price reaches a UT/DT level and then shows weakness/absorption/volume spikes or reversal candles, this might be a good place to take profits or look for counter-trend opportunities (for experienced traders).
3. **Assessing trend strength**
* If price **easily exceeds** the equal move target and keeps going without any reaction, it suggests a very strong trend.
* If price **fails to reach** the target and reverses early, the move is weaker than expected.
---
**6. Timeframes**
Target Shooter can be used on:
* **Intraday** (M5, M15, M30, H1) — for shorter-term targets within the day,
* **Higher timeframes** (H4, D1 and above) — for swing and position trades.
General rule:
The **higher the timeframe and the larger the swing**, the **more important** the target level tends to be.
---
**7. Notes and limitations**
* The indicator does **not** predict the future.
It simply projects a geometric equal move from the last swing.
* It should be combined with your own trading framework:
* support/resistance,
* Wyckoff / VSA,
* trend tools,
* volume/flow, etc.
* Always keep proper risk management.
A target is a **scenario**, not a guarantee.
.

Advanced Trading System - Volume Profile + BB + RSI + FVG + FibAdvanced Multi-Indicator Trading System with Volume Profile, Bollinger Bands, RSI, FVG & Fibonacci
Overview
This comprehensive trading indicator combines five powerful technical analysis tools into one unified system, designed to identify high-probability trading opportunities with precision entry and exit signals. The indicator integrates Volume Profile analysis, Bollinger Bands, RSI momentum, Fair Value Gaps (FVG), and Fibonacci retracement levels to provide traders with a complete market analysis framework.
Key Features
1. Volume Profile & Point of Control (POC)
Automatically calculates the Point of Control - the price level with the highest trading volume
Identifies Value Area High (VAH) and Value Area Low (VAL)
Updates dynamically based on customizable lookback periods
Helps identify key support and resistance zones where institutional traders are active
2. Bollinger Bands Integration
Standard 20-period Bollinger Bands with customizable multiplier
Identifies overbought and oversold conditions
Measures market volatility through band width
Signals generated when price approaches extreme levels
3. RSI Momentum Analysis
14-period Relative Strength Index with visual background coloring
Overbought (70) and oversold (30) threshold alerts
Integrated into buy/sell signal logic for confirmation
Real-time momentum tracking in info dashboard
4. Fair Value Gap (FVG) Detection
Automatically identifies bullish and bearish fair value gaps
Visual representation with colored boxes
Highlights imbalance zones where price may return
Used for high-probability entry confirmation
5. Fibonacci Retracement Levels
Auto-calculated based on recent swing high/low
Key levels: 23.6%, 38.2%, 50%, 61.8%, 78.6%
Perfect for identifying profit-taking zones
Dynamic lines that update with market movement
6. Smart Signal Generation
The indicator generates BUY and SELL signals based on multi-condition confluence:
BUY Signal Requirements:
Price near lower Bollinger Band
RSI in oversold territory (< 30)
High volume confirmation (optional)
Bullish FVG or POC alignment
SELL Signal Requirements:
Price near upper Bollinger Band
RSI in overbought territory (> 70)
High volume confirmation (optional)
Bearish FVG or POC alignment
7. Automated Take Profit Levels
Three dynamic profit targets: 1%, 2%, and 3%
Automatically calculated from entry price
Visual markers on chart
Individual alerts for each level
8. Comprehensive Alert System
The indicator includes 10+ alert types:
Buy signal alerts
Sell signal alerts
Take profit level alerts (TP1, TP2, TP3)
Fibonacci level cross alerts
RSI overbought/oversold alerts
Bullish/Bearish FVG detection alerts
9. Real-Time Info Dashboard
Live display of all key metrics
Color-coded for quick visual analysis
Shows RSI, BB Width, Volume ratio, POC, Fib levels
Current signal status (BUY/SELL/WAIT)
How to Use
Setup
Add the indicator to your chart
Adjust parameters based on your trading style and timeframe
Set up alerts by clicking "Create Alert" and selecting desired conditions
Recommended Timeframes
Scalping: 5m - 15m
Day Trading: 15m - 1H
Swing Trading: 4H - Daily
Parameter Customization
Volume Profile Settings:
Length: 100 (adjust for more/less historical data)
Rows: 24 (granularity of volume distribution)
Bollinger Bands:
Length: 20 (standard period)
Multiplier: 2.0 (adjust for tighter/wider bands)
RSI Settings:
Length: 14 (standard momentum period)
Overbought: 70
Oversold: 30
Fibonacci:
Lookback: 50 (swing high/low detection period)
Signal Settings:
Volume Filter: Enable/disable volume confirmation
Volume MA Length: 20 (for volume comparison)
Trading Strategy Examples
Strategy 1: Trend Reversal
Wait for BUY signal at lower Bollinger Band
Confirm with bullish FVG or POC support
Enter position
Take partial profits at Fib 38.2% and 50%
Exit remaining position at TP3 or SELL signal
Strategy 2: Breakout Confirmation
Monitor price approaching POC level
Wait for volume spike
Enter on signal confirmation with FVG alignment
Use Fibonacci levels for scaling out
Strategy 3: Range Trading
Identify POC as range midpoint
Buy at lower BB with oversold RSI
Sell at upper BB with overbought RSI
Use FVG zones for additional confirmation
Best Practices
✅ Do:
Use multiple timeframe analysis
Combine with price action analysis
Set stop losses below/above recent swing points
Scale out at Fibonacci levels
Wait for volume confirmation on signals
❌ Don't:
Trade every signal blindly
Ignore overall market context
Use on extremely low timeframes without testing
Neglect risk management
Trade during low liquidity periods
Risk Management
Always use stop losses
Risk no more than 1-2% per trade
Consider market conditions and volatility
Scale position sizes based on signal strength
Use the volume filter for additional confirmation
Technical Specifications
Pine Script Version: 6
Overlay: Yes (displays on main chart)
Max Boxes: 500 (for FVG visualization)
Max Lines: 500 (for Fibonacci levels)
Alerts: 10+ customizable conditions
Performance Notes
This indicator works best in:
Trending markets with clear momentum
High-volume trading sessions
Assets with good liquidity
When multiple signals align
Less effective in:
Extremely choppy/sideways markets
Low-volume periods
During major news events (high volatility)
Updates & Support
This indicator is actively maintained and updated. Future enhancements may include:
Additional volume profile features
More sophisticated FVG tracking
Enhanced alert customization
Backtesting integration
Disclaimer
This indicator is for educational and informational purposes only. It does not constitute financial advice. Past performance does not guarantee future results. Always conduct your own research and consider consulting with a financial advisor before making trading decisions. Trading involves substantial risk of loss.

My script//@version=5
indicator("LTF Multi-Condition BUY Signal (v5 clean)", overlay=true, max_labels_count=100, max_lines_count=100)
// ───────────────── INPUTS ─────────────────
pivot_len = input.int(4, "Pivot sensitivity (structure)", minval=2, maxval=12)
range_len = input.int(20, "Range lookback for breakout", minval=5)
htf_tf = input.timeframe("480", "HTF timeframe (8H+)")
reclaim_window = input.int(5, "Reclaim window (bars)", minval=1)
ema_fast_len = input.int(9, "EMA fast length")
ema_slow_len = input.int(21, "EMA slow length")
rsi_len = input.int(14, "RSI length")
rsi_pivot_len = input.int(4, "RSI pivot sensitivity")
rsi_div_lookback = input.int(30, "RSI divergence max lookback (bars)")
daily_vol_mult = input.float(1.0, "Daily volume vs SMA multiplier", step=0.1)
htf_vol_sma_len = input.int(20, "HTF volume SMA length")
require_reclaim = input.bool(true, "Require HTF reclaim")
use_aggressive_HL = input.bool(false, "Aggressive HL detection")
// ───────────────── BASE INDICATORS ─────────────────
emaFast = ta.ema(close, ema_fast_len)
emaSlow = ta.ema(close, ema_slow_len)
rsiVal = ta.rsi(close, rsi_len)
// ───────────────── DAILY CHECKS (VOLUME & OBV) ─────────────────
// Daily OBV and previous value
daily_obv = request.security(syminfo.tickerid, "D",
ta.cum(ta.change(close) > 0 ? volume : ta.change(close) < 0 ? -volume : 0))
daily_obv_prev = request.security(syminfo.tickerid, "D",
ta.cum(ta.change(close) > 0 ? volume : ta.change(close) < 0 ? -volume : 0) )
// Daily volume & SMA
daily_vol = request.security(syminfo.tickerid, "D", volume)
daily_vol_sma = request.security(syminfo.tickerid, "D", ta.sma(volume, 20))
daily_vol_ok = not na(daily_vol) and not na(daily_vol_sma) and daily_vol > daily_vol_sma * daily_vol_mult
daily_obv_ok = not na(daily_obv) and not na(daily_obv_prev) and daily_obv > daily_obv_prev
// ───────────────── HTF SUPPORT / RECLAIM ─────────────────
htf_high = request.security(syminfo.tickerid, htf_tf, high)
htf_low = request.security(syminfo.tickerid, htf_tf, low)
htf_close = request.security(syminfo.tickerid, htf_tf, close)
htf_volume = request.security(syminfo.tickerid, htf_tf, volume)
htf_vol_sma = request.security(syminfo.tickerid, htf_tf, ta.sma(volume, htf_vol_sma_len))
htf_bull_reject = not na(htf_high) and not na(htf_low) and not na(htf_close) and (htf_close - htf_low) > (htf_high - htf_close)
htf_vol_confirm = not na(htf_volume) and not na(htf_vol_sma) and htf_volume > htf_vol_sma
htf_support_level = (htf_bull_reject and htf_vol_confirm) ? htf_low : na
// Reclaim: LTF close back above HTF support within N bars
reclaimed_now = not na(htf_support_level) and close > htf_support_level and ta.barssince(close <= htf_support_level) <= reclaim_window
htf_reclaim_ok = require_reclaim ? reclaimed_now : true
// ───────────────── STRUCTURE: BOS & HL (CoC) ─────────────────
swingHighVal = ta.pivothigh(high, pivot_len, pivot_len)
swingLowVal = ta.pivotlow(low, pivot_len, pivot_len)
swingHighCond = not na(swingHighVal)
swingLowCond = not na(swingLowVal)
lastSwingHigh = ta.valuewhen(swingHighCond, swingHighVal, 0)
prevSwingHigh = ta.valuewhen(swingHighCond, swingHighVal, 1)
lastSwingLow = ta.valuewhen(swingLowCond, swingLowVal, 0)
prevSwingLow = ta.valuewhen(swingLowCond, swingLowVal, 1)
bos_bull = not na(prevSwingHigh) and close > prevSwingHigh
hl_confirm = not na(lastSwingLow) and not na(prevSwingLow) and lastSwingLow > prevSwingLow and ta.barssince(swingLowCond) <= 30
if use_aggressive_HL
hl_confirm := hl_confirm or (low > low and ta.barssince(swingLowCond) <= 12)
// ───────────────── RSI BULLISH DIVERGENCE ─────────────────
rsiLowVal = ta.pivotlow(rsiVal, rsi_pivot_len, rsi_pivot_len)
rsiLowCond = not na(rsiLowVal)
priceAtRsiLowA = ta.valuewhen(rsiLowCond, low , 0)
priceAtRsiLowB = ta.valuewhen(rsiLowCond, low , 1)
rsiLowA = ta.valuewhen(rsiLowCond, rsiVal , 0)
rsiLowB = ta.valuewhen(rsiLowCond, rsiVal , 1)
rsi_div_ok = not na(priceAtRsiLowA) and not na(priceAtRsiLowB) and not na(rsiLowA) and not na(rsiLowB) and
(priceAtRsiLowA < priceAtRsiLowB) and (rsiLowA > rsiLowB) and ta.barssince(rsiLowCond) <= rsi_div_lookback
// ───────────────── RANGE BREAKOUT ─────────────────
range_high = ta.highest(high, range_len)
range_breakout = ta.crossover(close, range_high)
// ───────────────── EMA CROSS / TREND ─────────────────
ema_cross_happened = ta.crossover(emaFast, emaSlow)
ema_trend_ok = emaFast > emaSlow
// ───────────────── FINAL BUY CONDITION ─────────────────
all_price_checks = bos_bull and hl_confirm and rsi_div_ok and range_breakout
all_filter_checks = ema_trend_ok and ema_cross_happened and daily_vol_ok and daily_obv_ok and htf_reclaim_ok
buy_condition = all_price_checks and all_filter_checks
// ───────────────── PLOTS & ALERT ─────────────────
plotshape(
buy_condition,
title = "BUY Signal",
location = location.belowbar,
style = shape.labelup,
text = "BUY",
textcolor = color.white,
color = color.green,
size = size.small)
plot(htf_support_level, title="HTF Support", color=color.new(color.green, 0), linewidth=2, style=plot.style_linebr)
alertcondition(buy_condition, title="LTF BUY Signal", message="LTF BUY Signal on {{ticker}} ({{interval}}) — all conditions met")

able zone# able zone
## 📋 Overview
**able zone** is an advanced Support & Resistance zone detection indicator optimized for **15-minute timeframe trading**. It combines Price Action, Volume Profile, and intelligent zone analysis to identify high-probability trading areas with precise entry and exit points.
## 🎯 Core Features
### 1. **Zone Detection Methods**
- **Auto Detect**: Automatically finds the best zones using combined analysis
- **Price Action**: Based on pivot points and price structure
- **Volume Profile**: Identifies High Volume Nodes (HVN) where most trading occurred
- **Combined**: Uses all methods together for comprehensive analysis
### 2. **Zone Types & Colors**
- 🟢 **Support Zones** (Green): Price tends to bounce up from these areas
- 🔴 **Resistance Zones** (Red): Price tends to reverse down from these areas
- 🟣 **HVN Zones** (Purple): High volume areas from Volume Profile
- **Strong Zones**: Darker colors indicate zones with more touches (higher reliability)
### 3. **Zone Strength Indicators**
- **Labels**: "S3" = Support with 3 touches, "R5" = Resistance with 5 touches
- **Touch Count**: More touches = stronger zone
- **Min Touch Count Setting**: Adjust to filter weak zones (default: 3)
## ⚙️ Settings Guide
### **Zone Detection Settings**
- **Detection Method**: Choose your preferred analysis method
- **Lookback Period** (50-500): How many bars to analyze (default: 200)
- For 15min: 200 bars = ~50 hours of data
- Shorter = Recent zones only
- Longer = Historical zones included
- **Min Touch Count** (2-10): Minimum touches to qualify as a zone (default: 3)
- **Zone Thickness %** (0.1-2.0): How thick the zones appear (default: 0.5)
- Based on ATR for dynamic sizing on 15min chart
### **Zone Colors**
Fully customizable colors for:
- Support Zone (default: Green)
- Resistance Zone (default: Red)
- Strong Support/Resistance (darker shades)
- Volume Profile Zone (default: Purple)
### **Zone Touch Detection**
- **Enable Touch Alerts**: Get notifications when price enters zones
- **Touch Distance %** (0.1-1.0): How close to zone counts as "touch" (default: 0.3%)
- On 15min chart, this gives early warning signals
- **Show Touch Markers**: Visual indicators when price touches zones
- 🔺 = Support touch (potential buy)
- 🔻 = Resistance touch (potential sell)
- 💎 = HVN touch (watch for breakout/rejection)
### **Volume Profile Integration**
- **Show VP Zones**: Display high volume node zones
- **VP Resolution** (20-50): Number of price levels analyzed (default: 30)
- **POC Line** (orange): Point of Control - highest volume price level
- **POC Width**: Line thickness (1-3)
- **Show HVN**: Display High Volume Node zones
- **HVN Threshold** (0.5-0.9): Volume % to qualify as HVN (default: 0.7)
### **Display Options**
- **Zone Labels**: Show S/R labels with touch count
- **Zone Border Lines**: Dotted lines at zone boundaries
- **Extend Zones Right**: Project zones into future
- **Max Visible Zones** (5-50): Maximum number of zones displayed (default: 20)
- Adjust based on chart clarity needs
- **Info Table**: Real-time information dashboard
## 📊 Info Table Explained
The info table (top-right corner) provides real-time zone analysis:
### **Row 1: ZONE Header**
- Shows current timeframe (15m)
- Total active zones
- "able" branding
### **Row 2: 🎯 TOUCH Status**
- **RES**: Currently touching resistance (⚠️ potential reversal down)
- **SUP**: Currently touching support (🚀 potential bounce up)
- **HVN**: Currently in high volume area (⚡ watch for direction)
- **FREE**: Not near any zone (⏳ wait for setup)
- Progress bar shows proximity strength
- Arrows indicate zone type
### **Row 3: 🟢 SUP - Support Zones**
- Number of active support zones below current price
- Progress bar shows relative quantity
- More support = stronger floor
### **Row 4: 🔴 RES - Resistance Zones**
- Number of active resistance zones above current price
- Progress bar shows relative quantity
- More resistance = stronger ceiling
### **Row 5: 🟣 HVN - High Volume Nodes**
- Number of HVN zones (from Volume Profile)
- These are areas where most trading activity occurred
- Often act as magnets for price
### **Row 6: 📍 NEAR - Nearest Zone**
- Shows closest zone type (SUP/RES/HVN)
- Distance in % to nearest zone
- Arrow shows if zone is above or below
### **Row 7: POSITION - Price Position**
- **HIGH**: Price near range top (70%+) - watch for resistance
- **MID**: Price in middle range (30-70%) - neutral zone
- **LOW**: Price near range bottom (<30%) - watch for support
- Shows exact position % in lookback range
### **Row 8: ═ SIGNAL ═**
- **🚀 BUY**: Touching support zone (entry opportunity)
- **⚠️ SELL**: Touching resistance zone (exit/short opportunity)
- **⚡ WATCH**: At HVN (prepare for breakout or rejection)
- **⏳ WAIT**: No clear setup (be patient)
## 🎓 Trading Strategy for 15-Minute Timeframe
### **Basic Setup**
1. Set timeframe to **15 minutes**
2. Use **Auto Detect** or **Combined** method
3. Set **Lookback Period**: 200 bars (~50 hours)
4. Set **Min Touch Count**: 3 (proven zones)
### **Entry Signals**
#### **Long Entry (Buy)**
- Price touches green support zone
- Table shows "🚀 BUY" signal
- Look for bullish candle pattern (hammer, engulfing)
- Volume increases on bounce
- **Best Entry**: Bottom of support zone
- **Stop Loss**: Below support zone (1-2 ATR)
- **Target**: Next resistance zone or 2:1 RR
#### **Short Entry (Sell)**
- Price touches red resistance zone
- Table shows "⚠️ SELL" signal
- Look for bearish candle pattern (shooting star, engulfing)
- Volume increases on rejection
- **Best Entry**: Top of resistance zone
- **Stop Loss**: Above resistance zone (1-2 ATR)
- **Target**: Next support zone or 2:1 RR
#### **HVN Breakout Strategy**
- Price approaches purple HVN zone
- Table shows "⚡ WATCH"
- Wait for breakout with strong volume
- **If breaks up**: Go long, target next resistance
- **If breaks down**: Go short, target next support
### **Zone Strength Rules**
- **S5+ or R5+**: Very strong zones (high probability)
- **S3-S4 or R3-R4**: Reliable zones (good setups)
- **S2 or R2**: Weak zones (use caution)
### **Best Trading Times (15min)**
- **London Open**: 08:00-12:00 GMT (high volume)
- **NY Open**: 13:00-17:00 GMT (high volatility)
- **Overlap**: 13:00-16:00 GMT (best setups)
- **Avoid**: Asian session low volatility periods
### **Risk Management**
- Never risk more than 1-2% per trade
- Use stop loss ALWAYS (place outside zones)
- Take partial profits at 1:1, let rest run to 2:1 or 3:1
- If price consolidates in zone > 3 candles, exit
## ⚠️ Important Notes
### **When Zones Work Best**
✅ Clear trending markets
✅ After significant price movements
✅ At session opens (London/NY)
✅ When multiple zones align
✅ Strong zone with 5+ touches
### **When to Be Cautious**
❌ During major news releases (use economic calendar)
❌ Very low volume periods
❌ Price consolidating inside zone
❌ Weak zones with only 2 touches
❌ Conflicting signals from multiple indicators
### **15-Minute Specific Tips**
- **Lookback 200**: Captures 2-3 trading days of zones
- **Touch Distance 0.3%**: Early signals on 15min moves
- **Max Zones 20**: Keeps chart clean but comprehensive
- **Watch POC**: Often acts as pivot on 15min
- **Volume spike + zone touch** = high probability setup
## 🔧 Recommended Settings for 15min
### **Conservative Trader**
- Detection Method: Combined
- Min Touch Count: 4
- Max Zones: 15
- Touch Distance: 0.2%
### **Aggressive Trader**
- Detection Method: Auto Detect
- Min Touch Count: 2
- Max Zones: 25
- Touch Distance: 0.5%
### **Volume Profile Focused**
- Detection Method: Volume Profile
- Show HVN: Yes
- HVN Threshold: 0.6
- Show POC: Yes
## 📈 Example Trade Scenario (15min)
**Setup**: BTC/USD on 15-minute chart
1. Price approaching green support zone at $42,000
2. Zone label shows "S4" (touched 4 times)
3. Table shows "🚀 BUY" signal
4. Volume increasing on approach
5. Bullish hammer candle forms
**Entry**: $42,050 (bottom of zone)
**Stop Loss**: $41,900 (below zone)
**Target 1**: $42,350 (2:1 RR)
**Target 2**: Next resistance at $42,650
**Result**: Price bounces, hits Target 1 in 3 candles (~45min)
## 💡 Pro Tips
1. **Combine with trend**: Trade in direction of higher timeframe trend
2. **Multiple touches**: Zones with 5+ touches are highest probability
3. **Volume confirmation**: Always check volume on zone touch
4. **POC magnet**: Price often returns to POC line
5. **False breakouts**: If price barely breaks zone and returns = strong signal
6. **Zone-to-zone**: Trade from support to resistance, resistance to support
7. **Time of day**: Best setups occur during peak volume hours
8. **Chart timeframe**: Use 1H to confirm trend, 15min for entry
9. **News avoidance**: Close trades before high-impact news
10. **Zone clusters**: Multiple zones together = strong area
---
**Created by able** | Optimized for 15-minute trading
**Version**: 1.0 | Compatible with TradingView Pine Script v5
For support and updates, enable alerts and monitor the info table in real-time!
