True Seasonal Pattern [tradeviZion]True Seasonal Pattern: Uncover Hidden Market Cycles
Markets have rhythms and patterns that repeat with surprising regularity. The True Seasonal Pattern indicator reveals these hidden cycles across different timeframes, helping you anticipate potential market movements based on historical seasonal tendencies.
What This Indicator Does
The True Seasonal Pattern analyzes years of historical price data to identify recurring seasonal trends. It then plots these patterns on your chart, showing you both the historical pattern and future projection based on past seasonal behavior.
Automatic Timeframe Detection: Works with Monthly, Weekly, and Daily charts
Historical Pattern Analysis: Analyzes up to 100 years of data (customizable)
Future Projection: Projects the seasonal pattern ahead on your chart
Smart Smoothing: Applies appropriate smoothing based on your timeframe
How to Use This Indicator
Add the indicator to a Daily, Weekly, or Monthly chart (not designed for intraday timeframes)
The indicator automatically detects your chart's timeframe
The blue line shows the historical seasonal pattern
Watch for potential turning points in the pattern that align with other technical signals
Seasonal patterns work best as a supporting factor in your analysis, not as standalone trading signals. They are particularly effective in markets with well-established seasonal influences.
Best Applications
Futures Markets: Commodities and futures often show strong seasonal tendencies due to production cycles, weather patterns, and economic factors
Stock Indices: Many stock markets demonstrate regular seasonal patterns (like the "Sell in May" phenomenon)
Individual Stocks: Companies with seasonal business cycles often show predictable price patterns
Practical Applications
Identify potential turning points based on historical seasonal patterns
Plan entries and exits around seasonal tendencies
Add seasonal context to your existing technical analysis
Understand why certain months or periods might show consistent behavior
Pro Tip: For best results, use this tool on instruments with at least 5+ years of historical data. Longer timeframes often reveal more reliable seasonal patterns.
Important Notes
This indicator works best on Daily, Weekly, and Monthly timeframes - not intraday charts
Seasonal patterns are tendencies, not guarantees
Always combine seasonal analysis with other technical tools
Past patterns may not repeat exactly in the future
// Sample of the seasonal calculation approach
float yearHigh = array.max(currentYearHighs)
float yearLow = array.min(currentYearLows)
// Calculate seasonality for each period
for i = 0 to array.size(currentYearCloses) - 1
float periodClose = array.get(currentYearCloses, i)
if not na(periodClose) and yearHigh != yearLow
float seasonality = (periodClose - yearLow) / (yearHigh - yearLow) * 100
I developed this indicator to help traders incorporate seasonal analysis into their trading approach without the complexity of traditional seasonal tools. Whether you're analyzing agricultural commodities, energy futures, or stock indices, understanding the seasonal context can provide valuable insights for your trading decisions.
Remember: Markets don't always follow seasonal patterns, but when they do, being aware of these tendencies can give you a meaningful edge in your analysis.
Seasonalpatterns

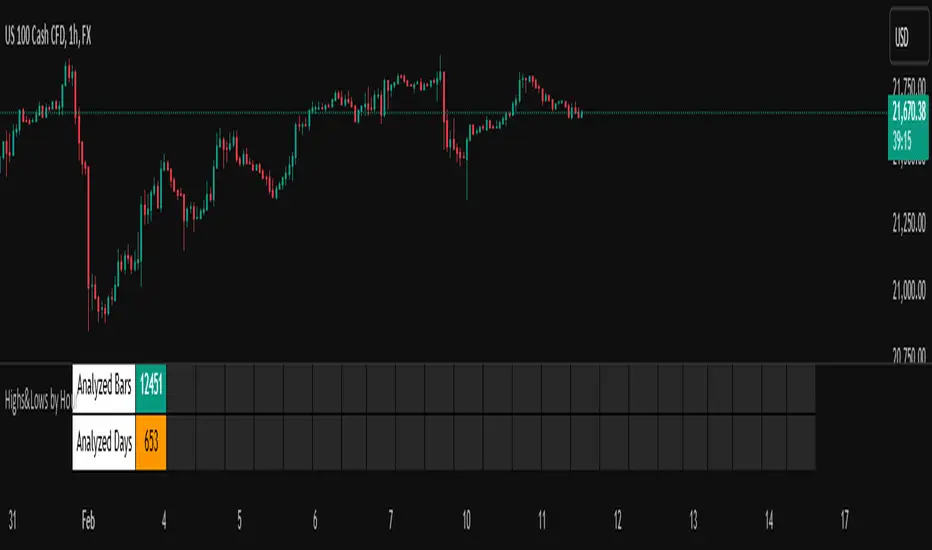
Highs&Lows by HourHighs & Lows by Hour
Description:
Highs & Lows by Hour is a TradingView indicator that helps traders identify the most frequent hours at which daily high and low price points occur. By analyzing historical price data directly from the TradingView chart, this tool provides valuable insights into market timing, allowing traders to optimize their strategies around key price movements.
This indicator is specifically designed for the one-hour (H1) timeframe . It does not display any data on other timeframes , as it relies on analyzing daily highs and lows within hourly periods.
This indicator processes the available data based on the number of historical bars loaded in the TradingView chart. The number of analyzed bars depends on the TradingView subscription plan , which determines how much historical data is accessible.
Key Features:
Works exclusively on the H1 timeframe , ensuring accurate analysis of daily highs and lows
Hourly highs and lows analysis to identify the most frequent hours when the market reaches its daily high and low
Sorted by frequency, displaying the most significant trading hours in descending order based on their recurrence
Customizable table and colors to fit the chart theme and trading style
Useful for scalpers, day traders, and swing traders to anticipate potential price reversals and breakouts
How It Works:
The indicator scans historical price data directly from the TradingView chart to detect the hour at which daily highs and daily lows occur.
It counts the frequency of highs and lows for each hour of the trading day based on the number of available bars in the TradingView chart.
The recorded data is displayed in a structured table, sorted by frequency from highest to lowest.
Users can customize colors to enhance readability and seamlessly integrate the indicator into their analysis.
Why Use This Indicator?
Identify key market patterns by recognizing the most critical hours when price extremes tend to form
Improve timing for trades by aligning entries and exits with high-probability time windows
Enhance market awareness by understanding when market volatility is likely to peak based on historical trends
Important Notes:
This indicator works only on the one-hour (H1) timeframe . It will not display any data on other timeframes
Works well on Forex, stocks, crypto, and futures , especially for intraday traders
The indicator analyzes only the historical bars available on the TradingView chart, which varies depending on the TradingView subscription plan (Free, Pro, Pro+, Premium)
This indicator does not generate buy or sell signals but serves as a data-driven tool for market analysis
How to Use:
Apply the Highs & Lows by Hour indicator to a one-hour (H1) chart on TradingView
Review the table displaying the most frequent hours for daily highs and lows
Adjust colors and settings for better visualization
Use the data to refine trading decisions and align strategy with historical price behavior
Seasonal Tendency (fadi)Seasonal tendency refers to the patterns in stock market performance that tend to repeat at certain times of the year. These patterns can be influenced by various factors such as economic cycles, investor behavior, and historical trends. For example, the stock market often performs better during certain months like November to April, a phenomenon known as the “best six months” strategy. Conversely, months like September are historically weaker.
These tendencies can help investors and traders make more informed decisions by anticipating potential market movements based on historical data. However, it’s important to remember that past performance doesn’t guarantee future results.
This indicator calculates the average daily move patterns over the specified number of years and then removes any outliers.
Settings
Number of years : The number of years to use in the calculation. The number needs to be large enough to create a pattern, but not so large that it may distort the price move.
Seasonality line color : The plotted line color.
Border : Show or hide the border and the color to use.
Grid : Show or hide the grid and the color to use.
Outlier Factor : The Outlier Factor is used to identify unusual price moves that are not typical and neutralize them to avoid skewing the predictions. It is the amount of deviation calculated using the total median price move.
