Buy / Sell Signals With Take Profits (Non-Repaint)This indicator generates automatic BUY/SELL flip signals based on trend direction, volatility status, and ATR dynamics.
Labels are placed based on actual High/Low and do not shift.
Features
✔ Dynamic ATR Multipliers
✔ Volatility Stretch (calm market → narrow, aggressive → wide)
✔ Trend Memory (25-bar direction memory)
✔ Automatic TP1–TP5 (%1 – %5) calculation
✔ Desktop & Mobile compatible TP Panel
✔ Bull/Bear Flip labels
✔ TradingView alert support
Suitable Markets
Forex, Crypto, Stocks, Indices, Gold, Oil
Works on all timeframes (5min – 1min – 4min – Daily).
⚠ Important Note
This tool is not investment advice.
It does not provide any buy–sell recommendations.
All trading decisions are yours; risk management is entirely the user's responsibility.
Sellsignal

Reversal Buy and Sell SignalsThis indicator is fast and minimalistic reversal-detection indicator designed to capture high-probability turning points in the market. It combines engulfing candlestick patterns, a strong candle body filter, and RSI momentum analysis to generate precise BUY and SELL signals with minimal noise.

VWAP Trend
**Overview**
The VWAP Trend indicator is a volume-weighted price analysis tool that visualizes the relationship between price and the anchored Volume Weighted Average Price (VWAP) over different timeframes. This script is designed to reveal when the market is trending above or below its volume-weighted equilibrium point, providing a clear framework for identifying directional bias, trend strength, and potential reversals.
By combining an anchored VWAP with exponential smoothing and a secondary trend EMA, the indicator helps traders distinguish between short-term price fluctuations and genuine volume-supported directional moves.
**Core Concept**
VWAP (Volume Weighted Average Price) represents the average price of an asset weighted by traded volume. It reflects where the majority of trading activity has taken place within a chosen period, serving as a critical reference level for institutions and professional traders.
This indicator extends the traditional VWAP concept by:
1. Allowing users to **anchor VWAP to different timeframes** (Daily, Weekly, or Monthly).
2. Applying **smoothing** to create a stable reference curve less prone to noise.
3. Overlaying a **trend EMA** to identify whether current price momentum aligns with or diverges from VWAP equilibrium.
The combination of these elements produces a visual representation of price’s relationship to its fair value across time, helping to identify accumulation and distribution phases.
**Calculation Methodology**
1. **Anchored VWAP Calculation:**
The script resets cumulative volume and cumulative volume–price data at the start of each new VWAP session (based on the selected anchor timeframe). It continuously accumulates the product of price and volume, dividing this by total volume to compute the current VWAP value.
2. **Smoothing Process:**
The raw VWAP line is smoothed using an Exponential Moving Average (EMA) of user-defined length, producing a cleaner, more stable trend curve that minimizes intraperiod noise.
3. **Trend Determination:**
An additional EMA is calculated on the closing price. By comparing the position of this EMA to the smoothed VWAP, the indicator determines the prevailing market bias:
* When the trend EMA is above the smoothed VWAP, the market is considered to be in an **uptrend**.
* When the trend EMA is below the smoothed VWAP, the market is classified as a **downtrend**.
**Visual Structure**
The indicator uses color dynamics and chart overlays to make interpretation intuitive:
* **Smoothed VWAP Line:** The main trend reference, colored blue during bullish conditions and orange during bearish conditions.
* **Price Fill Region:** The area between the smoothed VWAP and price is filled with a translucent color matching the current trend, visually representing whether price is trading above or below equilibrium.
* **Trend EMA (implicit):** Although not separately plotted, it drives the color state of the VWAP, ensuring seamless visual transitions between bullish and bearish conditions.
**Inputs and Parameters**
* **VWAP Timeframe:** Choose between Daily, Weekly, or Monthly anchoring. This determines the reset frequency for cumulative volume and price data.
* **VWAP Smoothing Length:** Defines how many periods are used to smooth the VWAP line. Shorter values produce a more reactive line; longer values create smoother, steadier signals.
* **Trend EMA Length:** Sets the period for the trend detection EMA applied to price. Adjust this to calibrate how quickly the indicator reacts to directional changes.
**Interpretation and Use Cases**
* **Trend Confirmation:** When price and the trend EMA both remain above the smoothed VWAP, the market is showing strong bullish control. Conversely, consistent price action below the VWAP suggests sustained bearish sentiment.
* **Fair Value Assessment:** VWAP serves as a dynamic equilibrium level. Price repeatedly reverting to this line indicates consolidation or fair value zones, while strong directional moves away from VWAP highlight momentum phases.
* **Institutional Benchmarking:** Because large market participants often benchmark entries and exits relative to VWAP, this indicator helps align retail analysis with institutional logic.
* **Reversal Detection:** Sudden crossovers of the trend EMA relative to the VWAP can signal potential reversals or shifts in momentum strength.
**Trading Applications**
* **Trend Following:** Use VWAP’s direction and color state to determine trade bias. Long entries are favored when the VWAP turns blue, while short entries align with orange phases.
* **Mean Reversion:** In ranging conditions, traders may look for price deviations far above or below VWAP as potential reversion opportunities.
* **Multi-Timeframe Confluence:** Combine the Daily VWAP Trend with higher anchor periods (e.g., Weekly or Monthly) to confirm larger trend structure.
* **Support and Resistance Mapping:** VWAP often acts as a strong intraday or session-level support/resistance zone. The smoothed version refines this behavior into a cleaner, more reliable reference.
**Originality and Innovation**
The VWAP Trend indicator stands apart from conventional VWAP scripts through several original features:
1. **Anchor Flexibility:** Most VWAP indicators fix the anchor to a specific session (like daily). This version allows switching between Daily, Weekly, and Monthly anchors dynamically, adapting to various trading styles and time horizons.
2. **Volume-Weighted Smoothing:** The use of an EMA smoothing layer over the raw VWAP provides enhanced stability without compromising responsiveness, delivering a more analytically consistent signal.
3. **EMA-Based Trend Comparison:** By introducing a second trend EMA, the indicator creates a comparative framework that merges volume-weighted price analysis with classical momentum tracking — a rare and powerful combination.
4. **Adaptive Visual System:** The color-shifting and shaded fill between VWAP and price are integrated into a single, lightweight structure, giving traders immediate insight into market bias without the clutter of multiple overlapping indicators.
**Advantages**
* Adaptable to any market, timeframe, or trading style.
* Provides both equilibrium (VWAP) and momentum (EMA) perspectives.
* Smooths out noise while retaining the integrity of volume-based price dynamics.
* Enhances situational awareness through intuitive color-coded visualization.
* Ideal for professional, swing, and intraday traders seeking context-driven market direction.
**Summary**
The VWAP Trend indicator is a modern enhancement of the classical VWAP methodology. By merging anchored volume-weighted analysis with smoothed trend detection and visual state feedback, it provides a comprehensive perspective on market equilibrium and directional strength. It is built for traders who seek more than static price references — offering an adaptive, volume-aware framework for identifying market trends, reversals, and fair-value zones with precision and clarity.


SZN - Altcoin OscillatorSZN Altcoin Oscillator – Identify Market Phases with Precision
What is the SZN Altcoin Oscillator?
The SZN Altcoin Oscillator is a multi-layered analysis indicator specifically developed for the altcoin market.
It combines different signal groups (trend, relative strength, volume, market environment, and overheating filters) into a unified oscillator in the 0–100 range.
--> The goal is to make major market movements visible while separating short-term fluctuations from broader trends.
Why not just use RSI or MACD?
Classic single indicators like RSI or MACD often react too sensitively to short-term fluctuations.
This leads to many false signals – especially during volatile altcoin phases.
--> The SZN Altcoin Oscillator solves this problem by combining and filtering multiple signal sources.
--> This smooths out overreactions and identifies true trend movements more reliably.
-----
How does it work?
The oscillator consists of five signal groups:
Price & Trend Momentum
checks the relative position of fast and slow moving averages
detects whether an altcoin is in a confirmed uptrend or downtrend
Relative Strength vs. Bitcoin & Ethereum
measures performance compared to the two market leaders
shows whether capital is rotating into altcoins or staying in majors
Volume and Breakout Filter
detects whether breakouts are confirmed by increased volume
prevents short “fakeouts” from appearing as buy signals
Market Environment (Regime Filter)
includes overall market data such as BTC dominance or TOTAL3
ensures that buy signals only trigger in suitable market phases
Overheating & Oversold Filter
marks statistically extreme zones
upward cross from oversold → buy signal
downward cross from overheated → sell signal
--> All results are displayed in a 0–100 oscillator.
Buy signal: upward cross from oversold zones
Sell signal: downward cross from overheated zones
-----
Variants (selection in the settings menu)
The indicator offers 5 preconfigured variants, optimized for different altcoin groups:
Default
The neutral standard configuration – balanced between sensitivity and stability. Suitable for a wide range of altcoins with medium to large market capitalization.
Large Caps
More conservative parameters with stronger smoothing. Designed for established projects (Top 20), where trends develop more slowly but with higher reliability.
Mid Caps
A balanced approach for mid-sized market caps. More sensitive than the Large-Cap variant, but filters more noise than the Small-Cap settings.
Small Caps
Higher sensitivity, optimized for more volatile coins (Top 100–200). Detects dynamic moves faster, but with higher risk of false signals.
Meme Coins
Adapted for highly speculative tokens. Accounts for extreme volatility and shorter cycles to better highlight overheating phases.
--> This allows each user to select the variant best suited to the asset category being analyzed.
-----
Recommended Usage
Timeframe: Daily chart (highest precision). For very new projects, the 8h chart can be used.
Asset selection: Coins with sufficient history (at least 200 trading days).
-----
Interpretation:
Oscillator rising from oversold → potential bottom / upward trend reversal
Oscillator falling from overheated → potential top / profit-taking zone
Movements in between indicate interim rallies or correction phases
The indicator is not a day-trading tool, but optimized for cyclical moves and swing trading.
-----
Notes:
The SZN Altcoin Oscillator is an additional analysis tool and does not replace independent trading decisions.
All signals are probabilistic; there is no guarantee of profits.
Effectiveness depends on the specific altcoin and the current market phase.
The indicator provides insights into broader market phases, not short-term price moves.

Wickless Heikin Ashi B/S [CHE]Wickless Heikin Ashi B/S \
Purpose.
Wickless Heikin Ashi B/S \ is built to surface only the cleanest momentum turns: it prints a Buy (B) when a bullish Heikin-Ashi candle forms with virtually no lower wick, and a Sell (S) when a bearish Heikin-Ashi candle forms with no upper wick. Optional Lock mode turns these into one-shot signals that hold the regime (bull or bear) until the opposite side appears. The tool can also project dashed horizontal lines from each signal’s price level to help you manage entries, stops, and partial take-profits visually.
How it works.
The indicator computes standard Heikin-Ashi values from your chart’s OHLC. A bar qualifies as bullish if its HA close is at or above its HA open; bearish if below. Then the wick on the relevant side is compared to the bar’s HA range. If that wick is smaller than your selected percentage threshold (plus a tiny tick epsilon to avoid rounding noise), the raw condition is considered “wickless.” Only one side can fire; on the rare occasion both raw conditions would overlap, the bar is ignored to prevent false dual triggers. When Lock is enabled, the first valid signal sets the active regime (background shaded light green for bull, light red for bear) and suppresses further same-side triggers until the opposite side appears, which helps reduce overtrading in chop.
Why wickless?
A missing wick on the “wrong” side of a Heikin-Ashi candle is a strong hint of persistent directional pressure. In practice, this filters out hesitation bars and many mid-bar flips. Traders who prefer entering only when momentum is decisive will find wickless bars useful for timing entries within an established bias.
Visuals you get.
When a valid buy appears, a small triangle “B” is plotted below the bar and a green dashed line can extend to the right from the signal’s HA open price. For sells, a triangle “S” above the bar and a red dashed line do the same. These lines act like immediate, price-anchored references for stop placement and profit scaling; you can shift the anchor left by a chosen number of bars if you prefer the line to start a little earlier for visual alignment.
How to trade it
Establish context first.
Pick a timeframe that matches your style: intraday index or crypto traders often use 5–60 minutes; swing traders might prefer 2–4 hours or daily. The tool is agnostic, but the cleanest results occur when the market is already trending or attempting a fresh breakout.
Entry.
When a B prints, the simplest rule is to enter long at or just after bar close. A conservative variation is to require price to take out the high of the signal bar in the next bar(s). For S, invert the logic: enter short on or after close, or only if price breaks the signal bar’s low.
Stop-loss.
Place the stop beyond the opposite extreme of the signal HA bar (for B: under the HA low; for S: above the HA high). If you prefer a static reference, use the dashed line level (signal HA open) or an ATR buffer (e.g., 1.0–1.5× ATR(14)). The goal is to give the trade enough room that normal noise does not immediately knock you out, while staying small enough to keep the risk contained.
Take-profit and management.
Two pragmatic approaches work well:
R-multiple scaling. Define your initial risk (distance from entry to stop). Scale out at 1R, 2R, and let a runner go toward 3R+ if structure holds.
Trailing logic. Trail behind a short moving average (e.g., EMA 20) or progressive swing points. Many traders also exit on the opposite signal when Lock flips, especially on faster timeframes.
Position sizing.
Keep risk per trade modest and consistent (e.g., 0.25–1% of account). The indicator improves timing; it does not replace risk control.
Settings guidance
Max lower wick for Bull (%) / Max upper wick for Bear (%).
These control how strict “wickless” must be. Tighter values (0.3–1.0%) yield fewer but cleaner signals and are great for strong trends or low-noise instruments. Looser values (1.5–3.0%) catch more setups in volatile markets but admit more noise. If you notice too many borderline bars triggering during high-volatility sessions, increase these thresholds slightly.
Lock (one-shot until opposite).
Keep Lock ON when you want one decisive signal per leg, reducing noise and signal clusters. Turn it OFF only if your plan intentionally scales into trends with multiple entries.
Extended lines & anchor offset.
Leave lines ON to maintain a visual memory of the last trigger levels. These often behave like near-term support/resistance. The offset simply lets you start that line one or more bars earlier if you prefer the look; it does not change the math.
Colors.
Use distinct bull/bear line colors you can read easily on your theme. The default lime/red scheme is chosen for clarity.
Practical examples
Momentum continuation (long).
Price is above your baseline (e.g., EMA 200). A B prints with a tight lower wick filter. Enter on close; stop under the signal HA low. Price pushes up in the next bars; you scale at 1R, trail the rest with EMA 20, and finally exit when a distant S appears or your trail is hit.
Breakout confirmation (short).
Following a range, price breaks down and prints an S with no upper wick. Enter short as the bar closes or on a subsequent break of the signal bar’s low. If the next bar immediately rejects and prints a bullish HA bar, your stop above the signal HA high limits damage. Otherwise, ride the move, harvesting partials as the red dashed line remains unviolated.
Alerts and automation
Set alerts to “Once Per Bar Close” for stability.
Bull ONE-SHOT fires when a valid buy prints (and Lock allows it).
Bear ONE-SHOT fires for sells analogously.
With Lock enabled, you avoid multiple pings in the same direction during a single leg—useful for webhooks or mobile notifications.
Reliability and limitations
The script calculates from completed bars and does not use higher-timeframe look-ahead or repainting tricks. Heikin-Ashi smoothing can lag turns slightly, which is expected and part of the design. In narrow ranges or whipsaw conditions, signals naturally thin out; if you must trade ranges, either tighten the wick filters and keep Lock ON, or add a trend/volatility filter (e.g., trade B only above EMA 200; S only below). Remember: this is an indicator, not a strategy. If you want exact statistics, port the triggers into a strategy and backtest with your chosen entry, stop, and exit rules.
Final notes
Wickless Heikin Ashi B/S \ is a precision timing tool: it waits for decisive, wickless HA bars, provides optional regime locking to reduce noise, and leaves clear price anchors on your chart for disciplined management. Use it with a simple framework—trend bias, fixed risk, and a straightforward exit plan—and it will keep your execution consistent without cluttering the screen or your decision-making.
Disclaimer: This indicator is for educational use and trade assistance only. It is not financial advice. You alone are responsible for your risk and results.
Enhance your trading precision and confidence with Wickless Heikin Ashi B/S ! 🚀
Happy trading
Chervolino

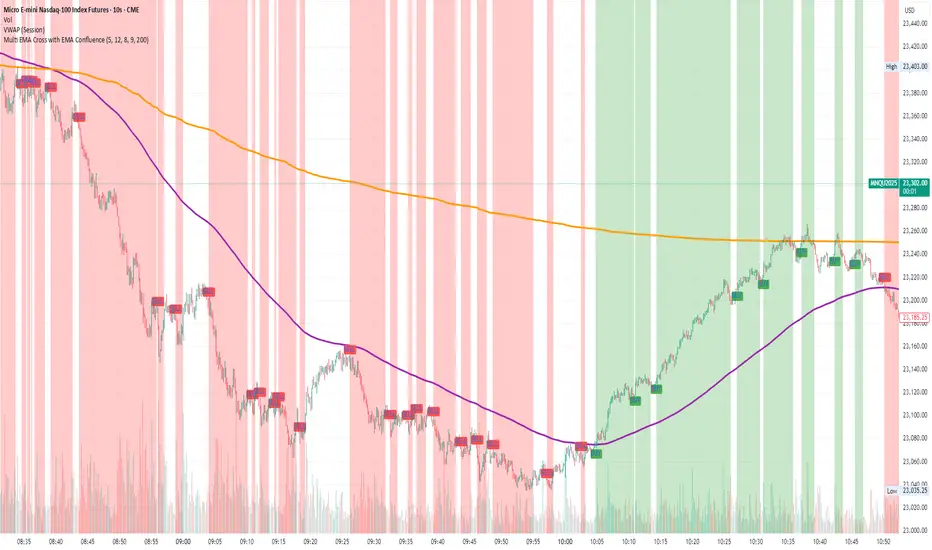
Multi EMA Cross with EMA ConfluenceMulti EMA Cross with EMA Confluence
This indicator combines the power of multiple EMA crossovers with a higher-timeframe confluence filter to help traders visualize potential bullish and bearish conditions on their charts.
Two groups of EMAs work together to establish alignment:
Group 1 (Fast / Slow Pair) – Shorter-term momentum shifts
Group 2 (Fast / Slow Pair) – Broader trend confirmation
On top of that, an optional Confluence EMA (default 200 EMA) acts as an additional filter, ensuring that signals align with the larger market trend.
Key features:
Customizable EMA lengths, colors, and confluence settings
Background highlighting when conditions align bullish or bearish
Clear buy/sell labels when new conditions trigger
Flexible enough to adapt across timeframes and trading styles
This tool is designed to enhance chart clarity and help you stay aligned with momentum and trend. It is not meant to replace your own analysis but rather to complement it.
Disclaimer: This script is for educational and informational purposes only. It is not financial advice. Trading involves risk, and you should always do your own research or consult with a licensed financial professional before making investment decisions.
Engineer_Invest Target SellEngineer_Invest Target Sell is a Simple and Affordable Tool for Exiting a Deal
Engineer_Invest Target Sell is an indicator that helps you quickly determine the best levels for profit taking. It is designed in such a way that it is easy for even a beginner to understand when it is worth selling an asset.
The way it works:
1. Two levels for sale:
The indicator calculates two key points (or lines) on the chart where it is beneficial to lock in profits. This helps you see where you can reduce your risk and lock in revenue.
2. Three modes for different market moods:
Depending on the market volatility, the setup is divided into three modes:
Target Sell 3 (High Volatility): for fast market movements.
Target Sell 2 (Average Volatility): for balanced conditions.
Target Sell 1 (Low Volatility): for quiet trading sessions.
This separation allows the indicator to be adapted to any market conditions.
Simple settings:
You can choose the type of moving average (SMA or EMA) and adjust the transparency and color of the labels so that the information on the chart is as clear and easy to understand as possible.
Ease of use:
Visibility:
The indicator draws lines and marks directly on the chart, which allows you to immediately see the key levels for exiting a trade.
Adaptability:
Three modes allow you to adjust to the current market conditions — from rapid dynamics to a calm trend.
Easy to use:
Minimal settings and intuitive visualization allow you to quickly learn how to use the tool and make informed decisions.

Trendilo ARTrendilo AR is a custom trading indicator designed to identify market trends using advanced techniques such as the Arnaud Legoux Moving Average (ALMA), volume confirmations, and dynamic volatility bands. This indicator provides a clear visualization of trends, including significant changes and custom alerts.
Review of Indicators Used
1. ALMA
Description:
ALMA is a moving average that applies an advanced filter to smooth price data, reducing noise and focusing on actual trends.
Usage in the Indicator:
Used to calculate the smoothed percentage price change and determine trend direction. Customizable parameters include:
- Length: Defines the number of bars to consider.
- Offset: Adjusts sensitivity toward recent prices.
- Sigma: Controls the degree of smoothing.
Advantages:
- Reduced lag in trend detection.
- Resistance to market noise.
2. ATR
Description:
ATR measures the market’s average volatility by considering the range between high and low prices over a given period.
Usage in the Indicator:
ATR is used to calculate "dynamic smoothing", adjusting the indicator’s sensitivity based on current market volatility.
Advantages:
- Adapts to high or low volatility conditions.
- Helps define dynamic support and resistance levels.
3. SMA
Description:
SMA calculates the average of prices or volume over a specific time period.
Usage in the Indicator:
Used to calculate the volume moving average (Volume SMA) to confirm whether the current volume supports the detected trend.
Advantages:
- Easy to understand and calculate.
- Provides volume-based trend confirmation.
4. RMS Bands
Description:
RMS Bands calculate the standard deviation of percentage price changes, creating upper and lower levels that act as overbought and oversold indicators.
Usage in the Indicator:
- Define the range within which the market is considered neutral.
- Crosses above or below the bands indicate trend changes.
Advantages:
- Visual identification of strong trends.
- Helps filter false signals.
Colors and Visuals Used in the Indicator
1. ALMA Line
Colors:
- Green: Indicates a confirmed uptrend (with sufficient volume).
- Red: Indicates a confirmed downtrend (with sufficient volume).
- Gray: Indicates a neutral phase or insufficient volume to confirm a trend.
2. RMS Bands
- Upper and Lower Lines:
- Purple (with transparency): These lines represent the RMS bands (upper and lower) and
adjust opacity based on trend strength.
- Stronger trends result in less transparency (more solid colors).
3. Highlighted Background (Strong Trends)
- Color:
- Light Green (transparent): Highlights a strong trend when the smoothed percentage change (ALMA) exceeds 1.5 times the RMS.
4. Horizontal Lines
- Baseline (0):
- Dark Gray: Serves as a central reference to identify the directionality of percentage changes.
- Additional Line (0.1):
- Blue: A customizable line to mark user-defined key levels.
5. Bar Colors
- Bar Colors:
- Green: When the price is in a confirmed uptrend.
- Red: When the price is in a confirmed downtrend.
- No color: When there is insufficient volume or no clear trend.
How to Use the Indicator
1. Initial Setup
1. Add the Indicator to Your Chart: Copy the code into the Pine Editor on TradingView and apply it to your chart.
2. Customize Parameters: Adjust values based on your trading strategy:
- Smoothing: Controls the level of smoothing for percentage changes.
- Lookback Length: Defines the observation period for calculations.
- Band Multiplier: Adjusts the width of RMS bands.
2. Signal Interpretation
1. Indicator Colors:
- Green: Confirmed uptrend.
- Red: Confirmed downtrend.
- Gray: No clear trend or insufficient volume.
2. RMS Bands:
- If the ALMA line (smoothed percentage change) crosses above the upper RMS band, it signals a potential uptrend.
- If it crosses below the lower RMS band, it signals a potential downtrend.
3. Volume Confirmation:
- The indicator's color activates only if the current volume exceeds the Volume SMA.
3. Alerts and Decisions
1. Trend Change Alerts:
- The indicator automatically triggers alerts when an uptrend or downtrend is detected.
- Configure these alerts to receive real-time notifications.
2. Strong Trend Signals:
- When the magnitude of the percentage change exceeds 1.5 times the RMS, the chart background highlights the strong trend.
4. Trading Strategies
1. Buy:
- Enter long positions when:
- The indicator turns green.
- Volume confirms the trend.
- Consider placing a stop-loss just below the lower RMS band.
2. Sell:
- Enter short positions when:
- The indicator turns red.
- Volume confirms the trend.
- Consider placing a stop-loss just above the upper RMS band.
3. Neutral:
- Avoid trading when the indicator is gray, as no clear trend or insufficient volume is present.
Disclaimer: As this is my first published indicator, please use it with caution. Feedback is highly appreciated to improve its performance.
Happy Trading!

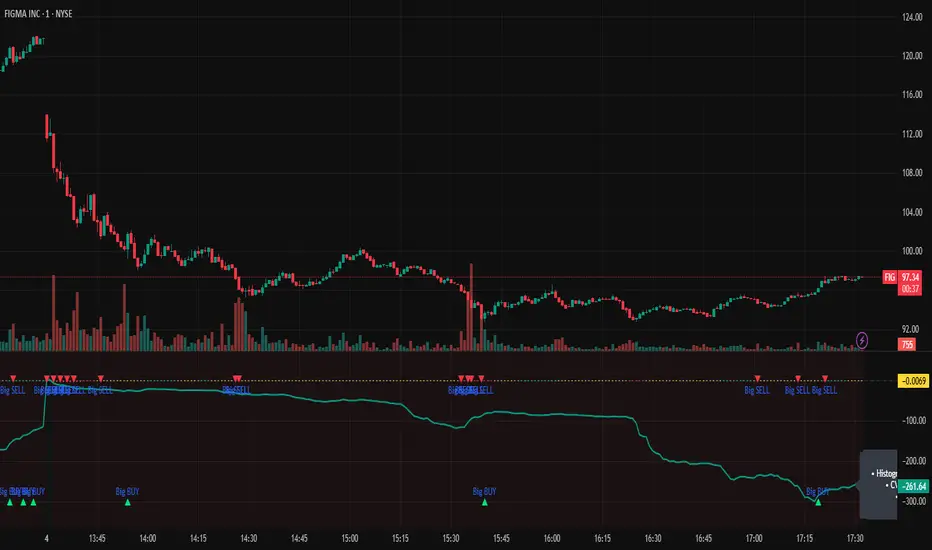
mr.crypto731Description:
📊 Enhanced MACD with Strong Buy/Sell Signals 🚀
This script is designed to enhance the standard MACD indicator by adding clear, strong buy and sell signals. It includes:
MACD Line: A fast-moving average that reacts quickly to price changes.
Signal Line: A slower-moving average that smooths out price fluctuations.
MACD Histogram: The difference between the MACD Line and Signal Line, helping to identify trend strength and direction.
Key Features:
Strong Buy/Sell Signals: Uses crossovers of the MACD Line and Signal Line to generate strong buy/sell signals.
Color-Coded Background: Provides visual cues with background colors to highlight strong signals.
User-Friendly Interface: Customizable settings for MACD Fast Length, Slow Length, and Signal Smoothing.

IPO Lifecycle Sell Strategy [JARUTIR]IPO Lifecycle Sell Strategy with Dynamic Buy Date and Multiple Sell Rules
This custom TradingView script is designed for traders looking to capitalize on dynamic strategies for IPOs and growth stocks, by implementing several sell rules based on price action and technical indicators. It provides a set of sell rules that are applied dynamically depending on the stock's lifecycle and price action, allowing users to lock in profits and minimize drawdowns based on key technical thresholds.
The four sell strategies incorporated into this script are inspired by the book "The Lifecycle Trade", a resource that focuses on capturing profits while managing risk in different phases of a stock's lifecycle, from IPO to high-growth stages.
Key Features:
Buy Price and Buy Date: You can either manually input your buy price and date or let the script automatically detect the buy date based on the specified buy price.
Multiple Sell Strategies: Choose from 4 predefined sell strategies:
Ascender Rule : Captures strong momentum from IPO stocks by selling portions at specific price levels or technical conditions.
Midterm Rule : Focuses on holding for longer periods, with defensive sell signals triggered when the stock deviates significantly from peak price or key moving averages.
40 Week Rule : Designed for long-term holds, this rule triggers a sell when the stock closes below the 40-week moving average.
Everest Rule : Aggressive strategy for selling into strength based on parabolic moves or gap downs, ideal for high momentum stocks.
Interactive Features:
Horizontal Green Line showing the buy price level from the buy date.
Visual Sell Signals appear only after the buy date to ensure that your analysis is relevant to the stock lifecycle.
Customizable settings, allowing you to choose your preferred sell rule strategy and automate buy date detection.
This script is perfect for traders using a strategic, systematic approach to IPOs and high-growth stocks, whether you're looking for quick exits during momentum phases or holding for longer-term growth.
Usage:
Input your Buy Price and Buy Date, or allow the script to automate the buy date detection.
Select a Sell Rule strategy based on your risk profile and trading style.
View visual signals for selling when specific conditions are met.
Frequently Asked Questions (FAQs):
Q1: How do I input my Buy Price and Buy Date?
The script allows you to either manually input the Buy Price and Buy Date or use the automated detection. If you choose automated detection, the script will automatically assign the buy date when the price crosses above your set Buy Price.
Q2: What is the purpose of the "Sell Rules"?
The script offers four sell strategies to help manage different types of stocks in varying phases of their lifecycle:
Ascender Rule: Targets IPO stocks showing positive momentum.
Midterm Rule: A defensive strategy for stocks in a steady uptrend.
40 Week Rule: Long-term hold strategy designed to ride stocks through extended growth.
Everest Rule: Aggressive strategy to capture profits during parabolic price moves.
Q3: What is the significance of the Green Line at Buy Price?
The Green Line represents your entry point (Buy Price) on the chart. It will appear from the buy date onwards, helping you track the performance of your stock relative to your entry.
Q4: Can I customize the Sell Strategy?
Yes! You can choose from the available Sell Rules (Ascender Rule, Midterm Rule, 40 Week Rule, Everest Rule) via an input option in the script. Each strategy has its own unique triggers based on price action, moving averages, and time-based conditions.
Q5: Does this script work for stocks and crypto?
Yes, this script is designed for both stocks and cryptocurrencies. It works on any asset where price data and timeframes are available.
Q6: How do the Weekly Moving Averages (WSMA) work in this strategy?
The script uses weekly moving averages (WSMA) to track longer-term trends. These are essential for some of the sell rules, such as the Midterm Rule and 40 Week Rule, which rely on the stock's movement relative to the 40-week moving average.
Q7: Will the script plot a Sell Signal immediately after the Buy Date?
No, sell signals will only be plotted after the Buy Date. This ensures that the sell strategy is relevant to your actual holding period and avoids premature triggers.
Q8: How do I interpret the Sell Signal?
The script will plot a Red Sell Signal above the bar when the sell conditions are met, based on the selected strategy. This indicates that it may be a good time to exit the position according to your chosen rule.
Q9: Can I use this strategy on different timeframes?
Yes, you can apply the script to any timeframe. However, some sell strategies, like the Midterm Rule and 40 Week Rule, are designed to work best with weekly data, so it's recommended to use these strategies with longer timeframes.
Q10: Does this script have any alerts?
Yes! The script supports alert conditions that will notify you when the sell conditions are met according to your selected rule. You can set up alerts to stay informed without needing to watch the chart constantly.
Q11: What if I want to disable some of the sell rules?
You can select your preferred sell rule using the "Select Sell Rule" dropdown. If you don’t want to use a particular rule, simply choose a different strategy or leave it inactive.
------------------------------
Disclaimer:
This strategy is intended for educational purposes only. It should not be considered financial advice. Always perform your own research and consult with a professional before making any trading decisions. Trading involves significant risk, and you should never trade with money you cannot afford to lose.

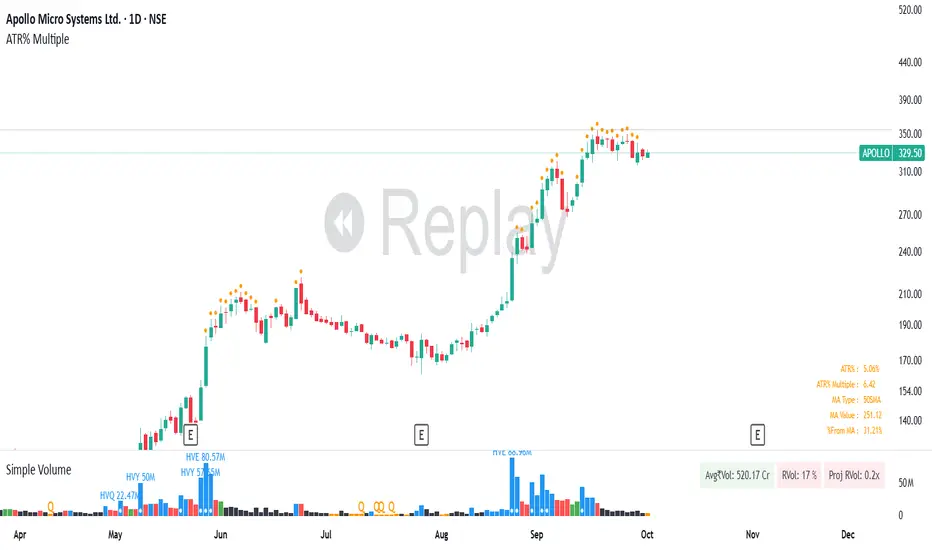
ATR% Multiple from Key Moving AverageThis script gives signal when the ATR% multiple from any chosen moving average is beyond the configurable threshold value. This indicator quantifies how extended the stock is from a given key moving average.
A lot of traders use ATR% multiple from 10DMA, 21EMA, 50SMA or 200SMA to determine how extended a stock is and accordingly sell partials or exit. By default the indicator takes 50SMA and when the ATR% multiple is greater than 7 then it gives the signal to take partials. You can back test this indicator with previous trades and determine the ideal threshold for the signal. For small and midcaps a threshold of 7 to 10 ATR% multiples from 50SMA is where partials can be taken while large caps can revert to mean even earlier at 3 to 5 ATR% multiples from 50SMA.
You can modify this script and use it anyway you please as long as you make it opensource on TradingView.
Multifactor Buy/Sell Strategy V2 | RSI, MACD, ATR, EMA, Boll.BITGET:1INCHUSDT
This Pine Script code for TradingView is a multifactor Buy/Sell indicator that combines several technical factors to generate trading signals based on trend, volatility, and volume conditions. Here’s a breakdown of the main components and functionality:
Indicator Name
- Multifactor Buy/Sell Strategy V2 — an overlay indicator applied directly on the price chart.
### Input Parameters
The script includes multiple customizable parameters:
- RSI, EMA, MACD parameters — for setting periods and signals of MACD and RSI.
- ATR and Bollinger Bands — used for volatility analysis and level determination.
- Minimum Volatility Threshold — sets a minimum Bollinger Band width threshold for determining high volatility.
Core Indicators
1. RSI — calculated to identify oversold (below 30) and overbought (above 70) conditions.
2. EMA and MACD — calculates exponential moving averages and MACD histogram to determine trend direction.
3. ATR and Bollinger Bands — used to assess current volatility and establish dynamic upper and lower bands.
Volatility and Volume Analysis
- Determines the current ATR level and Bollinger Band width to evaluate high volatility.
- Calculates the volume moving average to track periods of increased volume during high volatility.
Trend Analysis
The script uses the difference between fast and slow EMAs to define strong trends:
- Uptrend — when the fast EMA is above the slow EMA, the price is above the fast EMA, and the trend is strong.
- Downtrend — when the fast EMA is below the slow EMA, the price is below the fast EMA, and the trend is strong.
Momentum Filter
- Based on the price change over the last three bars and compared against the minimum volatility threshold to identify strong momentum.
Buy and Sell Signal Generation
- Buy Signal: Uptrend with RSI oversold, positive MACD histogram, high volatility and volume, strong momentum, and sufficient Bollinger Band width.
- Sell Signal: Downtrend with RSI overbought, negative MACD histogram, high volatility and volume, strong momentum, and sufficient Bollinger Band width.
Visualization
- Buy and sell signals are displayed as green and red triangles on the chart.
- Plots for fast and slow EMAs, upper and lower bands, and Bollinger Bands.
Alerts
The script includes alert conditions for buy and sell signals, allowing notifications to be sent via email or mobile app.
Information Panel
A small table on the chart displays current volatility dataThis Pine Script code for TradingView is a multifactor Buy/Sell indicator that combines several technical factors to generate trading signals based on trend, volatility, and volume conditions. Here’s a breakdown of the main components and functionality:
Indicator Name
- Multifactor Buy/Sell Strategy V2 — an overlay indicator applied directly on the price chart.
Input Parameters
The script includes multiple customizable parameters:
- **RSI, EMA, MACD parameters** — for setting periods and signals of MACD and RSI.
- **ATR and Bollinger Bands** — used for volatility analysis and level determination.
- **Minimum Volatility Threshold** — sets a minimum Bollinger Band width threshold for determining high volatility.
Core Indicators
1. RSI — calculated to identify oversold (below 30) and overbought (above 70) conditions.
2. EMA and MACD — calculates exponential moving averages and MACD histogram to determine trend direction.
3. ATR and Bollinger Bands — used to assess current volatility and establish dynamic upper and lower bands.
Volatility and Volume Analysis
- Determines the current ATR level and Bollinger Band width to evaluate high volatility.
- Calculates the volume moving average to track periods of increased volume during high volatility.
Trend Analysis
The script uses the difference between fast and slow EMAs to define strong trends:
- Uptrend — when the fast EMA is above the slow EMA, the price is above the fast EMA, and the trend is strong.
- Downtrend — when the fast EMA is below the slow EMA, the price is below the fast EMA, and the trend is strong.
Momentum Filter
- Based on the price change over the last three bars and compared against the minimum volatility threshold to identify strong momentum.
Buy and Sell Signal Generation
- Buy Signal: Uptrend with RSI oversold, positive MACD histogram, high volatility and volume, strong momentum, and sufficient Bollinger Band width.
- Sell Signal: Downtrend with RSI overbought, negative MACD histogram, high volatility and volume, strong momentum, and sufficient Bollinger Band width.
Visualization
- Buy and sell signals are displayed as green and red triangles on the chart.
- Plots for fast and slow EMAs, upper and lower bands, and Bollinger Bands.
Alerts
The script includes alert conditions for buy and sell signals, allowing notifications to be sent via email or mobile app.
Information Panel
A small table on the chart displays current volatility
- Volatility Status — indicates high or low volatility.
- Bollinger Band Width — current width as a percentage.
- ATR Ratio — ratio of current ATR to long-term average ATR.
This script is suitable for trading in high-volatility conditions, combining multiple filters and factors to generate precise buy and sell signals.

Trend Trader-RemasteredThe script was originally coded in 2018 with Pine Script version 3, and it was in invite only status. It has been updated and optimised for Pine Script v5 and made completely open source.
Overview
The Trend Trader-Remastered is a refined and highly sophisticated implementation of the Parabolic SAR designed to create strategic buy and sell entry signals, alongside precision take profit and re-entry signals based on marked Bill Williams (BW) fractals. Built with a deep emphasis on clarity and accuracy, this indicator ensures that only relevant and meaningful signals are generated, eliminating any unnecessary entries or exits.
Key Features
1) Parabolic SAR-Based Entry Signals:
This indicator leverages an advanced implementation of the Parabolic SAR to create clear buy and sell position entry signals.
The Parabolic SAR detects potential trend shifts, helping traders make timely entries in trending markets.
These entries are strategically aligned to maximise trend-following opportunities and minimise whipsaw trades, providing an effective approach for trend traders.
2) Take Profit and Re-Entry Signals with BW Fractals:
The indicator goes beyond simple entry and exit signals by integrating BW Fractal-based take profit and re-entry signals.
Relevant Signal Generation: The indicator maintains strict criteria for signal relevance, ensuring that a re-entry signal is only generated if there has been a preceding take profit signal in the respective position. This prevents any misleading or premature re-entry signals.
Progressive Take Profit Signals: The script generates multiple take profit signals sequentially in alignment with prior take profit levels. For instance, in a buy position initiated at a price of 100, the first take profit might occur at 110. Any subsequent take profit signals will then occur at prices greater than 110, ensuring they are "in favour" of the original position's trajectory and previous take profits.
3) Consistent Trend-Following Structure:
This design allows the Trend Trader-Remastered to continue signaling take profit opportunities as the trend advances. The indicator only generates take profit signals in alignment with previous ones, supporting a systematic and profit-maximising strategy.
This structure helps traders maintain positions effectively, securing incremental profits as the trend progresses.
4) Customisability and Usability:
Adjustable Parameters: Users can configure key settings, including sensitivity to the Parabolic SAR and fractal identification. This allows flexibility to fine-tune the indicator according to different market conditions or trading styles.
User-Friendly Alerts: The indicator provides clear visual signals on the chart, along with optional alerts to notify traders of new buy, sell, take profit, or re-entry opportunities in real-time.

RSI & Volume Impact Analyzer Ver.1.00Description:
The RSI VOL Score indicator combines the Relative Strength Index (RSI) and volume data through a mathematical calculation to assist traders in identifying and confirming potential trend reversals and continuations. By leveraging both momentum (RSI) and volume data, this indicator provides a more comprehensive view of market strength compared to using RSI or volume alone.
How It Works:
This indicator calculates a score by comparing the RSI against its moving average, adjusted by the volume data. The resulting score quantifies market momentum and strength. When the score crosses its signal line, it may indicate key moments where the market shifts between bullish and bearish trends, potentially helping traders spot these changes earlier.
Calculation Methods:
The RSI VOL Score allows users to select between several calculation methods to suit their strategy:
SMA (Simple Moving Average): Provides a balanced smoothing approach.
EMA (Exponential Moving Average): Reacts more quickly to recent price changes, offering faster signals.
VWMA (Volume Weighted Moving Average): Emphasizes high-volume periods, focusing on stronger market moves.
WMA (Weighted Moving Average): Applies greater weight to recent data for a more responsive signal.
What the Indicator Plots:
Score Line: Represents a combined metric based on RSI and volume, helping traders gauge the overall strength of the trend.
Signal Line: A smoothed version of the score that helps traders identify potential trend changes. Bullish signals occur when the score crosses above the signal line, while bearish signals occur when the score drops below.
Key Features:
Trend Identification: The score and signal line crossovers can help confirm emerging bullish or bearish trends, allowing traders to act on upward or downward momentum.
Customizable Settings: Traders can adjust the lengths of the RSI and signal line and choose between different moving averages (SMA, EMA, VWMA, WMA) to tailor the indicator to their trading style.
Timeframe-Specific: The indicator works within the selected timeframe, ensuring accurate trend analysis based on the current market context.
Practical Use Cases:
Trending Markets: In trending markets, this indicator helps confirm bullish or bearish signals by validating price moves with volume. Traders can use the crossover of the score and signal line as a guide for entering or exiting trades based on trend strength.
Ranging Markets: In ranging markets, the indicator helps filter out false signals by confirming if price movements are backed by volume, making it a useful tool for traders looking to avoid entering during weak or uncertain market conditions.
Interpreting the Score and Signal Lines:
Bullish Signal: A bullish signal occurs when the score crosses above the signal line, indicating a potential upward trend in momentum and price.
Bearish Signal: A bearish signal is generated when the score crosses below the signal line, suggesting a potential downward trend or weakening market momentum.
By mathematically combining RSI and volume data into a single trend score, the RSI VOL Score indicator provides traders with a powerful tool for identifying trend shifts early and making more confident trading decisions.
Important Note:
The signals generated by this indicator should be interpreted in conjunction with other analysis tools. It is always advisable to confirm signals before making any trading decisions.
Disclaimer:
This indicator is designed to assist traders in their decision-making process and does not provide financial advice. The creators of this tool are not responsible for any financial losses or trading decisions made based on its signals. Trading involves significant risk, and users should seek professional advice or conduct their own research before making any trading decisions.

Buy/Sell IndicatorBuy/Sell Indicator
Overview
The Buy/Sell Indicator is designed to help traders identify potential entry and exit points in the market using a combination of Simple Moving Averages (SMA) and the Relative Strength Index (RSI). This indicator plots buy and sell signals directly on the chart, making it easier to make informed trading decisions.
Inputs
Fast MA Length: The period for the fast-moving average. Default is 9.
Slow MA Length: The period for the slow-moving average. Default is 21.
RSI Length: The period for the RSI calculation. Default is 14.
RSI Overbought Level: The RSI level considered overbought. Default is 70.
RSI Oversold Level: The RSI level considered oversold. Default is 30.
How It Works
Moving Averages:
The indicator calculates two SMAs: a fast-moving average (fastMA) and a slow-moving average (slowMA).
The fast MA reacts more quickly to price changes, while the slow MA reacts more slowly.
RSI:
The RSI is calculated to measure the momentum of price movements.
It helps identify overbought and oversold conditions in the market.
Buy and Sell Conditions:
Buy Signal: A buy signal is generated when the fast MA crosses above the slow MA and the RSI is below the overbought level.
Sell Signal: A sell signal is generated when the fast MA crosses below the slow MA and the RSI is above the oversold level.
Plotting
Buy Signals: Displayed as green labels below the bars where the buy condition is met.
Sell Signals: Displayed as red labels above the bars where the sell condition is met.
Moving Averages: The fast MA is plotted in blue, and the slow MA is plotted in orange.

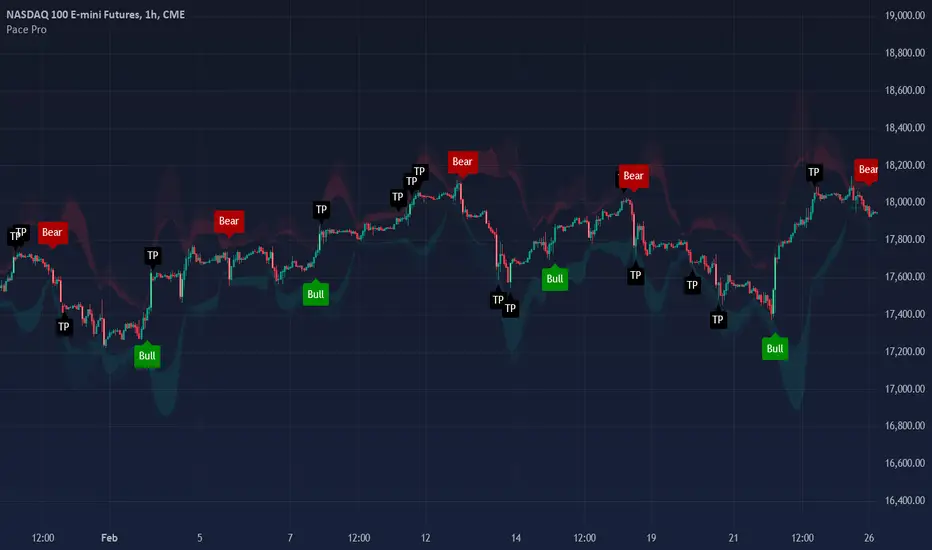
Pace ProOverview
The Pace Pro indicator is a robust trend-following tool designed for versatile application across various timeframes and markets, including stocks, forex, futures and cryptocurrencies. It provides traders with "bull" and "bear" signals, take profit (TP) signals, and volume spike indications. This indicator aims to help traders identify potential trading opportunities through trends, reversals and price exhaustion.
Key Features
Bull and Bear Signals: Pace Pro generates green "bull" and red "bear" signals based on a trend strength score derived from an aggregation of components.
Take Profit (TP) Signals: The indicator plots black "TP" signals at areas of price exhaustion.
Volume Spike Indicators: The indicator colors candles to signify high volume spikes—light green for high bullish volume and light red for high bearish volume.
Price Clouds: The indicator includes three types of Bollinger Band clouds. These clouds help visualize exhaustion and volatility, providing traders with multiple perspectives on market dynamics.
How it works:
Trend Strength: This score is calculated using a proprietary formula that assesses the magnitude and direction of market movement with standard deviation and regression analysis. Standard deviation computes the average price over a specified period and then calculates the standard deviation of prices from this average. A linear regression is performed on the closing prices over a specified period. The slope of the regression line is used to identify the trend direction, and the standard deviation is used to assess trend stability and filter out noise, working together to clearly identify direction and robustness. Bull/Bear signals are produced based on trend strength reaching specific thresholds, configurable in the settings.
Overbought/Oversold Strength: This strength identifies price exhaustion using a unique formula that aggregates values from several indicators such as RVI, RSI and CCI. RVI captures price trends, RSI measures momentum, and CCI identifies price deviations from the mean, providing a comprehensive view of market conditions. Take profit signals are plotted at points of high price exhaustion, indicating optimal exit prices.
Volume Analysis: Volume spikes are identified and highlighted with colored candles using an ATR calculation that pinpoints outliers in volume. This is calculated using the math.abs function, identifying volume spikes in the last 14 bars. Volume spike candle size can be configured in settings to the user's liking.
Bollinger Band Clouds: The indicator employs Bollinger Band clouds based on WMA, VWMA, and EMA to provide a comprehensive view of market volatility and trend strength. WMA responds quickly to price changes, VWMA incorporates volume, and EMA smooths out data, offering a unique and adaptive perspective on market conditions. This combination is used to provide a unique perspective on market volatility, utilizing different moving averages. These clouds adapt to price fluctuations and offer visual cues to enhance trend analysis.
Utility
This tool provides traders with valuable information for trend-following and reversal strategies across different timeframes. It helps traders by:
-Generating "bull" and "bear" signals to indicate potential long, short and exit points. The precise calculation methods and statistical components used in deriving the trend strength score are designed to filter out market noise and provide a clear indication of prevailing market trends.
-Providing "TP" signals at areas of price exhaustion, areas where taking profit is optimal. These also serve as potential reversal points in the market as they incorporate reversion analysis techniques.
-Highlighting high volume spikes with colored candles to indicate significant market activity. These volatile candles can indicate a significant and rapid surge in price.
-Offering visual insights through Bollinger Band clouds, which help traders assess overbought and oversold conditions on a broad scale. These aid in visualizing potential reversals in the market.
Rationale and Benefits of Component Combination
The combination of trend strength, overbought/oversold strength, volume analysis, and Bollinger Band clouds provides a holistic approach to market analysis and allows users to use various techniques of trading analysis to make sound trading decisions. Each component serves a distinct purpose:
-Trend Strength identifies and confirms the direction and magnitude of market trends, offering clear bull and bear signals. A trend score is calculated to clearly identify where price is strongly trending and where it is quite weak. This customizable feature allows traders to configure this indicator to their liking by only plotting signals when the trend reaches a desired threshold.
-Overbought/Oversold Strength pinpoints areas of price exhaustion, providing crucial take profit and reversal conditions in the market. I combine RSI, RVI, and CCI to provide a more robust reversion score. My rationale for this is to leverage data from multiple indicators, to ensure a comprehensive assessment of price exhaustion rather than relying on a single source.
-Volume Analysis highlights significant market activity, giving traders insights into potential price movements. This feature is included to provide users with a visual representation of price pumps/dumps, that can aid in trading decisions in combination with entry and exit signals.
-Bollinger Band Clouds offer a visual representation of market volatility and trend strength, enhancing the overall analytical framework. Bands were calculated using a mixture of WMA, VWMA, and EMA to diversify data and to bring variety to its display. This can enhance its use as it does not use a single data source and relies on multiple.
Uniqueness:
This indicator stands out due to its innovative integration of standard deviation and regression analysis, offering traders a unique and comprehensive market analysis tool. By combining standard deviation to measure volatility and filter out noise with regression analysis to identify trend direction and strength, it provides insightful trend signals that help traders make informed decisions. This indicator's versatility is enhanced by its customizable settings, allowing traders to adapt it to their specific needs and trading styles with the trend sensitivity setting. Combining RSI, RVI, and CCI for reversion and exit points is unique as it integrates multiple perspectives on price momentum and volatility, providing a more comprehensive assessment of price exhaustion than using any single indicator. Combining WMA, EMA, and VWMA as bands is beneficial and unique as it blends different averaging methods to offer a more nuanced and adaptive view of market volatility and trend strength.
By integrating these components, it delivers a multifaceted tool that addresses various aspects of market analysis, making it a valuable asset for traders seeking to improve their decision-making process.
Disclaimer
Trading involves substantial risk and is not suitable for every investor. This indicator is designed to assist in decision-making but does not guarantee profits or prevent losses. Always conduct your own research and consider seeking advice from a financial professional.
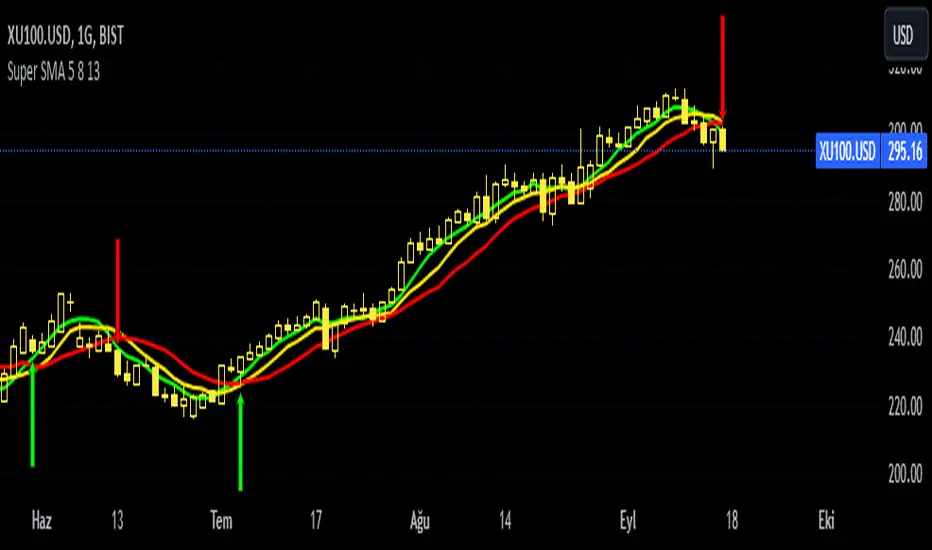
Super SMA 5 8 13This indicator is based on the 5 8 13 simple moving average strategy of strategist Selçuk Gönençler. The indicator shows buy and sell signals when favorable conditions occur.
══ H O W T O U S E ══
Above 5-8-13 - Confirmed hold/buy
5 below (8-13 above) - Be careful, lose weight but don't run away.
Below 5-8 (above 13) - Risk has begun. Don't be stubborn. 13 is your last castle.
5-8-13 below. Don't fight! Wait until it rises above 5-8 again.
Volume-Weighted Trend Filter CloudThe Volume-Weighted Trend Filter Cloud is a powerful technical analysis tool designed to identify trend directions and potential buy/sell signals in a trading instrument. The indicator combines volume-weighted moving averages, average true range (ATR), and cloud plotting techniques to provide a comprehensive view of the market trend.
Inputs:
Length: Specifies the length of Algo used for trend analysis. Default value is 14.
Multiplier: Adjusts the width of the trend filter bands based on the ATR. Default value is 2.0.
Tenkan-sen Period: Defines the period for calculating the Tenkan-sen line. Default value is 200.
Kijun-sen Period: Sets the period for calculating the Kijun-sen line. Default value is 400.
Senkou Span Period: Determines the period for calculating the Senkou Span A and Senkou Span B lines. Default value is 600.
Calculation:
Average True Range (ATR): The indicator calculates the ATR based on the specified moving average length.
Trend Filter Bands: The basic upper and lower bands are calculated using the highest high and lowest low values, respectively, along with the multiplier and ATR. These bands are then adjusted to create the final upper and lower bands, taking into account the previous values.
Trend Direction: The indicator determines the trend direction by comparing the close price with the lower and upper bands. If the close price is above the lower band, it indicates an upward trend (trendUp = 1). If the close price is below the upper band, it indicates a downward trend (trendDown = 1).
Volume-Weighted Z-Score: The indicator calculates the volume-weighted Z-Score by determining the mean and standard deviation of the close price with volume weighting. The Z-Score represents the deviation of the close price from the mean in terms of standard deviations.
Tenkan-sen, Kijun-sen, Senkou Span A, and Senkou Span B: These lines are calculated using the respective periods and the average of the high and low prices.
Sigmoid Transformation: The indicator applies the sigmoid function to the Z-Score values to obtain sigmoid-transformed values for open, high, low, and close prices. These transformed values help in visualizing the trend strength.
Plotting:
Trend Filter: The trend filter is plotted as a line that changes color based on the trend direction. The lower band is displayed for an upward trend, while the upper band is displayed for a downward trend.
Trend Cloud: The cloud plot represents the Senkou Span A and Senkou Span B lines. The cloud color changes based on the trend direction, providing a visual representation of the market trend.
Buy and Sell Signals: The indicator generates buy and sell signals based on the crossover of fast and slow moving averages, Z-Score values, trend direction, and other conditions. These signals are labeled on the chart, indicating potential entry points for traders.
The indicator generates buy and sell signals based on specific conditions, including the intersection of fast and slow moving averages, Z-Score values, trend direction, and more.
Buy signals are described as a "buy signal" on the chart, which indicates potential entry points for buy trades.
Sell signals are described as a "sell signal", which indicates potential entry points for sell trades. The signals in light color represent that they are signals in the opposite direction of the cloud that can be considered as exit points

Futures All List / Sell SignalAs of May 2023, there are more than 180 usdt perpetual coins on the binance futures exchange. These coins are included in the indicator in lists of 40. They are sorted instantly in the table from largest to smallest. The sorting style can be changed in the indicator settings. This indicator collects RSI and TSI values at desired values. The result has a maximum value of 600. A value of 600 signals that the price will decrease or remain stable for a certain period of time. Generally, a short can be expected from the closest point to 600. If 3 separate lists are selected by using 3 of these indicators, 120 coins can be analyzed at the same time. Available in all time zones. Examine it in a 3-minute timeframe. The line inside the indicator draws the instantaneous values of the relevant coin.

Inside candle (Inside Bar) Strategy- by smartanuThe Inside Candle strategy is a popular price action trading strategy that can be used to trade in a variety of markets. Here's how you can trade the Inside Candle strategy using the Pine script code provided:
1. Identify an Inside Candle: Look for a candlestick pattern where the current candle is completely engulfed within the previous candle's high and low. This is known as an Inside Candle.
2. Enter a Long Position: If an Inside Candle is identified, enter a long position at the open of the next candle using the Pine script code provided.
3. Set Stop Loss and Take Profit: Set a stop loss at a reasonable level to limit your potential losses if the trade goes against you. Set a take profit at a reasonable level to take profit when the price reaches the desired level.
4. Manage the Trade: Monitor the trade closely and adjust the stop loss and take profit levels if necessary. You can use the Pine script code to automatically exit the trade when the stop loss or take profit level is hit.
5. Exit the Trade: Exit the trade when the price reaches the take profit level or the stop loss level is hit.
It's important to note that the Inside Candle strategy is just one of many strategies that traders use to trade the markets. It's important to perform your own analysis and use additional indicators before making any trades. Additionally, it's important to practice proper risk management techniques and never risk more than you can afford to lose.

TwV Market SignalsSignals Indicator
Summary
This indicator allows traders to have in handy short and long signals and estimate the trend of the market.
The indicator draws Long and Short signals depending on the trend analysis. The indicators also use meaningful colors for traders to be able to visually understand the graphs, such us fillings on EMAs, so the possible trend is represented.
The colors used are light green for bullish, red for bearish, dark green for possible bearish to bullish change and purple for possible bullish to bearish change. These colors are applicable to all fillings and summary box.
How to use this indicator
The use of EMAs 10,20 and 50 draw the medium to long term trends, therefore avoiding signals against the trend. Furthermore the EMAs will advise possible change in trends, specially considering the 10 and 20 cross, considering that crossing the 10,20 and 50, might confirm the change in med to long term trend change of the price. This is completely visual in the chart as it tints green for positive trend and yellow to red for negative trend.
The 200 SMA is included as it also gives better confirmation to the trend, the basics tell that when the EMAs mentioned above are below the 200 SMA then the likelihood for entries in long positions are not the best and vice versa for short.
Therefore, the trader shall filter Long and Short Signals accordingly as this EMAs are not used to send Long and Short signals considering that they confirm the trend in a slow pace and not reactively to the price volatility.
There are two strategies built-in within the indicator:
Strategy 1 – Longer time trades and high volatility handling
The Long and Short Signals are based on 14 and EMAs (by default). This two Mas are used to send signals based on their crossovers as they are way more reactive to the price movement.
Trader shall consider that EMAs are used for higher timeframes, therefore the indicator has the possibility to adjust the EMAs and use SMAs or WMAs instead for one or the two parameters (14 and 21).
WMAs react faster to the price volatility so the trader shall adjust this according to the timeframe being used. (Lower timeframes suggested).
This strategy is used for trades that might keep running for longer periods of times.
For reference on what the SMAs, EMAs and WMAs are, please see below sections in the description.
Strategy 2 - Shorter time trades and unhandled high volatility
The Long and Short Signals are bases on HMA. HMAs (Hull Moving Averages) track the price movement and volatility way faster that SMAs, EMAs and WMAs, therefore as the HMA follow the price quicker, it is intended for short time trades even in higher timeframes.
Scalping is not suggested using this strategy as HMA do not handle high volatility even on higher timeframes.
One of the biggest differences from the first strategy is that there is no more than a single HMA length to work with, which is 24 as default.
HMAs calculation is different to other MAs, therefore combining various HMAs lengths looking for crossovers become trend identification a lot less precise. HMAs are not intended to be used with different length crossovers.
Exit points = The use of Stochastic and VRVP
Stochastic RSI
It is well known that when Stochastic RSI resets when overbought or oversold therefore traders have within a summary box the possibility to check whether the K & D lines in the Stochastic RSI hace crossed over bullish or bearish.
Although the crossover is not mandatory for a change trend, the crossover might be used by the trader to exit a position considering that the price might move on the opposite direction.
Traders shall look at the summary box, where bullish and bearish crossovers are shown, so they evaluate their position exit.
Visible Range Volume Profile
The use of the VRVP is to find support and resistance on the price movements. Although high and lows are used as possible supports and resistances, VRVP shows an area of confluence on the order book, where volume of positions are accumulated and that might act as support or resistance depending on the price direction.
Traders can visually activate the VRVP to see the Point of Control (POC) directly on the chart as a line (similar as how a support or resistance would be drawn). Moreover, traders have the ability to see within the summary box, whether to see if the price is above or below the POC, so they clearly know if it is acting as support or resistance.
Price Direction
Trade the market trend is well know to be used to identify possible price direction. It is important not to confuse the longer time trend drawn by the EMAs with the TTM Trend bar color. The TTM trend colors bars according to the price direction, helping traders not to confuse when a red bar appears on an up trend or green bars on a down trend.
This coloring helps traders not to exit trades based on bar coloring, which might psychologically affect when scalping or short-term trading specially.
Originally, the TTM trend is used considering the ADX in and indicator called TTM Squeeze, where the strength of the movement is measured, therefore although candle colors help with the price direction, ADX provides the trader the ability to see whether the direction is losing momentum and then catch the best possible exit before the direction change.
How to use Summary
1. Receive the Long or Short Signals using strategy 1 or 2, depending on the selected in the main menu of the indicator.
2. Evaluate the trend based on the 10,20, 50 and 200 MAs. Filter the Long and Short signals accordingly.
3. Monitor constantly the TTM Trend and the ADX for the direction and strength of the position entered and review if the momentum is being lost, considering step 4 or other possible reasons that might lead to exiting the position.
4. Once entered to a position evaluate constantly the Stochastic RSI bearish or bullish crossover or POC value on screen or summary box to exit the position.
Terminology basics
Trend indicators
Exponential Moving Average (EMAs): The base indicator is composed of moving averages of 10, 20 and 55 exponential periods, to determine a possible bullish or bearish trend (EMA Crossing)
Simple Moving Average (SMA): The base indicator is composed of a moving average of 200 simple periods, which in conjunction with the EMAs can lead to estimate potential upward or downwards moves, as well as possible resistances. (SMA Positioning)
Weighted moving average (WMA): It is a technical indicator that traders use to generate trade direction and make a long or short position. It assigns greater weighting to recent data points and less weighting on past data points. (WMA Crossing)
Strength and S/R indicators
VPVR (Volume Profile Visible Range): It allows to determine the Point of Control (POC) which is the node with the highest volume profile. This can be used as an important retest point or to calculate potential support and resistance. The POC level is represented with a red dotted line in the graph.
The VPVR is a simplified version of the “TwV Multi-timeframe Dynamic VRVP” that you can find for free use in my profile. This version calculates the main’s timeframe POC and also has the possibility to be fixed range if the trader enables it from the menu. (Dynamic range by default).
ADX (Average Directional Index): The ADX helps the indicator to estimate the strength of the movement, always considering the DI+ and DI- to not go against the trend strength. This is represented as summary text in a table.
/
Exit indicator
Stochastic RSI: It is an indicator used in technical analysis that ranges between zero and a hundred and is created by applying the Stochastic oscillator formula to a set of relative strength index (RSI) values rather than to standard price data. Using RSI values within the Stochastic formula gives traders an idea of whether the current RSI value is overbought or oversold (Exit zones)
/
Summary Panel
This panel allows the trader to have a summary of the current status (bearish or bullish) of some of the most determinant indicators within the strategy. It has the following characteristics:
It is placed on the right bottom side of the chart by the default. Traders can change its position or hidden it through the main menu of the indicator.
Its colors change according to the indicator’s values and constant change for easier detection.
The summary box shows the projection for each of the indicators (Trend, Stochastic, EMA, VPVR and ADX).
The summary box is multi-language (English and Spanish), which can be changes in the main menu of the indicator
Alerts
Within the indicator’s menu, you can set up alerts for all long, short, close long and close short signals, which might come in handy when the trader would like to have notifications on the Trading View website, desktop app or phone apps. Furthermore, there are also signals for possible exit points, which can also be activated from the indicator’s menu.
