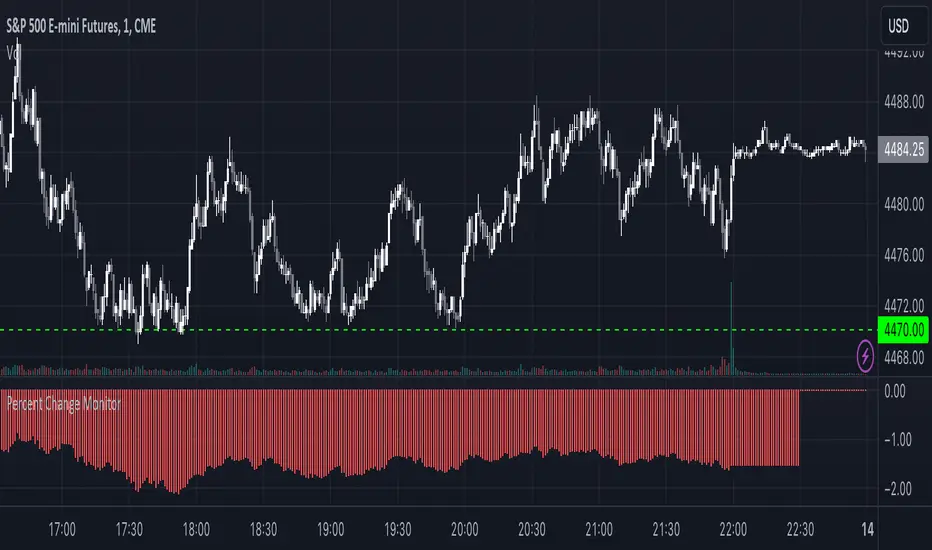
Combined Stock Session Percent Change MonitorIntroducing the "Combined Stock Session Percent Change Monitor" - a unique tool tailored for traders who wish to track the collective performance of up to five stocks in real-time during a trading session.
Key Features:
User Customization: Easily input and monitor any five stock symbols of your choice. By default, the script tracks "AAPL", "MSFT", "AMZN", "TSLA", and "NVDA".
Session-Based Tracking: The script captures and calculates the percentage change from the start of a trading session, set at 15:30. This allows traders to gauge intraday performance.
Visual Clarity: The combined percentage change is plotted as columns, with green indicating a positive change and red indicating a negative change. This provides a clear, visual representation of the stocks' collective performance.
Versatility: Whether you're tracking the performance of stocks in a specific sector, or you're keeping an eye on your personal portfolio's top holdings, this tool offers a concise view of collective stock movement.
Usage:
Simply input the desired stock symbols and let the script do the rest. The plotted columns will provide a quick snapshot of how these stocks are performing collectively since the session's start.
Conclusion:
Stay ahead of the market by monitoring the combined performance of your chosen stocks. Whether you're an intraday trader or a long-term investor, this tool offers valuable insights into collective stock behavior. Happy trading!
(Note: Always conduct your own research and due diligence before making any trading decisions. This tool is meant to aid in analysis and not to serve as financial advice.)
Sentiment
Realized Profit & Loss [BigBeluga]The Realized Loss & Profit indicator aims to find potential dips and tops in price by utilizing the security function syminfo.basecurrency + "_LOSSESADDRESSES".
The primary objective of this indicator is to present an average, favorable buying/selling opportunity based on the number of people currently in profit or loss.
The script takes into consideration the syminfo.basecurrency, so it should automatically adapt to the current coin.
🔶 USAGE
Users have the option to enable the display of either Loss or Profit, depending on their preferred visualization.
Examples of displaying Losses:
Example of displaying Profits:
🔶 CONCEPTS
The concept aims to assign a score to the data in the ticker representing the realized losses. This score will provide users with an average of buying/selling points that are better to the typical investor.
🔶 SETTINGS
Users have complete control over the script settings.
🔹 Calculation
• Profit: Display people in profit on an average of the selected length.
• Loss: Display people in loss on an average of the selected length.
🔹 Candle coloring
• True: Color the candle when data is above the threshold.
• False: Do not color the candle.
🔹 Levels
- Set the level of a specific threshold.
• Low: Low losses (green).
• Normal: Low normal (yellow).
• Medium: Low medium (orange).
• High: Low high (red).
🔹 Z-score Length: Length of the z-score moving window.
🔹 Threshold: Filter out non-significant values.
🔹 Histogram width: Width of the histogram.
🔹 Colors: Modify the colors of the displayed data.
🔶 LIMITATIONS
• Since the ticker from which we obtain data works only on the daily timeframe, we are
restricted to displaying data solely from the 1D timeframe.
• If the coin does not have any realized loss data, we can't use this script.

ATR + Momentum Shifts w/Take ProfitThis script is a technical analysis indicator designed to assist in identifying potential entry points and setting take profit levels in trading. It combines the Average True Range (ATR) indicator, momentum shifts, and customizable take profit levels to provide insights into potential market movements.
Differences from Currently Published Ones:
This script is unique due to its use of a combination of elements:
ATR and Momentum: The script combines the ATR indicator to provide dynamic support and resistance levels with the momentum indicator to identify shifts in the underlying momentum.
Customizable Take Profit Levels: It offers the ability to set take profit levels based on customizable multipliers of the ATR, helping traders manage potential profits.
How to Use:
ATR Bands: The script plots upper and lower ATR bands as potential dynamic support and resistance levels.
Shift Arrows: Arrows are plotted below bars for potential long entry opportunities (green triangle) and above bars for potential short entry opportunities (yellow triangle).
Take Profit Levels: The script also plots take profit levels both above and below the source price based on the ATR multipliers set in the inputs.
Markets and Conditions:
This script can be used across various financial markets, including stocks, forex, commodities, and cryptocurrencies. It's most effective in trending markets where momentum shifts can signal potential reversals or continuation of trends. Traders should consider the following conditions:
Trend Confirmation: Look for momentum shifts in the direction of the prevailing trend for higher probability setups.
Volatility: Higher volatility can amplify ATR movements and subsequently affect the placement of ATR bands and take profit levels.
Risk Management: Always implement proper risk management strategies to protect your capital.
Additional Considerations:
Customization: Traders can adjust input parameters like ATR length, momentum length, and take profit multipliers to match their trading style and market conditions.
Combining with Other Indicators: Consider using this indicator in conjunction with other technical indicators or chart patterns for confirmation.

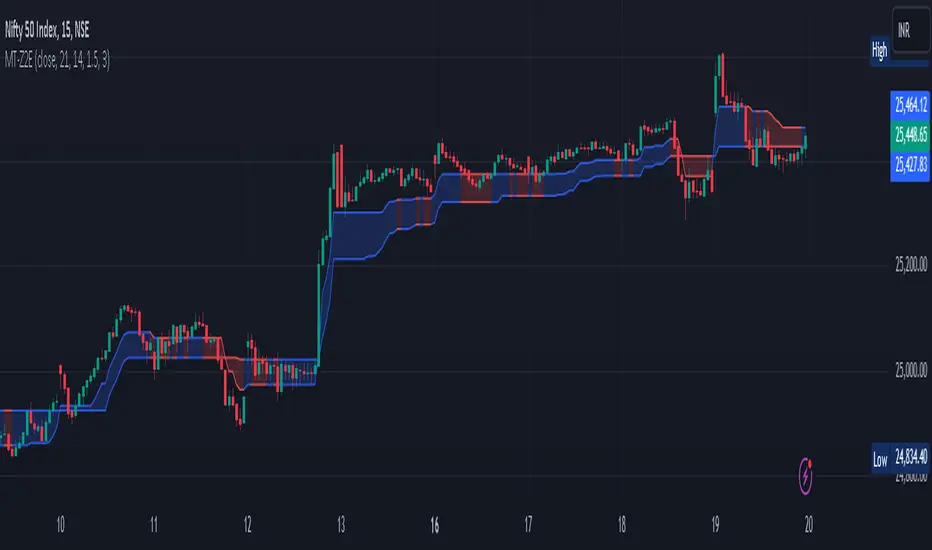
Magic Trend By Market Mindset - Zero To EndlessMagic Trend indicator is an indicator combining the Commodity Channel Index (CCI) and the Average True Range (ATR) indicators.
The indicator is represented by a line that turns red when CCI readings are below 0 and converts to blue when CCI reaches above 0.
Color of the line can be treated as a trend indicator.
When CCI > 0 (Blue Color), price is assumed to be in uptrend and a buying momentum could be seen.
When CCI < 0 (Red Color), price is assumed to be in downtrend and a selling pressure could be seen.
Two Multipliers of ATR have been used. Default values for multiploier are : 1.5 and 3.0
It tells about the volatality in the price and also helps in deciding Entry poits, Stop loss points and sometimes Exit points.
If trend magic lines are not straight and moving upward/downward, continuition of the trend is expected and so Holding the position is adviced.
If the farther line (line with multiplier 3.0) is broken, a trend reversal can be seen soon.
In this case, squaring off and making reverse position is adviced near the other (1.5 mult) line.
If price is revolving in between these two lines... a sideways movement is expected.
Happy Trading
Market Mindset

SPDR TrackerMonitor all SPDR Index Funds in one location! The purpose of this indicator is to review which sectors are trend up vs down to better manage risk against SPY, other funds and/or individual stocks.
With this indicator it may become more apparent which sectors to begin investment in that are at lows compared to others, or use it to determine which stocks may be undervalued or overvalued against SPY.
There is a small table at the bottom where each fund symbol is presented along with it's mode value, last period change as well as last period volume - there's a tooltip that shows the description for each symbol for a quick reminder.
Review the configuration pane where:
Individual funds can have their visibility toggled
Change funds colors
Adjust display mode for each fund (SMA, EMA, VWMA, BBW, Change, ATR, VWAP - many more!)
Some presentation modes may look better on some timeframes vs others, adjust lengths and use anchor point for VWAP.
Future updates may bring about new features, I have some code organization and refactoring to do but wanted to share the idea anyways.
Feel free to drop any suggestions for feature enhancement and I hope it brings success to many, enjoy.

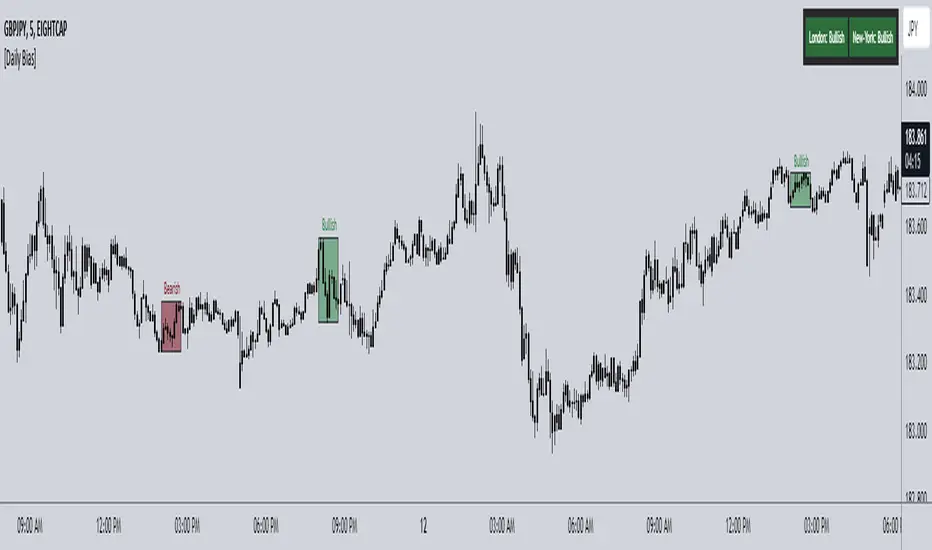
ICT Daily Bias Finder [DTCC]What is This?
The ICT Daily Bias Finder uses a method called "DTCC" to identify the London and New York session's bias, bullish or bearish. This indicator should only be relied on for 5 minute, and not other timeframes.
How do I use it?
Look at the previous days two boxes (labeled DTCC Bear/DTCC Bull), if both are bullish or both are bearish it is NOT recommended to rely on DTCC for that day. If the first one is bullish and second one is bearish, the DTCC for the next day says that London session will turn ABOVE midnight opening price, while New York will turn UNDER midnight opening price (longs in London, shorts in New York). If the second one is bearish and the first is bullish, the DTCC for the next day says that London session will turn UNDER midnight opening price, while New York will turn ABOVE midnight opening price (shorts in London, longs in New York)
Emoji guide to DTCC indicator:
🟢🟢: Don't trust DTCC for that day
🔴🔴: Don't trust DTCC for that day
🟢🔴: Longs in London above Midnight Opening Price, Shorts in New York under Midnight Opening Price
🔴🟢: Shorts in London under Midnight Opening Price, Longs in New York under Midnight Opening Price
Reminder: NEVER rely solely on DTCC, DTCC can be wrong and is not right 100% of times.
Liquidation Ranges + Volume/OI Dots [Kioseff Trading]Hello!
Introducing a multi-faceted indicator "Liquidation Ranges + Volume Dots" - this indicator replicates the volume dot tools found on various charting platforms and populates a liquidation range on crypto assets!
Features
Volume/OI dots populated according to user settings
Size of volume/OI dots corresponds to degree of abnormality
Naked level volume dots
Fixed range capabilities for volume/OI dots
Visible time range capabilities for volume/OI dots
Lower timeframe data used to discover iceberg orders (estimated using 1-minute data)
S/R lines drawn at high volume/OI areas
Liquidation ranges for crypto assets (10x - 100x)
Liquidation ranges are calculated using a popular crypto exchange's method
# of violations of liquidation ranges are recorded and presented in table
Pertinent high volume/OI price areas are recorded and presented in table
Personalized coloring for volume/OI dots
Net shorts / net long for the price range recorded
Lines shows reflecting net short & net long increases/decreases
Configurable volume/OI heatmap (displayed between liquidation ranges)
And some more (:
Liquidation Range
The liquidation range component of the indicator uses a popular crypto exchange's calculation (for liquidation ranges) to populate the chart for where 10x - 100x leverage orders are stopped out.
The image above depicts features corresponding to net shorts and net longs.
The image above shows features corresponding to liquidation zones for the underlying coin.
The image above shows the option to display volume/oi delta at the time the corresponding grid was traded at.
The image above shows an instance of using the "fixed range" feature for the script.
*The average price of the range is calculated to project liquidation zones.
*Heatmap is calculated using OI (or volume) delta.
Huge thank you to Pine Wizard @DonovanWall for his range filter code!
Price ranges are automatically detected using his calculation (:
Volume / OI Dots
Similar to other charting platforms, the volume/OI dots component of the indicator distinguishes "abnormal" changes in volume/OI; the detected price area is subsequently identified on the chart.
The detection method uses percent rank and calculates on the last bar of the chart. The "agelessness" of detection is contingent on user settings.
The image above shows volume dots in action; the size of each volume dot corresponds to the amount of volume at the price area.
Smaller dots = lower volume
Larger dots = higher volume
The image above exemplifies the highest aggression setting for volume/OI dot detection.
The table oriented top-right shows the highest volume areas (discovered on the 1-minute chart) for the calculated period.
The open interest change and corresponding price level are also shown. Results are listed in descending order but can also be listed in order of occurrence (most relevant).
Additionally, you can use the visible time range feature to detect volume dots.
The feature shows and explains how the visible range feature works. You select how many levels you want to detect and the script will detect the selected number of levels.
For instance, if I select to show 20 levels, the script will find the 20 highest volume/OI change price areas and distinguish them.
The image above shows a narrower price range.
The image above shows the same price range; however, the script is detecting the highest OI change price areas instead of volume.
* You can also set a fixed range with this feature
* Naked levels can be used
Additionally, you can select for the script to show only the highest volume/ OI change price area for each bar. When active, the script will successively identify the highest volume / OI change price area for the most recent bars.
Naked Levels
The image above shows and explains how naked levels can be detected when using the script.
And that's pretty much it!
Of course, there're a few more features you can check out when you use the script that haven't been explained here (:
Thank you again to @DonovanWall
Thank you to @Trendoscope for his binary insertion sort library (:
Thank you to @PineCoders for their time library
Thank you for checking this out!

Historic Volume/Market ProfilesHistoric Volume/Market Profile is a Periodic Volume Profile with all of the improvements known in the original Volume/Market Profile.
VMP is a 2 in 1 Volume and Market Profile Indicator.
HVMP uses the base of VMP to offer a quick and simple view at multiple historic profiles at the same time.
This includes:
Cluster Identification for High Volume and Low Volume Areas.
Maximizing granularity by utilizing boxes and lines to get up to 1000 rows.
New Inclusions in HVMP vs VMP:
HVMP granularity is determined by the # of profiles on display. By doing this, each profile will get an even amount of allocated rows to use and granularity is scaled per-profile, to fit within the row allowance.
For Example: 1000/(# of profiles) = Maximum # of rows per profile.
HVMP introduces the "Auto-Scale" Option (on by Default), this automatically fits each profile within the defined timeframe period to provide a consistent display when switching timeframes.
Even with "Auto-Scale" enabled, "Display Size" dictates which direction the profile is displayed.
Below is a Negative Display Size (Displays from right to left, starting at the end of the period)
Below is a Positive Display Size (Displays from left to right, starting at the beginning of the period)
HVMP is only for historical data, you can get a live profile with the same Node Identification using VMP (Volume Market/Profile). The indicator that this one is based on.
Find it Here: Volume/Market Profile
Enjoy!

Indian Market Sessions for BacktestingThis indicator is designed to increase the quality of your backtesting in the Indian Market.
NSE & BSE run from 9:15 am IST to 3:30 pm IST.
Naturally different times have different kinds of volatility.
On your chart you will find premarked -
Saffron - 9:15 am to 10:30 am - Opening Session - High Volatility Observed Historically
White - 10:35 am to 2:25 pm - Middle Session - Lower Volatility Observed Historically
Green - 2:30 pm to 3:30 pm - Closing Session - Medium to High Volatility Observed Historically
You will also find the start of each session marked with an arrow.
Feel free to change the times from the input settings and the color and visibility from the style settings.
_______________
Usage:
When you backtest any strategies, say moving average crossovers, also mark the sessions in your sheet which will help you further increase accuracy.
Feel free to drop your doubts in the comments.

Yesterday's High v.17.07Yesterday’s High Breakout it is a trading system based on the analysis of yesterday's highs, it works in trend-following mode therefore it opens a long position at the breakout of yesterday's highs even if they occur several times in one day.
There are several methods for exiting a trade, each with its own unique strategy. The first method involves setting Take-Profit and Stop-Loss percentages, while the second utilizes a trailing-stop with a specified offset value. The third method calls for a conditional exit when the candle closes below a reference EMA.
Additionally, operational filters can be applied based on the volatility of the currency pair, such as calculating the percentage change from the opening or incorporating a gap to the previous day's high levels. These filters help to anticipate or delay entry into the market, mitigating the risk of false breakouts.
In the specific case of INJ, a 12% Take-Profit and a 1.5% Stop-Loss were set, with an activated trailing-stop percentage, TRL 1 and OFF 0.5.
To postpone entry and avoid false breakouts, a 1% gap was added to the price of yesterday's highs.
Name: Yesterday's High Breakout - Trend Follower Strategy
Author: @tumiza999
Category: Trend Follower, Breakout of Yesterday's High.
Operating mode: Spot or Futures (only long).
Trade duration: Intraday.
Timeframe: 30M, 1H, 2H, 4H
Market: Crypto
Suggested usage: Short-term trading, when the market is in trend and it is showing high volatility.
Entry: When there is a breakout of Yesterday's High.
Exit: Profit target or Trailing stop, Stop loss or Crossunder EMA.
Configuration:
- Gap to anticipate or postpone the entry before or after the identified level
- Rate of Change for Entry Condition
- Take Profit, Stop Loss and Trailing Stop
- EMA length
Backtesting:
⁃ Exchange: BINANCE
⁃ Pair: INJUSDT
⁃ Timeframe: 4H
- Treshold: 1
- Gap%: 1
- SL: 1.5
- TP:12
- TRL: 1
- OFF-TRL: 0.5
⁃ Fee: 0.075%
⁃ Slippage: 1
- Initial Capital: 10000 USDT
- Position sizing: 10% of Equity
- Start : 2018-07-26 (Out Of Sample from 2022-12-23)
- Bar magnifier: on
Credits: LucF for Pine Coders (f_security function to avoid repainting using security)
Disclaimer: Risk Management is crucial, so adjust stop loss to your comfort level. A tight stop loss can help minimise potential losses. Use at your own risk.
How you or we can improve? Source code is open so share your ideas!
Leave a comment and smash the boost button!
Thanks for your attention, happy to support the TradingView community.

Thange Momentum KicksTitle: Thange Momentum Kicks Indicator - Identify Strong Bullish and Bearish Candles
Description:
The Thange Momentum Kicks indicator is a small tool designed to identify strong bullish and bearish candles in a candlestick price chart. By analyzing the momentum and size of each candle, this indicator highlights potential significant price movements.
The indicator marks strong bullish candles with a "Bull Kick" label to signal their strength on price action. Similarly, strong bearish candles are identified with the "Bear Kick" label. These kicks are characterized by their size and momentum, indicating a high probability of significant price movement.
The indicator allows traders and investors to easily spot these kicks on their charts, helping them make quick decisions. It calculates the percentage momentum of each candle and compares it to the specified thresholds for bullish and bearish kicks.
Key Features:
- Identifies strong bullish and bearish candles ("Kicks") based on momentum and size.
- Customizable input parameters for setting the percentage thresholds for kicks.
- Labels and tooltips provide essential information such as momentum, percentage change, open, and close prices.
- Differentiates between bullish kicks with blue color and bearish kicks with a unique pink color.
- Plots the candles with the specified colors for easy visualization.
Instructions:
1. Look for the "Kicks" labeled candles on your chart.
2. Bullish kicks indicate strong upward momentum, while bearish kicks represent strong downward momentum.
3. Consider the size and momentum of the kicks when making trading decisions.
4. Combine the Thange Momentum Kicks indicator with other technical analysis tools for a comprehensive market analysis.
Note: The Thange Momentum Kicks indicator is most effective when used in conjunction with other indicators, chart patterns, and risk management strategies to confirm signals and optimize trade entries and exits.
Disclaimer: This indicator should be used as a tool for technical analysis and does not guarantee specific trading outcomes. Users should exercise their own discretion and risk management when making trading decisions based on this indicator.
I hope my Thange Momentum Kicks indicator enhances your trading experience and helps you identify strong bullish and bearish candles with ease. Happy trading!

Highest High and lowest low - Sachin Wakpaijan
The "Highest High and Lowest Low" indicator, created by Sachin Wakpaijan, is a powerful tool designed to identify the highest high and lowest low in a trading instrument's price history. This indicator can be used on TradingView to gain insights into significant price levels and potential trend reversals.
Inputs:
Display Emoji: This input parameter enables or disables the display of emoji symbols on the chart.
Functionality:
The indicator calculates the highest high and lowest low based on the price history. It performs the following steps:
Highest High Calculation: The indicator calculates the highest high by comparing the current high with the previously recorded highest high. If a new high is found, the highest high is updated. The lowest low is set to the highest high.
Lowest Low Calculation: The indicator calculates the lowest low based on the current low. If a new low is found, the lowest low is updated, and the highest after the low is set to the lowest low.
Checking for Highest After Low: If the current high exceeds the highest after the low, the highest after the low is updated.
Plotting: The indicator plots the highest high, highest after low, and lowest high on the chart. Additionally, it displays emoji symbols on the chart based on specific conditions, such as the highest high and the relationship between the high and the open/close prices.
Usage:
The "Highest High and Lowest Low" indicator can be applied to any trading instrument and time frame. It helps traders identify significant price levels, potential trend reversal points, and gauge the strength of price movements. The indicator's customizable input parameter allows users to adjust the visual appearance according to their preferences.
Note:
This indicator is provided for informational purposes only and should not be considered as financial advice. Traders should conduct thorough analysis and use additional indicators or techniques to validate their trading decisions.
Author:
This indicator was created by Sachin Wakpaijan. You can find more of their work on TradingView.
Disclaimer:
Trading involves risks, and it is essential to understand and acknowledge the risks associated with trading before making any investment decisions. The author do not assume any responsibility for any trading losses incurred as a result of using this indicator.

Price & Volume Profile (Expo)█ Overview
The Price & Volume Profile provides a holistic perspective on market dynamics by simultaneously tracking price action and trading volume across a range of price levels. So it is not only a volume-based indicator but also a price-based one. In addition to illustrating volume distribution, it quantifies how frequently the price has fallen within a particular range, thus offering a holistic perspective on market dynamics.
This unique and comprehensive approach to market analysis by considering both price action and trading volume, two crucial dimensions of market activity. Its distinctive methodology offers several advantages:
Holistic Market View: By simultaneously tracking the frequency of specific price ranges (Price Profile) and the volume traded at those ranges (Volume Profile), this indicator provides a more complete picture of market behavior. It shows not only where the market is trading but also how much it's trading, reflecting both price acceptance levels and market participation intensity.
Point of Control (POC): The POC, as highlighted by this indicator, serves as a significant reference point for traders. It identifies the price level with the highest trading activity, thus indicating a strong consensus among market participants about the asset's fair value. Observing how price interacts with the POC can offer valuable insights into market sentiment and potential trend reversals.
Support and Resistance Levels: Price levels with high trading activity often act as support or resistance in future price movements. The indicator visually represents these levels, enabling traders to anticipate potential price reactions.
Price Profile
Price and Volume Profile
█ Calculations
The algorithm analyzes both trade frequency and volume across different price levels. It identifies these levels within the visible chart range, then examines each bar to determine if the selected price falls within these levels. If so, it increases a counter and adds the trading volume. This process repeats across the visible range and is visualized as a horizontal histogram, each bar representing a price level and the bar length reflecting trade frequency and volume. Additionally, it calculates the Point of Control (POC), signifying the price level with the highest activity.
In summary: The histogram presents a dual perspective - not only the traded volume at each price level but also the frequency of the price hitting each range. The longer the bar, the more times the price has frequented that specific range, revealing key insights into price behavior and acceptance levels. These frequently visited areas often emerge as strong support or resistance zones, helping traders navigate market movements.
Please note that the indicator adjusts to the visible price range, making it adaptable to changing market conditions. This dynamic analysis can provide more relevant and timely information than static indicators.
█ How to use
This indicator is beneficial for traders as it offers insights into the distribution of trading activity across different price levels. It helps identify key areas of support and resistance and gives a visual representation of market sentiment and liquidity.
The point of control (POC) , which is the price level with the highest traded volume or frequency count, becomes even more crucial in this context. It marks the price at which the most trading activity occurred, signaling a strong consensus among market participants about the asset's fair value. If the market price deviates significantly from the POC, it could suggest an overbought or oversold condition, potentially leading to a price reversion.
Fair Price Areas/gaps are specific price levels or zones where an asset has spent limited time in the past. These areas are considered interesting or significant because they may have an impact on future price action.
Similar to the concept of fair value gaps, which refers to discrepancies between an asset's market price and its estimated intrinsic value, Fair Price Areas/gaps focus on price levels that have been relatively underutilized in terms of trading activity. When an asset's price reaches a Fair Price Area/gap, traders and investors pay attention because they expect the price to react in some way. The rationale behind this concept is that price tends to gravitate towards areas where it has spent less time in the past, as the market perceives them as significant levels.
█ Settings
The indicator is customizable, allowing users to define the number of price levels (rows), the offset, the data source, and whether to display volume or frequency count. It also adjusts dynamically to the visible price range on the chart, ensuring that the analysis remains relevant and timely with changing market conditions.
Source: The price to use for the calculation. Typically, this is the closing price. By considering the user-selected Source (typically the closing price), the indicator determines the frequency with which the price lands within each designated price level (row) over the selected period. In essence, the indicator provides a count of bars where the Source price falls within each range, essentially creating a "Price Profile."
Row Size: The number of price levels (rows) to divide the visible price range into.
Display: Choose whether to display the number of bars ("Counter") or the total volume ("Volume") for each price level.
Offset: The distance of the histogram from the price chart.
Point of Control (POC): If enabled, the indicator will highlight the price level with the most activity.
-----------------
Disclaimer
The information contained in my Scripts/Indicators/Ideas/Algos/Systems does not constitute financial advice or a solicitation to buy or sell any securities of any type. I will not accept liability for any loss or damage, including without limitation any loss of profit, which may arise directly or indirectly from the use of or reliance on such information.
All investments involve risk, and the past performance of a security, industry, sector, market, financial product, trading strategy, backtest, or individual's trading does not guarantee future results or returns. Investors are fully responsible for any investment decisions they make. Such decisions should be based solely on an evaluation of their financial circumstances, investment objectives, risk tolerance, and liquidity needs.
My Scripts/Indicators/Ideas/Algos/Systems are only for educational purposes!

Developing Market Profile / TPO [Honestcowboy]The Developing Market Profile Indicator aims to broaden the horizon of Market Profile / TPO research and trading. While standard Market Profiles aim is to show where PRICE is in relation to TIME on a previous session (usually a day). Developing Market Profile will change bar by bar and display PRICE in relation to TIME for a user specified number of past bars.
What is a market profile?
"Market Profile is an intra-day charting technique (price vertical, time/activity horizontal) devised by J. Peter Steidlmayer. Steidlmayer was seeking a way to determine and to evaluate market value as it developed in the day time frame. The concept was to display price on a vertical axis against time on the horizontal, and the ensuing graphic generally is a bell shape--fatter at the middle prices, with activity trailing off and volume diminished at the extreme higher and lower prices."
For education on market profiles I recommend you search the net and study some profitable traders who use it.
Key Differences
Does not have a value area but distinguishes each column in relation to the biggest column in percentage terms.
Updates bar by bar
Does not take sessions into account
Shows historical values for each bar
While there is an entire education system build around Market Profiles they usually focus on a daily profile and in some cases how the value area develops during the day (there are indicators showing the developing value area).
The idea of trading based on a developing value area is what inspired me to build the Developing Market Profile.
🟦 CALCULATION
Think of this Developing Market Profile the same way as you would think of a moving average. On each bar it will lookback 200 bars (or as user specified) and calculate a Market Profile from those bars (range).
🔹Market Profile gets calculated using these steps:
Get the highest high and lowest low of the price range.
Separate that range into user specified amount of price zones (all spaced evenly)
Loop through the ranges bars and on each bar check in which price zones price was, then add +1 to the zones price was in (we do this using the OccurenceArray)
After it looped through all bars in the range it will draw columns for each price zone (using boxes) and make them as wide as the OccurenceArray dictates in number of bars
🔹Coloring each column:
The script will find the biggest column in the Profile and use that as a reference for all other columns. It will then decide for each column individually how big it is in % compared to the biggest column. It will use that percentage to decide which color to give it, top 20% will be red, top 40% purple, top 60% blue, top 80% green and all the rest yellow. The user is able to adjust these numbers for further customisation.
The historical display of the profiles uses plotchar() and will not only use the color of the column at that time but the % rating will also decide transparancy for further detail when analysing how the profiles developed over time. Each of those historical profiles is calculated using its own 200 past bars. This makes the script very heavy and that is why it includes optimisation settings, more info below.
🟦 USAGE
My general idea of the markets is that they are ever changing and that in studying that changing behaviour a good trader is able to distinguish new behaviour from old behaviour and adapt his approach before losing traders "weak hands" do.
A Market Profile can visually show a trader what kind of market environment we currently are in. In training this visual feedback helps traders remember past market environments and how the market behaved during these times.
Use the history shown using plotchars in colors to get an idea of how the Market Profile looked at each bar of the chart.
This history will help in studying how price moves at different stages of the Market Profile development.
I'm in no way an expert in trading Market Profiles so take this information with a grain of salt. Below an idea of how I would trade using this indicator:
🟦 SETTINGS
🔹MARKET PROFILING
Lookback: The amount of bars the Market Profile will look in the past to calculate where price has been the most in that range
Resolution: This is the amount of columns the Market Profile will have. These columns are calculated using the highest and lowest point price has been for the lookback period
Resolution is limited to a maximum of 32 because of pinescript plotting limits (64). Each plotchar() because of using variable colors takes up 2 of these slots
🔹VISUAL SETTINGS
Profile Distance From Chart: The amount of bars the market profile will be offset from the current bar
Border width (MP): The line thickness of the Market Profile column borders
Character: This is the character the history will use to show past profiles, default is a square.
Color theme: You can pick 5 colors from biggest column of the Profile to smallest column of the profile.
Numbers: these are for % to decide column color. So on default top 20% will be red, top 40% purple... Always use these in descending order
Show Market Profile: This setting will enable/disable the current Market Profile (columns on right side of current bar)
Show Profile History: This setting will enable/disable the Profile History which are the colored characters you see on each bar
🔹OPTIMISATION AND DEBUGGING
Calculate from here: The Market Profile will only start to calculate bar by bar from this point. Setting is needed to optimise loading time and quite frankly without it the script would probably exceed tradingview loading time limits.
Min Size: This setting is there to avoid visual bugs in the script. Scaling the chart there can be issues where the Market Profile extends all the way to 0. To avoid this use a minimum size bigger than the bugged bottom box

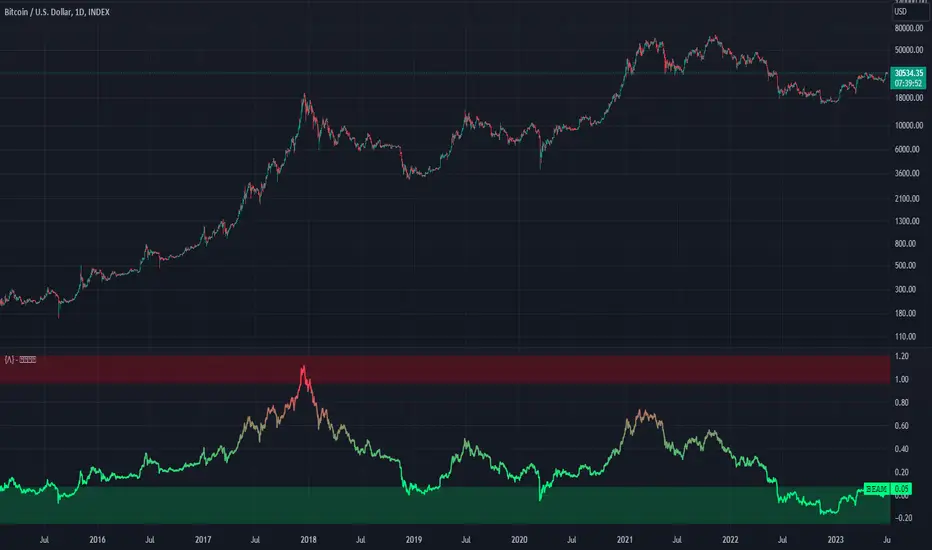
Bitcoin Economics Adaptive MultipleBEAM (Bitcoin Economics Adaptive Multiple) is an indicator that assesses the valuation of Bitcoin by dividing the current price of Bitcoin by a moving average of past prices. Its purpose is to provide insights into whether Bitcoin is under or overvalued at any given time. The thresholds for the buy and sell zones in BEAM are adjustable, allowing users to customize the indicator based on their preferences and trading strategies.
BEAM categorizes Bitcoin's valuation into two distinct zones: the green buy zone and the red sell zone.
Green Buy Zone:
The green buy zone in BEAM indicates that Bitcoin is potentially undervalued. Traders and investors may interpret this zone as a favorable buying opportunity. The threshold for the buy zone can be adjusted to suit individual preferences or trading strategies.
Red Sell Zone:
The red sell zone in BEAM suggests that Bitcoin is potentially overvalued. Traders and investors may consider selling their Bitcoin holdings during this zone to secure profits or manage risk. The threshold for the sell zone is adjustable, allowing users to adapt the indicator based on their trading preferences.
Methodology:
BEAM calculates the indicator value using the following formula:
beam = math.log(close / ta.sma(close, math.min(count, 1400))) / 2.5
The calculation involves taking the natural logarithm of the ratio between the current price of Bitcoin and a simple moving average of past prices. The moving average period used is a minimum of the specified count or 1400, providing a suitable historical reference for valuation assessment.
The resulting value of BEAM provides a standardized measure that can be compared across different time periods. By adjusting the thresholds for the buy and sell zones, users can customize BEAM to their preferred levels of undervaluation and overvaluation.
Utility:
BEAM serves as a tool for investors in the Bitcoin market, offering insights into Bitcoin's valuation and potential buying or selling opportunities. By monitoring BEAM, market participants can gauge whether Bitcoin is potentially undervalued or overvalued, helping them make informed decisions regarding their Bitcoin positions.
It is important to note that BEAM should be used in conjunction with other technical and fundamental analysis tools to validate signals and avoid relying solely on this indicator for trading decisions. Additionally, traders and investors are encouraged to adjust the threshold values based on their specific trading strategies, risk tolerance, and market conditions.
Credit: The BEAM (Bitcoin Economics Adaptive Multiple) indicator was originally developed by BitcoinEcon