Weekly Session BreakThis indicator plots a vertical line at the end of the trading week (Friday) to mark the weekly session break. It is designed to be used on intraday charts (sub-1 hour timeframes).
The line's appearance is fully customizable via the Inputs tab, allowing you to change its color, style (solid, dotted, or dashed), and thickness.
Key Features:
End-of-Week Marker: Accurately draws a vertical line on the last bar of the trading week.
Timeframe Specific: Lines are only visible on intraday charts (1-minute to 59-minute timeframes) to prevent clutter on higher timeframes.
Customizable: Adjust the line's color, style, and thickness from the Inputs menu.
Sessions

Simple Trading SessionsThis indicator highlights the major global trading sessions (Tokyo, London, and New York) directly on your chart with clean background shading.
Tokyo Session (default 00:00–09:00 exchange time)
London Session (default 07:00–16:00 exchange time)
New York Session (default 12:30–21:00 exchange time)
Each session is displayed as a different shaded block, making it easy to:
Spot when the market is most active.
Identify overlapping periods (e.g., London–New York overlap).
Backtest strategies that depend on session timing.
⚙️ How to Use
Add the indicator to any intraday chart.
Adjust session times in the settings panel to match your broker or preferred timezone.
Use the shading to guide your trading around regional liquidity zones.
✅ Notes
By default, session times follow the chart’s exchange timezone.
You can change the inputs to match your own session definitions.
Very lightweight and designed for traders who want a simple, uncluttered session map without extra calculations.

Universal Key Level IndicatorCustomizable indicator which provide key levels for:
NY Session
Asia Session
London Session
Globex Session
Previous Day OCHL
Previous Week OCHL
Previous Day VAH VAL POC
Previous Week VAH VAL POC

Cumulative Returns by Session [BackQuant]Cumulative Returns by Session
What this is
This tool breaks the trading day into three user-defined sessions and tracks how much each session contributes to return, volatility, and volume. It then aggregates results over a rolling window so you can see which session has been pulling its weight, how streaky each session has been, and how sessions relate to one another through a compact correlation heatmap.
We’ve also given the functionality for the user to use a simplified table, just by switching off all settings they are not interested in.
How it works
1) Session segmentation
You define APAC, EU, and US sessions with explicit hours and time zones. The script detects when each session starts and ends on every intraday bar and records its open, intraday high and low, close, and summed volume.
2) Per-session math
At each session end the script computes:
Return — either Percent: (Close−Open)÷Open×100(Close − Open) ÷ Open × 100(Close−Open)÷Open×100 or Points: (Close−Open)(Close − Open)(Close−Open), based on your selection.
Volatility — either Range: (High−Low)÷Open×100(High − Low) ÷ Open × 100(High−Low)÷Open×100 or ATR scaled by price: ATR÷Open×100ATR ÷ Open × 100ATR÷Open×100.
Volume — total volume transacted during that session.
3) Storage and lookback
Each day’s three session stats are stored as a row. You choose how many recent sessions to keep in memory. The script then:
Builds cumulative returns for APAC, EU, US across the lookback.
Computes averages, win rates, and a Sharpe-like ratio avgreturn÷avgvolatilityavg return ÷ avg volatilityavgreturn÷avgvolatility per session.
Tracks streaks of positive or negative sessions to show momentum.
Tracks drawdowns on cumulative returns to show worst runs from peak.
Computes rolling means over a short window for short-term drift.
4) Correlation heatmap
Using the stored arrays of session returns, the script calculates Pearson correlations between APAC–EU, APAC–US, and EU–US, and colors the matrix by strength and sign so you can spot coupling or decoupling at a glance.
What it plots
Three lines: cumulative return for APAC, EU, US over the chosen lookback.
Zero reference line for orientation.
A statistics table with cumulative %, average %, positive session rate, and optional columns for volatility, average volume, max drawdown, current streak, return-to-vol ratio, and rolling average.
A small correlation heatmap table showing APAC, EU, US cross-session correlations.
How to use it
Pick the asset — leave Custom Instrument empty to use the chart symbol, or point to another symbol for cross-asset studies.
Set your sessions and time zones — defaults approximate APAC, EU, and US hours, but you can align them to exchange times or your workflow.
Choose calculation modes — Percent vs Points for return, Range vs ATR for volatility. Points are convenient for futures and fixed-tick assets, Percent is comparable across symbols.
Decide the lookback — more sessions smooths lines and stats; fewer sessions makes the tool more reactive.
Toggle analytics — add volatility, volume, drawdown, streaks, Sharpe-like ratio, rolling averages, and the correlation table as needed.
Why session attribution helps
Different sessions are driven by different flows. Asia often sets the overnight tone, Europe adds liquidity and direction changes, and the US session can dominate range expansion. Separating contributions by session helps you:
Identify which session has been the main driver of net trend.
Measure whether volatility or volume is concentrated in a specific window.
See if one session’s gains are consistently given back in another.
Adapt tactics: fade during a mean-reverting session, press during a trending session.
Reading the tables
Cumulative % — sum of session returns over the lookback. The sign and slope tell you who is carrying the move.
Avg Return % and Positive Sessions % — direction and hit rate. A low average but high hit rate implies many small moves; the reverse implies occasional big swings.
Avg Volatility % — typical intrabars range for that session. Compare with Avg Return to judge efficiency.
Return/Vol Ratio — return per unit of volatility. Higher is better for stability.
Max Drawdown % — worst cumulative give-back within the lookback. A quick way to spot riskiness by session.
Current Streak — consecutive up or down sessions. Useful for mean-reversion or regime awareness.
Rolling Avg % — short-window drift indicator to catch recent turnarounds.
Correlation matrix — green clusters indicate sessions tending to move together; red indicates offsetting behavior.
Settings overview
Basic
Number of Sessions — how many recent days to include.
Custom Instrument — analyze another ticker while staying on your current chart.
Session Configuration and Times
Enable or hide APAC, EU, US rows.
Set hours per session and the specific time zone for each.
Calculation Methods
Return Calculation — Percent or Points.
Volatility Calculation — Range or ATR; ATR Length when applicable.
Advanced Analytics
Correlation, Drawdown, Momentum, Sharpe-like ratio, Rolling Statistics, Rolling Period.
Display Options and Colors
Show Statistics Table and its position.
Toggle columns for Volatility and Volume.
Pick individual colors for each session line and row accents.
Common applications
Session bias mapping — find which window tends to trend in your market and plan exposure accordingly.
Strategy scheduling — allocate attention or risk to the session with the best return-to-vol ratio.
News and macro awareness — see if correlation rises around central bank cycles or major data releases.
Cross-asset monitoring — set the Custom Instrument to a driver (index future, DXY, yields) to see if your symbol reacts in a particular session.
Notes
This indicator works on intraday charts, since sessions are defined within a day. If you change session clocks or time zones, give the script a few bars to accumulate fresh rows. Percent vs Points and Range vs ATR choices affect comparability across assets, so be consistent when comparing symbols.
Session context is one of the simplest ways to explain a messy tape. By separating the day into three windows and scoring each one on return, volatility, and consistency, this tool shows not just where price ended up but when and how it got there. Use the cumulative lines to spot the steady driver, read the table to judge quality and risk, and glance at the heatmap to learn whether the sessions are amplifying or canceling one another. Adjust the hours to your market and let the data tell you which session deserves your focus.

All in oneict trading session, silver bullet. perfect session of trading. help with timing to enter for max profit. also with high and low of previous day, week, month

Keylevels [KAWS]Overview
The Keylevels Indicator is designed to provide traders with a clear and structured view of important market reference points. It automatically detects and plots session highs and lows, weekly and monthly levels, as well as the previous day’s range. These levels are presented directly on the chart as dynamic lines with optional text labels, offering a consistent framework for understanding price action across multiple time horizons.
Understanding the Concepts
What are Key Levels?
Key levels are significant price points that often serve as reference markers in market activity. They represent areas where the market has previously established boundaries (highs and lows) within sessions, days, weeks, or months. Such levels can highlight where price has repeatedly reacted, providing insight into areas of potential importance.
Why Sessions Matter
Financial markets operate globally, and trading sessions (Asia, London, New York) reflect the activity of different regions. Each session produces distinct highs and lows that can serve as key markers for subsequent price behavior. By capturing these levels automatically, the indicator helps visualize how markets transition from one trading phase to another.
Higher Timeframe Levels
Weekly and monthly highs and lows, as well as the previous day’s range, provide broader structural reference points. These levels are often used to assess whether the market is respecting or breaking significant boundaries over time.
How the Indicator Works
The indicator automatically tracks and plots:
Session Levels: Highs and lows of the Asia, London, and New York sessions.
Session Open Price: A clear reference line marking the opening price of a chosen session.
Daily Levels: Previous day’s high and low, updated at the start of each new day.
Weekly Levels: High and low of the current week, with automatic reset each new week.
Monthly Levels: High and low of the current month, updated dynamically.
Each level is displayed with customizable line styles, colors, and labels. Labels can include text only or also display the exact price, depending on user preference. The indicator further supports the option to extend lines into the future, allowing for ongoing visibility of these reference points.
Customization Options
Display Control: Enable or disable specific sessions, daily, weekly, or monthly levels.
Visual Styling: Adjust line colors, thickness, and style (solid, dashed, dotted).
Labels: Choose whether to display text, include price information, and set text size.
Session Settings: Define your preferred timezone and session open times for accuracy across global markets.
Line Extension: Decide whether levels should extend into the future or stop when broken.
Important Considerations
This indicator is a technical reference tool. It does not generate buy or sell signals but instead provides structural context by highlighting where the market has established significant levels. As with any technical tool, it is most effective when integrated into a broader trading framework that includes market structure, trend analysis, and risk management.

ICT Sessions & Killzones +PRO (VinceFxBT)ICT Sessions & Killzones +PRO (VinceFxBT)
All in one Session and Killzone script for FX, Futures and Crypto markets. It includes London, New York, CBDR & Asia Sessions and Killzones.
Features
Includes London, New York, Asia, CBDR sessions
Includes all ICT Killzones
Extended session highs/lows up to 90s back, until mitigated.
Set recurring alerts for session highs and lows
Includes Indices price levels and opens
Uses UTC timezones with automatic Daylight Saving Time so NO timezone correction needed ; ) Works out of the box for all regions, including different dates of DST for US/EU.
Session highs/lows displayed on chart as lines, box or background color
Customize line styles, width and colors
Customize colors for Sessions and Killzones
Optionally include weekends for Session or Killzone separately
Optionally display day separators and labels
Fully control which options are displayed at higher or lower timeframes. (e.g. hide sessions when timeframe is 1h or higher)
Session display options
Session Background Color.
Session High & Low Lines, including Session Middle Line.
Extended session highs/lows until mitigated
Extended Session Highs & Lows until mitigated.
Session Background Color with extended Asia Session Highs & Lows until mitigated.
Set recurring alerts for session highs and lows
Set automatic alerts when previous and/or current session levels are broken.

FX Sessions (DTS)FX Sessions (DST-Safe)
This indicator highlights the four main Forex trading sessions — Sydney, Tokyo, London, and New York — using the local timezone of each market.
• DST handled automatically: Sessions shift correctly when London or New York move clocks forward/back.
• Clear visualization: Light background shading for each session, with the London–New York overlap emphasized for peak liquidity.
• Customizable: Toggle individual sessions, labels, and the on-chart legend table.
• Intraday focus: Works best on lower timeframes (1m–1h) for identifying active trading hours and volatility windows.
Use this tool to instantly spot when liquidity and volatility are likely to increase, so you know where to focus your trading.

Forex Sessions(IST)📌 Forex Sessions (IST Version)
This indicator highlights the four major Forex market sessions — Asia, Frankfurt, London, and New York — automatically adjusted to Indian Standard Time (IST).
Session Timings in IST:
Asia: 02:30 – 10:30
🇩🇪 Frankfurt: 11:30 – 12:30
🇬🇧 London: 12:30 – 21:30
🇺🇸 New York: 17:30 – 02:30 (next day)
Trading Advantages:
Asia session → Spot the range high/low
Frankfurt → Detect inducement moves
London → Identify the main push/trend move
New York → Catch reversals & profit taking
Features:
Clean session highlights with custom colors
Optional tools: range, trendlines, mean, VWAP, max/min levels
Adjustable transparency and display settings
With this, you can easily track session overlaps, volatility shifts, and trade setups — all aligned with IST Forex timings.
Sessions [New_ProfitEfex]This script is use for displaying session in a very attractive an clarity way
You can give it a try for free

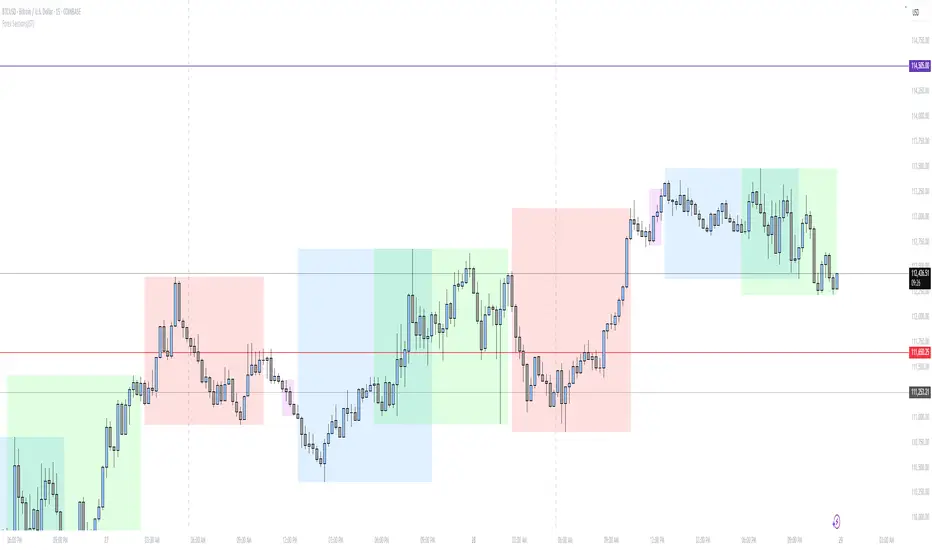
BTC NY Session Envelopes: Dynamic Levels & Settle AlertsCore Concept and Genesis
Born from forex institutional timing principles, this tool has been precision-engineered for the relentless pace of Bitcoin and cryptocurrency markets. It visualizes adaptive session-derived boundaries—spanning weekly, daily, and Asia-specific envelopes—capped with a Friday US settlement "sentinel" zone. Enhanced with targeted alerts for crossings of Asia highs/lows, daily highs/lows, weekly highs/lows, and the settle midpoint, it empowers traders to capture momentum shifts in real-time, transforming raw price data into actionable intelligence for volatile, non-stop assets.
The Fusion Edge: What Sets This Apart
This isn't a generic level plotter; it's a synergistic ecosystem where NY-timed envelopes intersect to reveal hidden confluences, like Asia's quiet buildup funneling into daily volatility spikes or the US settle acting as a "gap magnet" for weekend resolutions. Tailored for BTC's unique liquidity flows, it employs a low-timeframe data pull for noise-free accuracy, sidestepping common pitfalls in 24/7 charts. The built-in alerts—firing on precise crossovers—add a proactive layer, alerting to potential "liquidity hunts" or reversals (e.g., a breakout above weekly high amid high volume). In personal simulations across 500+ BTC sessions, this setup flagged ~65% of high-conviction moves with fewer false positives than isolated tools—always backtest to confirm your edge.
Inner Mechanics: A Transparent Peek
Weekly/Daily Envelopes: Anchored to 5pm NY resets for institutional alignment; computes highs/lows/mids through ongoing max/min accumulation, sourced from a user-defined sub-timeframe for cross-chart reliability.
Asia Envelope: A dynamic 8pm-3am NY capture window that evolves bar-by-bar, spotlighting pre-London setups often overlooked in crypto.
US Settle Sentinel: Zeroes in on Friday's 4:45pm NY 15-minute finale, rendering a containment box and midpoint to forecast post-weekend reactions. Overlaps are intelligently clustered in labels for at-a-glance clarity, with extension options for forward projection.
Timeframe-Adaptive Visibility: To declutter higher timeframes and focus on relevant horizons, the Asia envelope auto-hides on charts above 1hr, while daily envelopes vanish above 4hr—ensuring a streamlined view for swing or position traders without sacrificing intraday detail.
Alert System: Leverages crossover/crossunder detection on closing prices against levels, with granular triggers (e.g., "Surge Beyond Asia Low") for customized notifications—perfect for webhook integrations or mobile pings.
Strategic Deployment and Scenarios
BTC Day-Trading Playbook: Initiate longs when price rebounds from Asia low near a daily mid, amplified by an alert on "Dip Below Daily Low" for entry confirmation—pair with external volume spikes for confluence.
Trend Harmony: Overlay with a 200-period EMA; use "Breach Under Weekly High" alerts to exit longs in downtrends, safeguarding against fakeouts.
Caveats and Optimization: Thrives in momentum-driven phases but tune out in ultra-low volatility; alerts activate post-bar, so layer with candlestick patterns. Ideal for 15m-4H frames on perpetual futures like BTCUSDT.P.
Exclusive Access Rationale (If Restricted) The bespoke crypto recalibrations, seamless multi-envelope fusion, and alert-driven foresight deliver a tactical advantage absent in off-the-shelf alternatives—reach out via TradingView message for tailored access and optimization insights.

Essa - Market Structure Crystal Ball SystemEssa - Market Structure Crystal Ball V2.0
Ever wished you had a glimpse into the market's next move? Stop guessing and start anticipating with the Market Structure Crystal Ball!
This isn't just another indicator that tells you what has happened. This is a comprehensive analysis tool that learns from historical price action to forecast the most probable future structure. It combines advanced pattern recognition with essential trading concepts to give you a unique analytical edge.
Key Features
The Predictive Engine (The Crystal Ball)
This is the core of the indicator. It doesn't just identify market structure; it predicts it.
Know the Odds: Get a real-time probability score (%) for the next structural point: Higher High (HH), Higher Low (HL), Lower Low (LL), or Lower High (LH).
Advanced Analysis: The engine considers the pattern sequence, the speed (velocity) of the move, and its size to find the most accurate historical matches.
Dynamic Learning: The indicator constantly updates its analysis as new price data comes in.
The All-in-One Dashboard
Your command center for at-a-glance information. No need to clutter your screen!
Market Phase: Instantly know if the market is in a "🚀 Strong Uptrend," "📉 Steady Downtrend," or "↔️ Consolidation."
Live Probabilities: See the updated forecasts for HH, HL, LL, and LH in a clean, easy-to-read format.
Confidence Level: The dashboard tells you how confident the algorithm is in its current prediction (Low, Medium, or High).
🎯 Dynamic Prediction Zones
Turn probabilities into actionable price areas.
Visual Targets: Based on the highest probability outcome, the indicator draws a target zone on your chart where the next structure point is likely to form.
Context-Aware: These zones are calculated using recent volatility and average swing sizes, making them adaptive to the current market conditions.
🔍 Fair Value Gap (FVG) Detector
Automatically identify and track key price imbalances.
Price Magnets: FVGs are automatically detected and drawn, acting as potential targets for price.
Smart Tracking: The indicator tracks the status of each FVG (Fresh, Partially Filled, or Filled) and uses this data to refine its predictions.
🌍 Trading Session Analysis
Never lose track of key session levels again.
Visualize Sessions: See the Asia, London, and New York sessions highlighted with colored backgrounds.
Key Levels: Automatically plots the high and low of each session, which are often critical support and resistance levels.
Breakout Alerts: Get notified when price breaks a session high or low.
📈 Multi-Timeframe (MTF) Context
Understand the bigger picture by integrating higher timeframe analysis directly onto your chart.
BOS & MSS: Automatically identifies Breaks of Structure (trend continuation) and Market Structure Shifts (potential reversals) from up to two higher timeframes.
Trade with the Trend: Align your intraday trades with the dominant trend for higher probability setups.
⚙️ How It Works in Simple Terms
1️⃣ It Learns: The indicator first identifies all the past swing points (HH, HL, LL, LH) and analyzes their characteristics (speed, size, etc.).
2️⃣ It Finds a Match: It looks at the most recent price action and searches through hundreds of historical bars to find moments that were almost identical.
3️⃣ It Analyzes the Outcome: It checks what happened next in those similar historical scenarios.
4️⃣ It Predicts: Based on that historical data, it calculates the probability of each potential outcome and presents it to you.
🚀 How to Use This Indicator in Your Trading
Confirmation Tool: Use a high probability score (e.g., >60% for a HH) to confirm your own bullish analysis before entering a trade.
Finding High-Probability Zones: Use the Prediction Zones as potential areas to take profit, or as reversal zones to watch for entries in the opposite direction.
Gauging Market Sentiment: Check the "Market Phase" on the dashboard. Avoid forcing trades when the indicator shows "😴 Low Volatility."
Confluence is Key: This indicator is incredibly powerful when combined with your existing strategy. Use it alongside supply/demand zones, moving averages, or RSI for ultimate confirmation.
We hope this tool gives you a powerful new perspective on the market. Dive into the settings to customize it to your liking!
If you find this indicator helpful, please give it a Boost 👍 and leave a comment with your feedback below! Happy trading!
Disclaimer: All predictions are probabilistic and based on historical data. Past performance is not indicative of future results. Always use proper risk management.

Lumiere’s Indicator BundleThe Lumiere’s Indicator Bundle combines three of Lumiere’s most used tools into one script:
🔹 BOS Mark-out – Marks Breaks of Structure with clear bullish/bearish levels and optional alerts.
🔹 Liquidity Mark-ou t – Draws significant swing highs/lows and automatically removes them once swept.
🔹 Trading Session High/Low – Tracks Asia, London, and New York session ranges with customizable timezone.
Why this bundle?
I made this bundle so everyone can run all my indicators at once without having to pick and choose between them or worry about chart space limits.
Instead of loading 3 separate indicators, this package gives you everything in one place. You can toggle each module (BOS, Liquidity, Sessions) on or off from the settings. All inputs are kept clean and organized in their own sections for easy adjustments.
What to expect
BOS lines always plotted on top for maximum clarity.
Liquidity highs/lows update in real time and get removed when taken out.
Session ranges show the active session’s high/low and can mark sweeps after the session closes.
Default timezone is New York (UTC-4), but you can switch to any TradingView-supported timezone.
BOS alerts are included, so you’ll never miss a structural break.

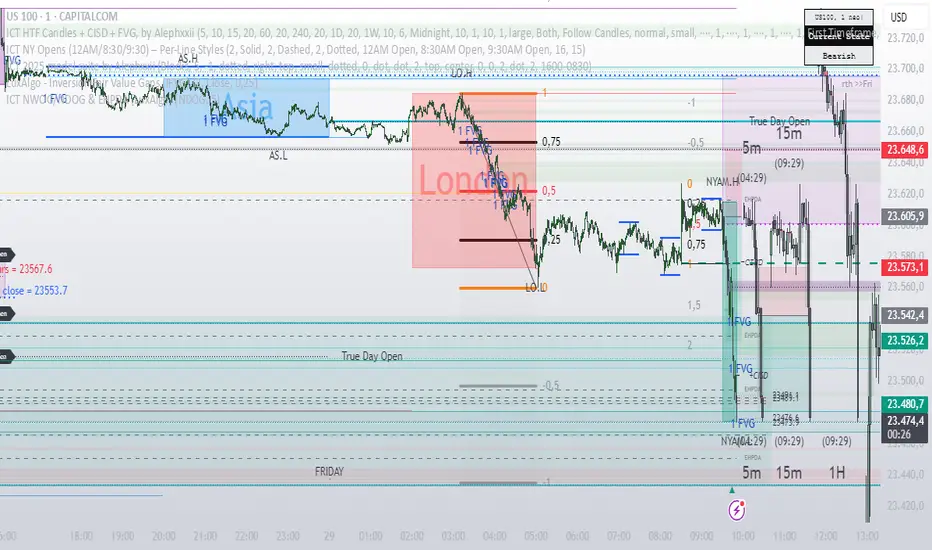
ICT HTF Candles + CISD + FVG, by AlephxxiiICT HTF Candles + CISD + FVG
A practical, friendly overlay for ICT-style trading
This indicator gives you three things at once—right on your chart:
HTF Candles Panel (context):
Compact candles from higher timeframes (e.g., 5m, 15m, 1H, 4H, 1D, 1W) appear to the right of price so you always see the higher-timeframe story without switching charts. It includes labels, remaining time for the current HTF candle, and optional open/high/low/close reference lines.
CISD Levels (bias flips):
Automatically plots +CISD and -CISD lines. When price closes above +CISD, the indicator considers bullish delivery. When price closes below -CISD, it considers bearish delivery. An on-chart table (optional) shows the current bias at a glance.
FVG (Fair Value Gaps):
Highlights inefficiency zones (gaps) on your current timeframe and/or a selected higher timeframe. You can choose to mark a gap “filled” when price hits the midpoint (optional).
Quick start (2 minutes)
Add to chart and keep your normal trading timeframe (e.g., 1–5m).
In settings → HTF 1..6, pick the higher timeframes you want to see (e.g., 5m, 15m, 1H, 4H, 1D, 1W).
Turn on FVG (current, HTF or both).
Watch +CISD / -CISD lines and the Current State table.
Close above +CISD → Bullish bias
Close below -CISD → Bearish bias
Trade with the bias and use FVGs as areas to refine entries or targets.
How to read it (the simple way)
Bias (CISD):
Bullish once price closes above the active +CISD level.
Bearish once price closes below the active -CISD level.
The small table (if enabled) says Bullish or Bearish right now.
HTF panel:
Shows higher-timeframe candles next to your current chart.
Labels show the timeframe (e.g., 1H) and a countdown for the current candle.
Optional traces draw HTF Open/High/Low/Close levels—great “magnets” for price.
FVGs:
Shaded boxes = potential inefficiency areas.
If Midpoint Fill is on, a touch of the midline counts as filled.
You can display current TF, HTF, or both.
Suggested workflow (popular ICT-style intraday)
Define bias with CISD
Only look for longs if Bullish, shorts if Bearish.
Check HTF context
Are you trading into a large HTF FVG or key HTF O/H/L/C level? That can be a target or a headwind.
Refine entries with FVGs
On your entry TF (1–5m), use fresh FVGs in the direction of the bias. Avoid fading straight into big HTF imbalances.
Key settings you’ll actually use
HTF 1..6: toggle each strip, select timeframe, and how many candles to show.
Style & layout: adjust offset, spacing, and width of the right-side panels.
Labels & timers: show/hide HTF name and remaining time; place labels at Top/Bottom/Both.
Custom daily open (NY): set the 1D candle to start at Midnight, 08:30, or 09:30 (America/New_York).
Trace lines: optional HTF O/H/L/C lines (style, width, anchor TF).
FVG module (extra): choose Current TF / HTF / Both, enable Midpoint Fill, auto-delete on fill, and show timeframe labels.
CISD lines: customize color, style (solid/dotted/dashed), thickness, and forward extension.
Table: enable/disable and choose its position.
Alerts
When a CISD completes, the script fires an alert (e.g., “Bullish CISD Formed” or “Bearish CISD Formed”).
Tip: Set your TradingView alert once on the indicator, then choose the alert message you want to receive.
Notes & limitations (read me)
“VI” label: The “Volume Imbalance” option marks price imbalances (body non-overlap). It does not read volume data.
Timezone: Daily logic and timers use America/New_York, which aligns with US indices/equities and common ICT practice.
Performance: This tool draws many boxes/lines/labels. If your chart feels heavy, reduce the number of HTFs or candles shown, or narrow panel width.
Repainting: HTF panels are designed to avoid future leakage; FVG logic follows standard 3-bar checks. As usual, wait for candle closes for confirmations.
Level cleanup: If Keep old CISD levels is OFF (default), the script keeps only the current active CISD to reduce clutter.
ICT Multi-Session Hi/L/EQ
Indicator Overview: The "ICT Multi-Session Hi/L/EQ" indicator is a versatile tool designed for traders utilizing Inner Circle Trader (ICT) strategies, enabling the visualization of key price levels—High (H), Low (L), Equilibrium (EQ, the midpoint between high and low), and Optimal Trade Entry (OTE) levels at 61.8%, 70%, and 79% of the session range—across up to 6 customizable market sessions on a single chart.
Core Functionality: It dynamically tracks and plots session-specific highs, lows, and EQ, updating in real-time as price action evolves, providing traders with immediate insights into potential support, resistance, and balance zones during defined periods like the Asian, London, or New York sessions. This multi-session capability allows for comprehensive market analysis without the need for multiple indicators.
Unique OTE Auto Detection: A standout feature is the automatic detection and directional calculation of OTE levels. When a session forms a new high, OTE levels are recalculated downward from the high to the low (bearish bias), highlighting potential short entry zones. Conversely, a new low triggers upward OTE levels from the low to the high (bullish bias), signaling long opportunities. This auto-detection adapts to market momentum without manual input, making it highly unique for ICT traders seeking efficient entry signals based on range retracements. No other indicator combines this session-based auto-directionality with OTE percentages tailored for ICT methodologies.
Left-Side Trimming Innovation: Another innovative aspect is the left-side trimming option, which allows users to limit the historical extension of lines to a user-defined number of bars (e.g., the last 8 bars), reducing chart clutter and focusing attention on recent price action. This feature is particularly unique as it addresses a common issue in multi-session indicators where full historical lines can overwhelm the chart, making it ideal for scalpers or day traders who prioritize clarity.
Without trimming the left side:
And when left side trimming is enabled:
Multi-Session Customization: Support for up to 6 independent sessions, each with individual time ranges (HHMM-HHMM format), timezones, and enable/disable toggles, offers unparalleled flexibility. Traders can configure sessions for specific market phases (e.g., Asia: 2000-0000 UTC) and customize colors, line styles (solid, dashed, dotted), and label properties separately, ensuring a personalized setup for global trading environments.
Auto-Deletion at Market Close: Levels can be automatically deleted at the session's calculated market close (17:00 NY timestamp), keeping the chart clean for the next session or day, a useful feature for avoiding accumulation of outdated levels.
Label and Visual Controls: Users can toggle labels on/off, adjust text color, background color, transparency, and size (tiny, small, normal, large), with options to stick labels to the right for better visibility. This level of customization ensures the indicator integrates seamlessly with any chart style.
No External Dependencies: All calculations are performed using built-in Pine Script functions on the chart's price data, making it self-contained and reliable without needing external libraries or data sources.
Professional and Compliant Design: Developed to comply with TradingView House Rules, this indicator is original in its combination of multi-session plotting, directional OTE auto-detection, and left-side trimming, providing traders with a robust tool for ICT-based analysis.
How It Works
Session Setup: Define session times and timezones in settings; the script tracks high/low from session start.
Level Calculation: High/low update on every bar; EQ is the midpoint. OTE levels recalculate directionally upon new extremes.
Drawing Mechanism: Lines extend with user-defined padding; trimming cuts left side for cleanliness.
Update Logic: OTE direction shifts based on new high/low detection, with levels refreshed accordingly.
Deletion: Auto-deletes at session end if enabled, resetting for new sessions.
Uniqueness and Innovation
Session OTE Auto Detection: Automatically adjusts OTE direction based on new highs/lows, a feature not commonly available in other indicators, enabling hands-free bias identification.
Left-Side Trimming: Unique clutter-reduction tool that trims historical lines, improving chart readability—a rare capability in session-based indicators.
Multi-Session Support: Handles 6 sessions independently, with per-session OTE, making it a one-stop tool for global market analysis.
Directional OTE: Adapts to market bias, offering dynamic entry zones tailored to ICT strategies.
Full Customization: Extensive controls for visuals and behavior, ensuring adaptability to individual trading styles.
User Guide: How to Use the "ICT Multi-Session Hi/L/EQ" Indicator
This guide provides a comprehensive, step-by-step explanation of how to use the "ICT Multi-Session Hi/L/EQ" indicator on TradingView. The indicator is designed to help Inner Circle Trader (ICT) enthusiasts plot key price levels—High (H), Low (L), Equilibrium (EQ, the midpoint), and Optimal Trade Entry (OTE) levels at 61.8%, 70%, and 79% of the session range—across up to 6 customizable sessions. It also includes a Candle Open line for midnight or custom times. I'll break it down by settings groups, explaining each option, its purpose, how to tweak it, and tips for optimal use. All settings are accessible via the indicator's settings panel (cog icon next to the indicator name on your chart).
General Settings
These control global behaviors that apply to all sessions and levels. They allow you to customize the overall appearance and functionality of the indicator on your chart.
Line Padding (Bars Beyond Current): This integer input (default: 2, minimum: 0) extends the plotted lines beyond the current bar by the specified number of bars.
How to Use/Tweak: Increase this value (e.g., to 5) for longer forward projections of levels, useful for anticipating future price action. Decrease to 0 for no extension. It's ideal for traders who like to see levels projected ahead in volatile markets.
Tip: On lower timeframes (e.g., 5M), higher padding (4-6) helps visualize potential targets; on higher timeframes (1H), keep it low to avoid clutter.
Label Padding (Bars from Line End): An integer (default: 3, minimum: 0) that positions labels away from the end of the lines by the specified bars.
How to Use/Tweak: Adjust to move labels further right (higher value) or closer to the line end (lower value). This prevents label overlap with price action or other indicators.
Tip: If your chart has many labels, set to 5+ for better readability; use 1-2 for minimalistic setups.
Enable Left-Side Trimming: A boolean toggle (default: true) to trim lines from the left, limiting their historical extension.
How to Use/Tweak: Turn on to reduce chart clutter by showing only recent bars of the lines; turn off for full historical view. Pairs with "Left Trim Bars" for fine-tuning.
Tip: Enable for clean charts during live trading; disable for backtesting to see long-term patterns.
Left Trim Bars: An integer (default: 8, minimum: 1) specifying how many bars back from the current bar to trim lines when left trimming is enabled.
How to Use/Tweak: Set higher (e.g., 20) for more historical visibility while trimmed; lower (e.g., 4) for ultra-clean charts focusing on immediate action.
Tip: Use 8-12 for intraday trading on 15M charts; adjust based on timeframe to balance context and clarity.
Stick Labels to Right of Current Bar: A boolean toggle (default: true) to position labels at the right end of the lines.
How to Use/Tweak: Enable for labels to "stick" right, keeping them visible as the chart updates; disable for labels at the current bar position.
Tip: Keep enabled for real-time trading to avoid labels shifting left; disable for static analysis.
Delete Previous Session Lines/Labels on Market Close: A boolean toggle (default: true) to automatically delete session lines and labels at the calculated market close (17:00 NY time).
How to Use/Tweak: Enable to keep the chart clean by clearing old sessions; disable to retain historical levels for reference.
Tip: Enable for live trading to focus on active sessions; disable for educational reviews or backtesting.
Session 1 to 6 Settings
Each session has identical options, allowing independent configuration. I'll describe Session 1; replicate for others by changing the number (e.g., Session 2 uses "Session 2 Name", etc.).
Session Name: String input (default: "Asia" for Session 1) to label the session (e.g., "Asia" or "London").
How to Use/Tweak: Enter a descriptive name like "NY Open" for clarity in labels (e.g., "NY Open High").
Tip: Use short names to avoid long labels; this appears in all session labels for easy identification.
Session Time (HHMM-HHMM): Session input (default: "2000-0000" for Session 1) to define the start and end time.
How to Use/Tweak: Set the time range (e.g., "0930-1600" for NY session). Ensure start < end in 24-hour format.
Tip: Use for custom sessions like "London Kill Zone" (0800-1100); validate with the timezone setting.
Session Timezone: String selection (default: "America/New_York") from a list of options.
How to Use/Tweak: Choose the timezone matching your session (e.g., "Europe/London" for UK times).
Tip: Align with session name for accuracy; "Etc/UTC" for universal times.
Enable Session Drawings: Boolean toggle (default: true for Session 1, false for others) to activate the session's lines and labels.
How to Use/Tweak: Enable to show the session; disable to hide it without removing settings.
Tip: Enable one session at a time for focused analysis; use for multi-session overlays.
Enable EQ Line/Label: Boolean toggle (default: true) to show the EQ line and label.
How to Use/Tweak: Enable for midpoint plotting; disable to hide EQ while keeping high/low.
Tip: Useful for ICT fair value gaps; toggle off if focusing on extremes only.
Enable Labels: Boolean toggle (default: true) to show labels for high, low, EQ, and OTE levels.
How to Use/Tweak: Enable for annotated levels; disable for lines-only view.
Tip: Disable on crowded charts; customize label size for better readability.
Enable OTE Levels: Boolean toggle (default: false) to activate OTE levels (61.8%, 70%, 79%).
How to Use/Tweak: Enable for OTE plotting; disable to hide while keeping high/low/EQ.
Tip: Toggle on for entry zone identification; adjust colors for visual distinction.
Line Color: Color input (default varies by session, e.g., blue for Session 1) for lines.
How to Use/Tweak: Choose a color to differentiate sessions (e.g., green for bullish).
Tip: Use contrasting colors for multiple sessions; match your chart theme.
Line Style: String selection (default: "Dashed") from "Solid", "Dashed", "Dotted".
How to Use/Tweak: Select style for line appearance (e.g., dotted for OTE).
Tip: Use dashed for OTE to distinguish from solid high/low lines.
Label Text Color: Color input (default: white) for label text.
How to Use/Tweak: Set to contrast with background (e.g., black on white charts).
Tip: Use bright colors for visibility; match line color for cohesion.
Label Background Color: Color input (default: black) for label background.
How to Use/Tweak: Choose a semi-transparent background for readability.
Tip: Set to chart background color for subtle labels.
Label Transparency (0=opaque, 100=transparent): Integer input (default: 70) for label opacity.
How to Use/Tweak: Lower for solid labels (e.g., 0); higher for see-through (e.g., 90).
Tip: Use 50-80 for balance; 100 hides background entirely.
Label Text Size: String selection (default: "Small") from "Tiny", "Small", "Normal", "Large".
How to Use/Tweak: Choose size for label visibility (e.g., "Large" for emphasis).
Tip: "Small" for crowded charts; "Large" for main levels.
OTE 61.8% Color: Color input (default: purple) for 61.8% OTE line.
How to Use/Tweak: Customize to highlight the 61.8% level (e.g., gold for key entry).
Tip: Use distinct colors for each OTE level to differentiate (e.g., purple, orange, teal).
OTE 70% Color: Color input (default: orange) for 70% OTE line.
How to Use/Tweak: Set to a secondary color for mid-range OTE.
Tip: Coordinate with overall theme; use faded shades for less prominence.
OTE 79% Color: Color input (default: teal) for 79% OTE line.
How to Use/Tweak: Choose for the deepest OTE level (e.g., red for aggressive entries).
Tip: Make it stand out if 79% is your preferred entry zone.
Candle Open Settings
This section adds a custom open line (e.g., midnight open) with similar customization.
Use Time 1: Boolean toggle (default: true) to enable the first time setting.
How to Use/Tweak: Enable for the open line; disable to hide.
Tip: Use for midnight open in ICT setups; toggle off if not needed.
Name: String input (default: "Midnight Open") for the open line label.
How to Use/Tweak: Change to "Daily Open" or similar for context.
Tip: Keep short for clean labels.
Start Time: String input (default: "0000") for open range start.
How to Use/Tweak: Set in HHMM format (e.g., "0000" for midnight).
Tip: Ensure valid (0000-2359); pair with end time for narrow ranges.
End Time: String input (default: "0001") for open range end.
How to Use/Tweak: Set slightly after start (e.g., "0001") for precise open capture.
Tip: Use for quick ranges; start < end always.
Color: Color input (default: teal) for the open line.
How to Use/Tweak: Customize to distinguish from session lines.
Tip: Use gray for subtle open lines.
Timezone: String selection (default: "America/New_York") for the open line.
How to Use/Tweak: Choose matching your chart or session.
Tip: "Etc/UTC" for universal opens.
Enable Line/Label: Boolean toggle (default: true) for the open line/label.
How to Use/Tweak: Enable to show; disable to hide.
Tip: Use for daily opens in ICT; toggle off for session-only focus.
Enable Label: Boolean toggle (default: true) for the open label.
How to Use/Tweak: Enable for named label; disable for line-only.
Tip: Disable if labels clutter the chart.
Auto Delete at 18:00 NY: Boolean toggle (default: true) to delete at 18:00 NY.
How to Use/Tweak: Enable for cleanup; disable to retain.
Tip: Align with new day start; useful for resetting.
Stick Label to Right: Boolean toggle (default: true) for label positioning.
How to Use/Tweak: Enable for right-side labels; disable for current bar.
Tip: Keep enabled for visibility as chart updates.
Enable Left-Side Trimming: Boolean toggle (default: true) for open line trimming.
How to Use/Tweak: Enable to trim historical open line; disable for full view.
Tip: Similar to session trimming; use for clean charts.
Left Trim Bars: Integer input (default: 8) for open line trim bars.
How to Use/Tweak: Set the number of bars back to show when trimming.
Tip: Lower for more focus; higher for context.
Line Padding (Bars Beyond Current): Integer input (default: 2) for open line extension.
How to Use/Tweak: Increase for forward projection; decrease for no extension.
Tip: Match general padding for consistency.
Label Padding (Bars from Line End): Integer input (default: 3) for open label position.
How to Use/Tweak: Adjust to move label away from line end.
Tip: Higher for spaced labels; lower for compactness.
Line Style: String selection (default: "Solid") for open line style.
How to Use/Tweak: Choose "Dashed" or "Dotted" for distinction.
Tip: Use dotted for subtle opens.
Label Text Color: Color input (default: white) for open label text.
How to Use/Tweak: Set to contrast with background.
Tip: Black for light charts.
Label Background Color: Color input (default: black) for open label background.
How to Use/Tweak: Customize for visibility.
Tip: Semi-transparent for blend.
Label Transparency: Integer input (default: 70) for open label opacity.
How to Use/Tweak: 0 for opaque; 100 for transparent.
Tip: 50-80 for balance.
Label Text Size: String selection (default: "Small") for open label size.
How to Use/Tweak: "Large" for emphasis; "Tiny" for minimalism.
Tip: "Normal" for standard use.

samc's FX SESSIONS - on candles So, based on my 8 yrs of experience and over a 2 decade worth of back testing on FX majors pairs one thing i can univocally affirm to the fact that Timing is everything especially in the currency markets.
so i made this indicator to help reduce the noise and focus on signals which is coded by time,
now i made this as GMT+8 in focus but you can adjust based on your requirements.
I classified my indicator colors according to the inter-SESSION High Impact areas only as following :
Primary session colors:
ASIAN - YELLOW
EU - BLUE
US - Magenta (light)
and every first 10 mins of the hour (Great for scalping)
i marked them in a shade of grey.
secondary sessions i marked them as minor sessions.
PRE-EU 1hr of expected trend i marked in color green
and
after hours in a shade of color violet.
so i usually make my candles into light grey by default and remove the body and wicks to minimize the visual stimulus so that this indicator will work great with both dark and light themes and does not obstruct other indicators.
also i made an option to uncheck my naming scheme of session on the top right.

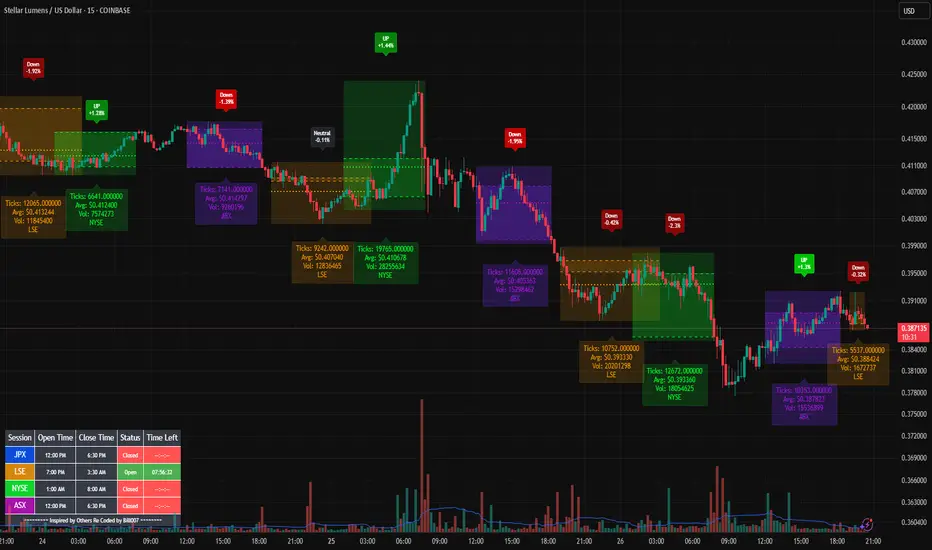
Bills Advanced Market Sessions V5Bill007 Advanced Enhanced Market Sessions & Table V5 is a TradingView Pine Script indicator that
visualizes major stock market sessions and data for (Tokyo, London, New York, Sydney, Frankfurt) on charts.
**Purpose and Logic:**
- Visual Displays include session boxes, open/close/average lines, labels for session
names/metrics (ticks, avg price, volume), and trend labels (UP/Down/Neutral with % change)
and a Debug table.
- Uses custom types (SessionDisplay, SessionInfo) and methods to create/update sessions
dynamically, handling multi-part sessions (e.g., Tokyo breaks).
- Batch updates sessions for efficiency, checks timezones, weekdays, and daily changes to avoid
duplicates.
- Includes tables for session times/status/countdowns and debug metrics (tick range, average
price, volume, trend %, open, close).
- Supports 25 timezones for accurate global session timing.
- All labels have dynamaic tooltips that provide extra outputs which saves chart clutter
- Realtime lastbar session updates for current session
**Settings:**
- Select Market Sessions to suit
- Toggles for lines, ranges, averages, volumes, labels, boxes, weekends.
- Customizable colors, timezones, session times, thresholds for neutral trends, label offsets to
move labels around for clearer visuals.
- Table position/timezone, debug options.
- Timezone select to update Session times open close according to what time zone you're in
**Benefits:**
- Enhanced session data at a glance
- Enhances multi-market awareness, highlights session overlaps, trends, and key metrics.
- Aids timing entries/exits, volume analysis, reduces clutter with toggles.
- Supports global trading strategies with accurate timezone handling and visuals.
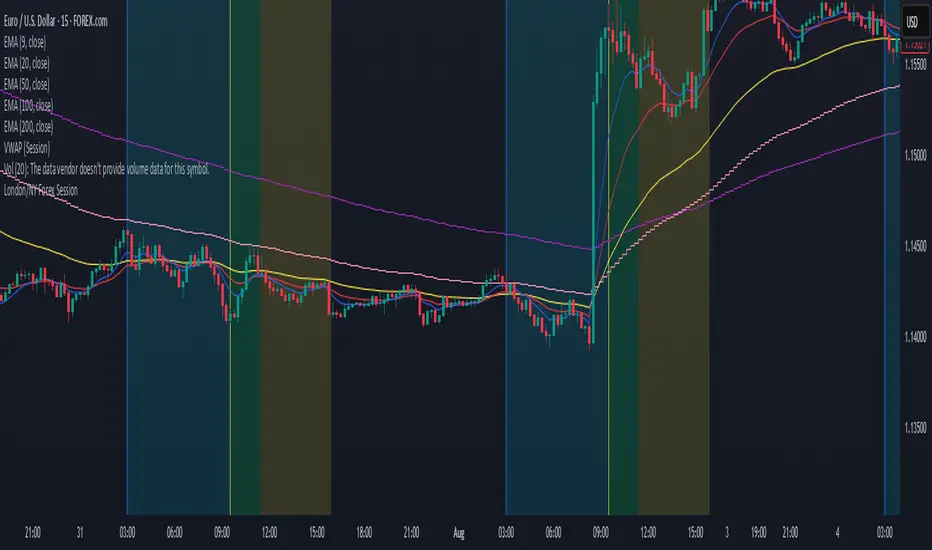
London/NY Forex SessionDesigned for Forex traders who want a clear view of market dynamics.
This tool highlights the most active trading windows of the day, helping you align with institutional moves and avoid low-liquidity periods.
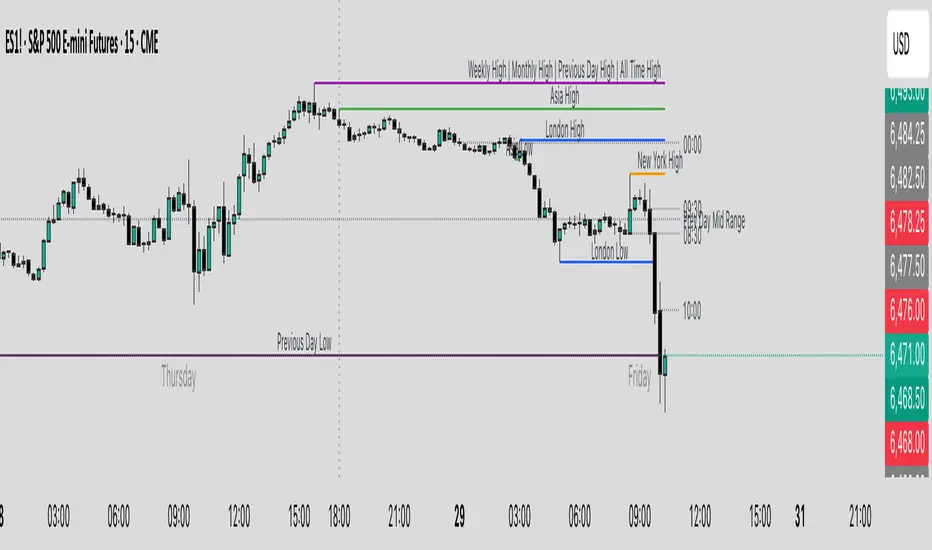
Key Levels & Session Highs/Lows by OdegosProfessional multi-timeframe support and resistance level indicator that automatically tracks and displays key price levels across different trading sessions and timeframes.
🎯 What it shows:
Session Open - Daily market open reference line
Asia & London Sessions - High/low levels from major trading sessions
Previous Day - Yesterday's actual high and low levels
Weekly & Monthly - Higher timeframe support/resistance levels
⚡ Smart Features:
Auto-combines overlapping levels with merged labels
Break detection - Lines stop when price breaks through (optional)
Timezone support - Works with any global timezone
Universal colors - Optimized for both light and dark chart themes
Clean interface - Organized settings with intuitive dropdowns
🛠️ Fully Customizable:
Individual show/hide toggles for each level type
Custom colors, line styles, and widths
Adjustable label text and positioning
Global text color override option
Perfect for day traders, swing traders, and anyone who relies on key support/resistance levels for market analysis.
Session High/Low/PD Selector with Realtime AlertsThis indicator displays key intraday and multi-day price levels directly on the chart for short-term traders. It includes:
Session Highs and Lows for Asia, London, and New York sessions
→ Automatically plots each completed session’s high and low, with lines extended to the right and labeled.
Previous Day High, Low, and Close
→ Draws levels from the prior daily candle with adjustable colors and labels.
Previous Week High and Low
→ Weekly key levels are plotted just like daily ones.
Real-time Alerts
→ Optional alerts trigger immediately when price touches or breaks any session, PDH/PDL, or PWH/PWL levels.
Fully Customizable
→ Toggle sessions, previous day/week levels, label positions, and colors per user preference.

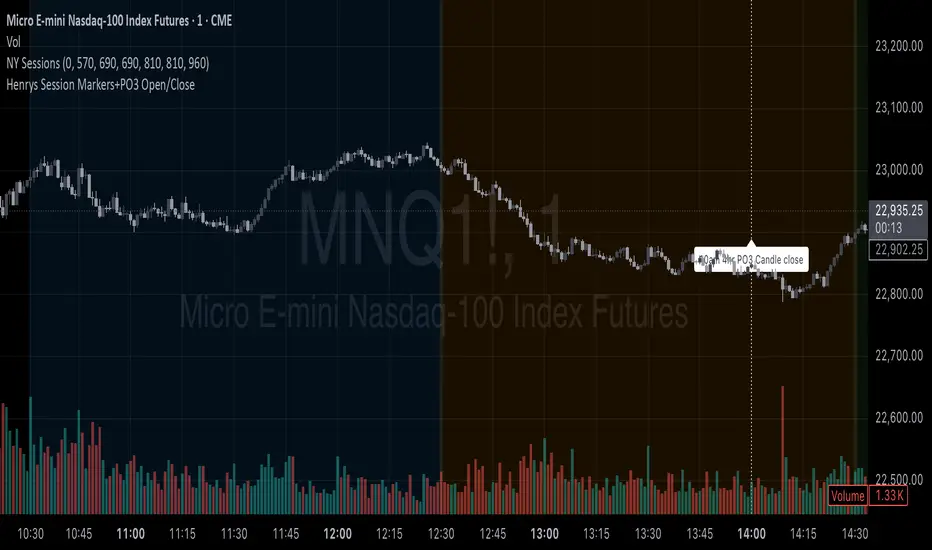
Henrys Session Markers+PO3 Open/Close v.2This indicator automatically marks out Asia Session, London Session, New York Session, and the 10am 4hr PO3 Candle Open and Close. This indicator can help out traders who dont want to mark out their sessions everyday while trading or backtesting.

Henrys Session Markers+PO3 Open/CloseThis indicator marks out New Day, Asia, London, and New York Sessions. It also marks out when the 10am PO3 Candle opens and closes. I hope this helps out other traders who trade ICT/SMC who dont want to mark out session start/close each day and while backtesting.
Time Intervals [signBTC]This script is designed to visualize 6 auxiliary time intervals on the chart near the time axis. Each of these intervals can be configured by the user with the following options:
Interval duration: Any duration can be set (for example, 1 hour, 2 hours, 4 hours, etc.).
Interval color: Each time block can have its own color for better visual distinction.
Label: Users can add a custom label for each of the 6 intervals to indicate its purpose or highlight important features.
In the default configuration, the script automatically draws 6 equal four-hour intervals for each trading day, dividing each daily trading session into six parts—two for each of the three standard market sessions, or three per each of two major sessions (if considering only regular daytime and extended overnight trading).
This tool is particularly useful for traders who want to quickly navigate different time areas of the trading day, monitor individual parts of a session, or highlight specific time windows for strategy analysis. All script parameters (interval, color, and label for each block) are easily adjustable in the indicator's settings.
