Alpha - Bybit Directional MetricsThis is only for BTCUSD contracts on the Bybit exchange.
Alerts are built-in and working.
No Repainting nonsense.
Important:
This indicator will ONLY work for the ticker it is built for. It will not plot if you try and apply it to a different ticker.
Features:
Select the prefered lookback length, either Short or Long. If looking for a more reactive means of calculation then use Short. If you want more data taken into account giving a greater average then use Long.
Green bar color represents a LONG opportunity
Red bar color represents a SHORT opportunity
This has been built specifically for @Rektproof for his trading comp so good luck fam. Killem.
Short

Stochastic Pro Suite (Zeiierman)█ Overview
Stochastic Pro Suite (Zeiierman) is a full stochastic trading framework built on top of an Efficient Price engine. Instead of feeding the oscillator with raw price data, the script first converts price into a volatility-aware, efficiency-weighted path called Efficient Price and then builds a stochastic on that foundation. Every major component, including EP Stochastic, Significant Stochastic Moves, divergence logic, inefficiency regimes, momentum impulses, and the multi-timeframe dashboard, reads from this refined stream.
The result is a stochastic that still behaves like the familiar 0–100 %K/%D oscillator, but with far more context behind every move. It doesn’t simply tell you where the price is within a recent high–low range; it tells you how reliable that move is, how clean the underlying regime is, and when the internal rotation is stretched. The tool works equally well for traders who like classic overbought/oversold swings and those who prefer higher-level context such as pressure bands, regime shifts, and impulse-driven moves.
⚪ Why This One Is Unique
Most stochastic indicators calculate %K and %D directly from the recent high–low range. Stochastic Pro Suite goes a step earlier in the chain. It first runs the chosen EP source (Close, Mean-reversion, or Trend) through a two-stage Efficient Price model that adapts to volatility, filters out random zigzags, and emphasizes directional quality. Only then is the stochastic calculation applied.
This means that when the oscillator hugs the top of its range, it’s not just reacting to any move up; it’s reacting to price movement that has already passed through an efficiency filter. Shallow, noisy moves tend to be down-weighted; clean, committed pushes stand out more. Around this EP Stochastic core, the script layers:
Significant Stochastic Moves to track internal pressure zones,
Divergence detection based on EP-Stochastic pivots,
An inefficiency layer that flags distorted regimes,
A momentum impulse engine focused on unusually strong surges, and
A dashboard that stitches everything together across multiple timeframes.
█ Main Features
⚪ EP-Based Stochastic
At the core is an EP-Stochastic built on Efficient Price instead of raw highs and lows. The oscillator keeps the classic stochastic look:
0–100 scale,
Upper and lower tension zones,
A midline representing balance,
Signal line via several moving-average types.
What changes is the input: instead of loosely tracking every tick, the EP engine compresses noisy swings and lets structured moves dominate the signal. This makes the stochastic more stable in directionally clean phases and more revealing when the market truly rotates.
You can choose between three EP behaviors to shape how the oscillator responds:
Close
The engine follows price almost one-to-one, but with the benefit of efficiency filtering. This setting is ideal if you want a familiar, general-purpose stochastic feel with fewer random spikes and more meaningful tests of the bands.
Mean-reversion
Here, the EP source emphasizes swing turns and back-and-forth rotation. The stochastic becomes a dedicated swing tool: transitions between upper and lower zones become more pronounced, and range-bound behavior is easier to read. This mode is well-suited for traders who fade extremes or trade oscillations inside a broader sideways structure.
To get better mean-reversal signals, increase the Stochastic Length to 200 and the Efficiency Length to 20.
Trend
In Trend mode, the EP source is smoothed to emphasize directional movement. When a trend is strong, the oscillator stays mostly in one half of its range and usually remains there until the trend begins to weaken. This makes it easier to see whether a pullback is just a pause in the trend or a sign that the structure is starting to roll over.
If you increase the EP Length, a more filtered trend will appear.
⚪ Significant Stochastic Moves
Instead of only watching fixed numerical levels like “80” or “20,” the suite identifies where the oscillator is trading within its own evolving range. Significant Stochastic Moves appear when the EP Stochastic pushes into internally important zones, areas where the market has historically shown heightened reaction or follow-through.
These highlights show when the stochastic is pressing into one of its key pressure zones. This helps you distinguish between normal rotation and moments where the internal push becomes strong enough to deserve attention. To identify significant moves, switch to Mean-reversion mode.
⚪ Divergence Detection
The script includes automatic detection of regular bullish and bearish divergences between the EP-Stochastic and price:
Bullish divergence: price makes a lower low while the EP-Stochastic prints a higher low.
Bearish divergence: price makes a higher high while the EP-Stochastic prints a lower high.
These are drawn directly on the oscillator pane with clear labels. Because the oscillator is driven by Efficient Price, many of the “random” divergences you see with standard stochastic are filtered out, leaving fewer but more structurally relevant signals, especially around extended trends, tight ranges, and turning points. To detect divergence, switch to Mean Reversion mode.
Since this divergence function is based on price-efficiency rather than traditional momentum swings, some divergences may appear a bit unconventional; however, the accuracy is on an entirely different level.
⚪ Momentum Impulses
Momentum impulses focus on moments when the oscillator accelerates unusually quickly relative to its own recent behavior.
Green circles near the upper region highlight powerful bullish surges.
Red circles near the lower region highlight powerful bearish surges.
The underlying logic exaggerates only the strongest deviations and ignores routine oscillation. These impulses often coincide with breakout thrusts, exhaustion spikes, sharp squeezes, or capitulation moves, places where the market briefly abandons its usual rhythm. They’re not a stand-alone trading system, but a visual cue that something unusually strong just happened in the stochastic structure.
⚪ Inefficiency Regime
The inefficiency engine monitors how orderly or distorted the combined price–stochastic behavior is. When the internal regime becomes noisy, spiky, or unbalanced, the script marks blue diamonds around the mid-region of the oscillator.
These diamonds tend to cluster when:
A previously clean trend starts to fragment,
A range becomes unstable and prone to fake breakouts,
Moves extend beyond what the recent structure would consider “normal.”
Used together with Significant Stochastic Moves, impulses, and divergence, these inefficiency markers help you distinguish between healthy follow-through and movement that is increasingly fragile.
⚪ Visual Multi-Timeframe Dashboard
On the right edge of the pane, a compact dashboard summarizes several key elements across 5M, 15M, 1H, 2H, 4H, and 1D:
Signals: immediate directional bias from the stochastic context,
OB/OS flags: stretched conditions by timeframe,
Divergence: where the structure disagrees with price,
Impulse: active momentum bursts,
Inefficiency: unstable or imbalanced regimes,
Explosive: high-energy conditions highlighted by Significant Stochastic Moves.
Think of it as a “stochastic climate map.” Instead of checking six separate charts, you get a quick snapshot of whether lower timeframes are in sync with the higher backdrop, or whether they are fighting each other. This is extremely helpful for multi-timeframe alignment and for deciding when to be aggressive versus when to stay defensive.
█ How to Use
⚪ Classic Stochastic Trading
Interpreting EP-Stochastic is similar to classic stochastic, but cleaner:
Sustained time above the midline signals a bullish rotational bias in the Efficient Price space.
Sustained time below the midline signals a bearish rotational bias.
When the oscillator repeatedly leans against the upper zone with a strong signal line, it indicates firm buyer control; when it leans against the lower zone with a soft or falling signal line, it indicates firm seller control.
When using “Close” as the EP Source, consider increasing the Efficiency Length to above 10 to produce more trend-like behavior.
⚪ Trend Trading
For trend trading, Trend mode is your core setting:
Use Trend mode with a moderate or slightly longer stochastic length.
Watch whether the oscillator lives mostly in the top or bottom half of its range.
Use the dashboard to see if higher timeframes show similar directional signals and OB/OS flags.
Impulse markers and Significant Stochastic Moves can be treated as continuation confirmations when they appear in the direction of the trend. Inefficiency diamonds and fading impulses act as early warnings that the current leg is losing coherence and may transition into consolidation or reversal. Inefficiency diamonds also signal imbalance in the market, where price can move quickly as the structure becomes unstable.
⚪ Pullback Trading
One useful workflow:
Run EP-Stochastic in Trend mode to define the dominant direction and regime.
Overlay a shorter, standard stochastic to spot pullbacks inside that regime.
When the EP-Stochastic clearly favors one side (mostly upper-half behavior in an up move, lower-half in a down move), wait for the short stochastic to cycle into its opposite extreme (oversold in an uptrend, overbought in a downtrend).
Entries during those counter-swings, especially when they coincide with impulse exhaustion in the opposite direction, often give cleaner, better-timed participation in the ongoing trend.
⚪ Overbought/Oversold Trading
Overbought zones represent strong buying pressure. When the stochastic becomes overbought, start watching for signs that buying pressure is fading.
If buying pressure continues, it typically indicates a strong bullish trend.
If the stochastic starts to decline and crosses back under the upper band, it can signal that buying pressure is weakening and a potential reversal is forming.
Oversold zones represent strong selling pressure. When the stochastic becomes oversold, start looking for signs that selling pressure is easing.
If selling pressure persists, it usually indicates a strong bearish trend.
If the stochastic begins to rise and crosses back above the lower band, it can signal that selling pressure is fading and a potential reversal is developing.
⚪ Mean-reversion Trading
Switch to Mean-reversion mode, increase the EP Source Length to 200, and reduce the Stochastic Length to 20 when you’re primarily focused on turning points and range rotation.
Look for clear spikes or peaks in the indicator, short-term bursts that quickly reverse. These moments often signal market conditions with a high likelihood of mean reversion, making a snapback in the opposite direction more likely.
⚪ Divergence Trading
When you want to focus on structural turning points rather than trend following:
Enable divergence detection.
Focus on divergences that form after extended moves or near the outer zones of the oscillator.
Bullish divergences emerging from deep lower regions can confirm early long ideas or justify scaling in as pressure transitions from aggressive selling to rotational buying. Bearish divergences out of extended upper regions can support profit-taking or exploratory short positions. The EP-Stochastic basis helps reduce “false” divergences that arise from random noise.
To get more divergence signals, consider switching to Mean-reversion mode and increasing the Efficiency Length to 20. Keep in mind that some divergences may appear “weird” or different from traditional divergence patterns—this is because they are based on Efficient Price, which uses a completely different detection engine in the background.
⚪ Breakout Trading
For breakout and breakdown scenarios, use:
Significant Stochastic Moves as evidence of a meaningful internal shift,
Impulse markers to confirm that the move is carried by strong momentum,
Inefficiency diamonds to recognize when the structure is becoming unstable.
When price breaks a level and the EP Stochastic prints a Significant Move in the direction of the break, backed by fresh impulses, it signals that the breakout is supported by internal strength.
⚪ Reversal Trading
Enable the reversal signals to identify potential turning points. Use them together with quick peaks in the stochastic oscillator. If the oscillator forms a peak and a reversal signal appears nearby, it strengthens the case for a reversal. However, if a reversal signal prints while the stochastic is simply leaning toward the upper or lower band without forming a clear peak, the signal carries less significance.
⚪ Interpreting Inefficiency Diamonds
Inefficiency diamonds highlight imbalance points in the market. When they appear, they signal that price and order flow are no longer in harmony, creating unstable conditions. These imbalance points often lead to sharp or sudden moves as the market snaps to correct the inefficiency.
Clusters of diamonds indicate a stronger imbalance and a higher likelihood of fast movement or abrupt shifts in direction.
⚪ Overview Panel
Use the multi-timeframe dashboard as a context checklist rather than a mechanical entry system. It quickly answers:
Are lower and higher timeframes pointing in the same direction?
Are multiple frames overbought or oversold at once?
Are impulses and inefficiency regimes showing up in isolation or in clusters?
█ How It Works
⚪ EP Source and Pre-EP Layer
The system begins by selecting an internal driver such as Close, Mean-reversion, or Trend. This source is evaluated through an efficiency model that measures how clean or noisy recent movement has been. Each increment is weighted by its structural quality and volatility conditions, producing a preliminary Efficient Price stream that favors meaningful directional progress over random chop.
Calculation: Applies efficiency weighting, volatility normalization, and adaptive length control. The output is a first-stage EP path that encodes directional reliability.
⚪ Main EP Engine and Adaptive Refinement
The preliminary EP stream is passed through a second refinement stage. This step smooths irregularities, boosts consistent movement, and remains sensitive to shifts in volatility regimes. The result is a fully refined Efficient Price path that forms the input for the EP-Stochastic rather than using raw highs and lows.
Calculation: Uses a second ER pass with volatility moderation and cumulative weighting. The output is the core Efficient Price trajectory used to build the EP-Stochastic.
⚪ EP-Stochastic Construction
Instead of calculating %K from raw price highs and lows, the oscillator is derived from where the refined Efficient Price sits within its own recent EP range. This keeps the stochastic familiar in shape but far more structurally coherent.
Calculation: Determines the EP range over the selected window, computes %K from EP’s position within that range, and applies optional smoothing for the signal line.
⚪ Inefficiency–Trend
This component evaluates the Efficient-Price-driven stochastic through two behavioral lenses: inefficiency and trend. Inefficiency highlights spike-driven, unstable, or imbalanced movement, while the trend component captures underlying slope, persistence, and regime strength. A smooth transition blends these two views depending on the system’s efficiency state.
Calculation: Computes an inefficiency score from ER deviation and a trend score from normalized regression slope. A smoothstep blend transitions between them, and diamond markers appear when the oscillator confirms it is operating inside an inefficiency regime.
⚪ Momentum Impulse
Momentum impulses isolate powerful rotations inside the EP-Stochastic. Only the sharpest acceleration bursts make it through, while routine oscillation is suppressed.
Calculation: Applies chained non-linear transforms to exaggerate extreme deviations, compares them to local historical envelopes, performs a cluster check to avoid false bursts, and marks impulses only when the deviation is structurally significant.
-----------------
Disclaimer
The content provided in my scripts, indicators, ideas, algorithms, and systems is for educational and informational purposes only. It does not constitute financial advice, investment recommendations, or a solicitation to buy or sell any financial instruments. I will not accept liability for any loss or damage, including without limitation any loss of profit, which may arise directly or indirectly from the use of or reliance on such information.
All investments involve risk, and the past performance of a security, industry, sector, market, financial product, trading strategy, backtest, or individual's trading does not guarantee future results or returns. Investors are fully responsible for any investment decisions they make. Such decisions should be based solely on an evaluation of their financial circumstances, investment objectives, risk tolerance, and liquidity needs.

Ace Pro Short Indicator - 1 Minute BTCUSD Bitcoin Chart The Ace Pro Short calculates overbought and oversold conditions.
It focuses on momentum to identify whether the market is overbought or oversold.
If it detects that the market is overbought, it gives an alert of “Short Entry”
If it detects that the market is oversold, it gives an alert of “Close Short”
Users are also able to set notifications on Tradingview with this version of the indicator.
To set an alert, after adding the indicator, at the top left of the chart where the indicator is listed, click on the "more" option (three dots), and then select "Add alert."
Please note the following:
The Ace Pro Short indicator is designed only for use on the 1 minute Bitstamp BTCUSD chart.
It is only to be used for opening and closing short positions.
It is not recommended for use with long positions.
It is not recommended for use with time frames other than the 1 minute.
In a sideways market, or during a violent move, it is likely to produce false signals.
Traders must use confluence from their technical analysis to enter trades.
Because this is an invite only script, users with a free Tradingview account will not be able to obtain access.
Traders must use confluence from their technical analysis to enter trades.

[astropark] Crypto Swing Trading [alarms]Dear Followers,
today a Swing Trading Strategy , runnable on a bot , which works great from 30m timeframe and above. Best suggested timeframes are 1h and 4h.
If you are a scalper, you will love suggested entries for fast profit. You can run it from 1 minute timeframe if you are used to scalp trading and close each trade whenever you fell happy (a proper trailing stop strategy is suggested anyway).
This indicator can trigger till 5 or 20 buy or sell signals in a row before reverting (it changes greatly depending on timeframe you use), so use a proper money management .
This script will let you set alarms whenever a Buy or a Sell signal is drawn on chart. This way you can set all notifications you may need in order to be alerted on each triggered signal.
The backtesting-strategy version of this script can be found here below or by searching for "Crypto Swing Trading" and then choosing the "strategy" version.
Strategy results are calculated on the timeframe from January 2018 to now, so on about 2 years, using 10000$ as initial capital and working at 3x leverage (very safe leverage!).
This is not the "Holy Grail", so use a proper risk management strategy.
This is a premium indicator , so send me a private message in order to get access to this script.

DK-Invest-Multi-Indicator-Background Color Signals-Testing OnlyThis is currently categorized as an "Invite Only" script and is being tested by a small number of users in the community. The goal is to release to the general community in the near future. The script will likely remain protected due to the amount of time invested in its development. This may change at some point in the future!
This script is unique in that it not only combines multiple indicators and multiple resolutions into a single view, but the source data is not derived directly from price. Rather it is built on a weighted point scale utilizing SMA trends and crosses spanning multiple resolutions. This point scale provides a slightly different and more predictive approach than typical indicators that are reacting to price changes.
Can be viewed with reliable buy/sell signals on any resolution from 5s to 480m. It depends only on preference and whether the goals are short-term or long-term trading.
<<< Please make sure to review Trading View's documentation regarding the use of alerts on scripts that span multiple resolutions. A reminder/warning will be generated for each new/updated alert because of this. Note: As TV explains, it's not a bug, it's just the nature of the beast when dealing with indicators that combine multiple resolutions onto a single chart. >>>
I will be adding some images of the backtesting results shortly. The script is showing some extremely good ROIs. Want to get through another round of QA testing prior to releasing results. Stay tuned.
An Alt coin version will also be added soon. BTC is a bit unique in its volume and timing of buy/sell signals, which is why there is a separate script for now.
Thank you for your understanding. Questions please add a comment. Still getting use to checking for comments, so apologies if there is a delay in responding!
DK Investments (just me right now :->)

Leledc Exhaustion Bar V4 PLUSLeledc Exhaustion Bar indicator created by glaz converted to Pine 4, plotshape was added.

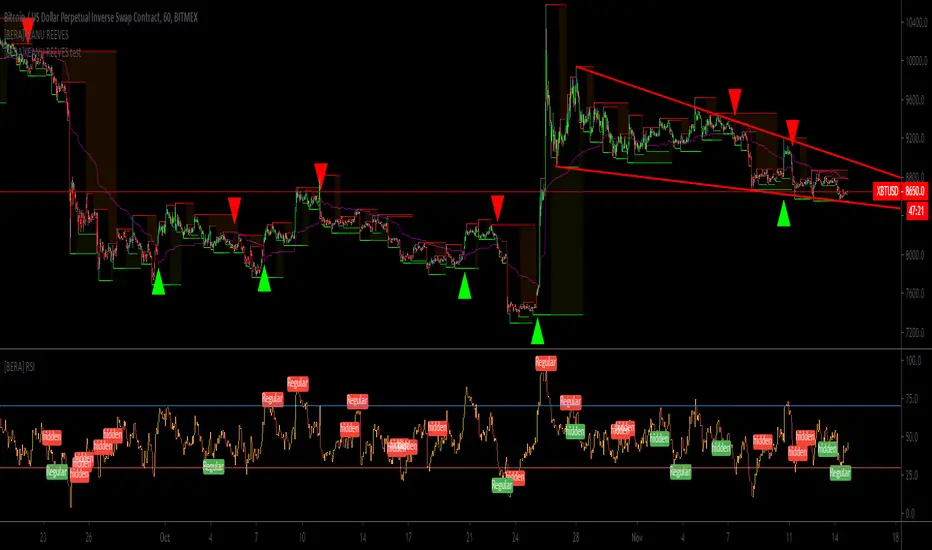
[BERA]KEANU REEVESThis is BUY/SELL indicator integrated with support and resistance (HIGH AND LOW).
THIS IS ONLY FOR TESTING PURPOSES(SOME PEOPLE ASKED ME A TRY), I WILL REMOVE IT.
Indicator based on Average true range .
LIME ARROW = LONG
RED ARROW = SHORT
LIME COLOR BARS IF GREEN ARROW CONDITION VALID.
RED COLOR BARS IF RED ARROW CONDITION VALID.
>CURRENT SETUP OF METRICS IS IDEAL FOR BTC H1 CHART, FOR ALTCOINS YOU SHOULD USE DIFFERENT METRICS,
MACDTraderPro for BTC with LONG & SHORT AlertsMostly based on MACD analysis this trend indicator accurately shows you when main trend changes.
It has LONG and SHORT labels and you can use it with tradingview alerts to be in touch and for automated trading bots.
You can use it both with margin(bitmex, bitfinex, etc) and main exchanges (binance and more) with bitcoin for now and soon for alts also.

Mr. Pips SuperTrend Power PipperMr. Pips is proud to bring his Proprietary Price Action Trading Indicator to the masses. This easy to use script works on all time frames and all stocks, commodities, indices, etc.... Mr. Pips has developed this indicator to help the most novice trader achieve returns. Buy when the trendline turns green and move your trailing stop-loss up as the price goes up. Conversely, Short when the trendline turns red and move your trailing stop-loss down as the price moves down. It's that simple. When the price repeatedly re-tests the trendline, whether it be support or resistance, this is another good place to open a position. This script works on all time-frames. You can use it to scalp small pips when volatility is low, and it is recommended to use this script on higher time-frames(60-240min) when volatility is high. Mr. Pips hopes you're having a profitable Day!!!
Mr. Pips' quote of the day:
"Pippin ain't dead it just moved to the web!"
RIP Pimp C

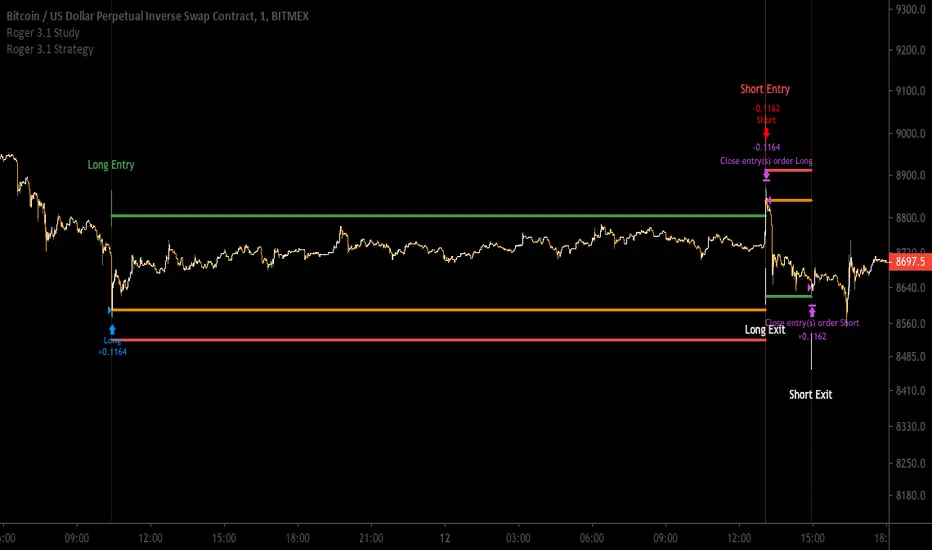
[Aill3urs V.1.1.P] Study RogerThis INVIT-ONLY study is based on Noise / Fixe TP & SL / EMA and you can optimize it with trends and work on low timeframe < 5min
Please use comment section for any feedback.
For any question DM me for any request.
## DISCLAIMER
1. I am not licensed financial advisors or broker dealers. I do not tell you when or what to buy or sell. I developed this software which enables you execute manual or automated trades multiple trades using TradingView. The software allows you to set the criteria you want for entering and exiting trades.
2. Do not trade with money you cannot afford to lose.
3. I do not guarantee consistent profits or that anyone can make money with no effort. And I am not selling the holy grail.
4. Every system can have winning and losing streaks.
5. Money management plays a large role in the results of your trading. For example: lot size, account size, broker leverage, and broker margin call rules all have an effect on results. Also, your Take Profit and Stop Loss settings for individual pair trades and for overall account equity have a major impact on results. If you are new to trading and do not understand these items, then I recommend you seek education materials to further your knowledge.
**YOU NEED TO FIND AND USE THE TRADING SYSTEM THAT WORKS BEST FOR YOU AND YOUR TRADING TOLERANCE.**
**I HAVE PROVIDED NOTHING MORE THAN A TOOL WITH OPTIONS FOR YOU TO TRADE WITH THIS PROGRAM ON TRADINGVIEW.**
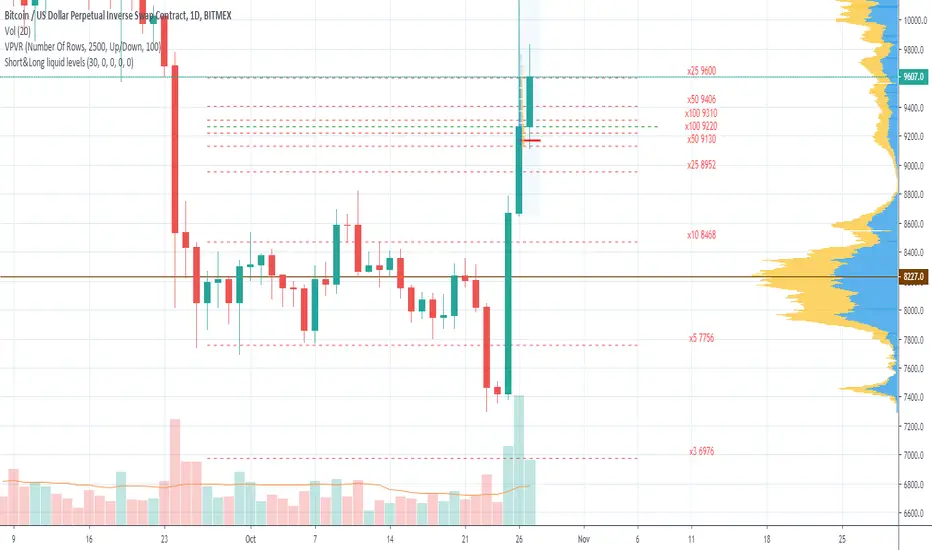
Short&Long liquid levels (XBT & ETH)Shows liquidation levels of marginal LONG and SHORT positions on BITMEX for XBTUSD and ETHUSD pairs.
Levels are calculated from the basis price, which you can change manually. The best choice is using the Volume Profile indicator in conjunction, so you can take POC for the basis price. As well, you can use significant horizontal levels or a middle line of a price channel. In order to prevent chart collapse, last candle open price is used by default.
Indicator presents x100, x50, x25, x10, x5, x3, x2 levels for XBTUSD and x50, x35, x25, x20, x10, x5, x3 for ETHUSD. Each level is marked with labels by default, and you can turn the labels off in the styles menu.
The indicator is only visible on XBTUSD, BTCUSD, BTCUSDT, ETHUSD, ETHUSDT pairs.
You can turn on/off Short or Long liquidation levels.
The basis price is the same for Longs and shorts by default, specify separate price for short if you need.
If you have any advice to improve the indicator or if you find any mistake, please leave your feedback.
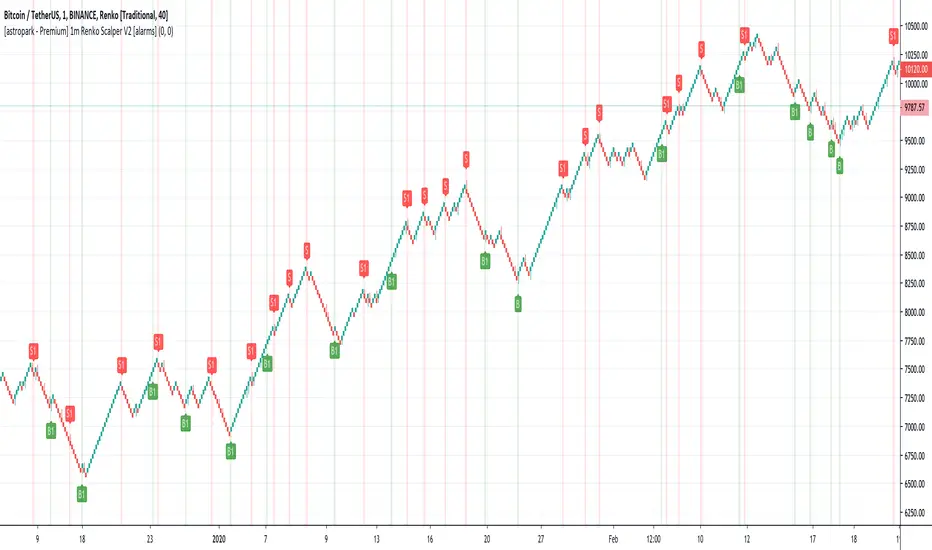
[astropark - Premium] 1m Renko Scalper V2 [alarms]Dear Followers,
today a new Scalper Tool , which works great on 1 minute timeframe , which is the best and more secure timeframe to use on a Renko chart, besides it works great up to 15m (I don't suggest to use a renko chart over 15m timeframe)!
It is an upgraded version of Bitmex Renko Scalper that you can find in my tradingview script page.
This tool has some cool features:
it works on 1 minute timeframe : so you can enjoy high-frequency trading by using a 24/7 running bot;
wait bricks optional mode : you may like to make script wait for triggering a new signal by waiting 1 or 2 more confirmation bricks
trailing stop : you can set a trailing stop in trade, so script will alert you if it will be reached in chart
This strategy can trigger till 5 buy or 5 sell signals in a row before reverting, so use a proper money management .
Strategy results are calculated on the timeframe from july to now, so on about 4 months, using 10000$ as initial capital and working at 3x leverage (very safe leverage!).
The user who wants to use this strategy, especially via an automated bot, must always set a stoploss at 5% from entry point or use a proper risk management strategy .
This is not the "Holy Grail", so use it with caution.
This script will let you set all notifications you may need in order to be alerted on each triggered signals.
The backtesting script version of this indicator, which will let you backtest this script and find best settings for your preferred market, can be found here below:
On Bitmex XBTUSD chart best settings is Traditional Renko chart with 10$ box size.
This is a premium indicator , so send me a private message in order to get access to this script .
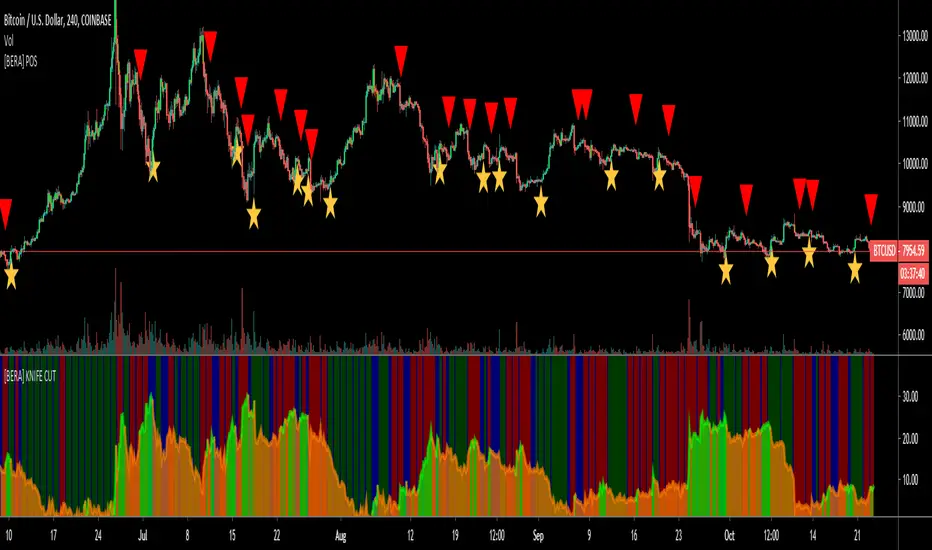
[BERA] PILE OF SIGNALSHey bulas and beras, another indicator for help your decision.
Ok lets start.
PILE OF SIGNAL, i admit the last word of the title was a bad word and changed to avoid permaban ok lol ahah.
Description= this indicator use moving averages crosses and volume as decision point, what mean this? simple when a move is coming this indicator will show you the probable "direction" of next move. these signals are not buy and sell, also because multiple signals can occour, you should use it with you own TA.
-Moving Averages
-Crosses
-Volume
RED ARROW ABOVE BAR= PROBABILITY OF DOWN MOVE INCOMING
STARS BELOW BAR= PROBABILITY OF UP MOVE INCOMING
Simple.
[astropark] Super RSI [alarms]Dear Followers,
today a new Scalper Tool , which works great on 3 minutes and 5 minutes timeframes , but also down to 1m and up to 30m!
I called it " Super RSI ", as it is based on RSI and inherits some basic functionality from it.
If you check its settings, you will see that you can have 3 different buy-sell sources (first two are active by default):
STRONG BUY/SELL : buy when white area deeply falls into oversold-red zone and sell when white area gets into overbought-green zone (you can set and edit at which level oversold and overbought zones start);
CROSSES : buy when the black RSI line in the middle between red and green area cross under the buy cross limit value and sell when it crosso over the sell cross limit value (you can set and edit specific cross ranges for both buy and sell);
WEAK BUY/SELL : buy when green area at least go below 50 level and sell when red area at least goes above 50 level (you can edit both levels); these conditions are highlighted as background color and are very useful for taking (at least partial) profits in trades.
By default the script will be placed as overlay on the chart, but
> you can activate the oscillator plot by disabling the "hide all plot" option
> and place it in a below pane by clicking on the black arrow at then end on the indicator name in chart and selecting "move to -> a new pane below"
This strategy can trigger till 10 buy or 10 sell signals in a row before reverting, so use a proper money management .
Strategy results are calculated on 20 trading days using 1000$ as initial capital and working at 10x leverage.
The user who wants to use this strategy, especially via an automated bot, must always set a stoploss at 3-5% from entry point or use a proper risk management strategy .
This is not the "Holy Grail", so use it with caution.
This script will let you set all notifications you may need in order to be alerted on each triggered signals.
The backtesting script version of this indicator, which will let you backtest this script and find best settings for your preferred market, can be found here below:
This is a premium indicator , so send me a private message in order to get access to this script .
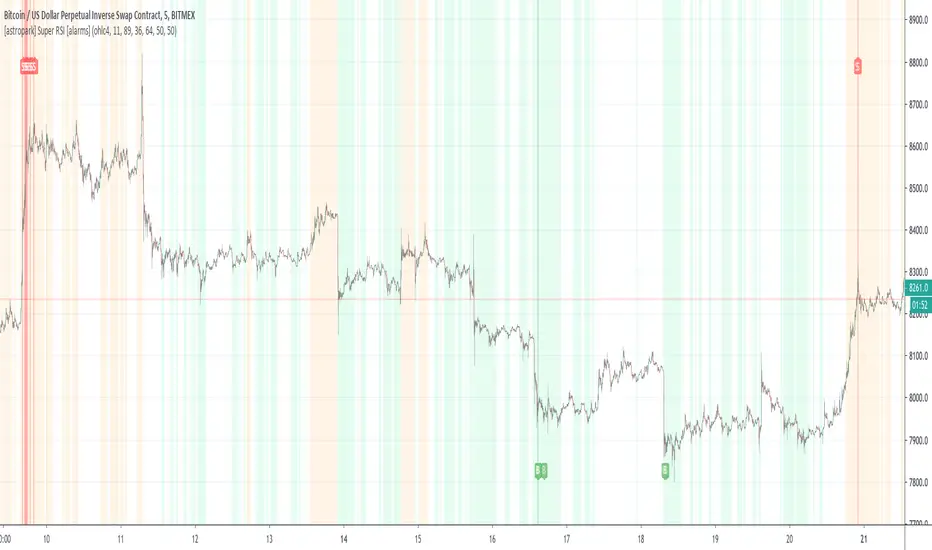
[astropark] Super Stochastic RSI [alarms]Dear Followers,
today a new Scalper Tool , which works great on 3 minutes and 5 minutes timeframes !
I called it " Super Stochastic RSI ", as it is based on StochRSI and inherits some basic functionality from it.
If you check its settings, you will see that you can have 3 different buy-sell sources (first two are active by default):
STRONG BUY/SELL : buy when green area deeply falls into oversold zone and sell when red area gets into overbought zone (you can set and edit at which level oversold and overbought zones start);
K/D CROSSES : buy when k-line cross above d-line and sell viceversa (you can set and edit specific cross ranges for both buy and sell);
WEAK BUY/SELL : buy when green area at least go below 50 level and sell when red area at least goes above 50 level (you can edit both levels); these conditions are highlighted as background color and are very useful for taking (at least partial) profits in trades.
By default the script will be placed as overlay on the chart, but
> you can activate the oscillator plot by disabling the "hide all plot" option
> and place it in a below pane by clicking on the black arrow at then end on the indicator name in chart and selecting "move to -> a new pane below"
This strategy can trigger till 10 buy or 10 sell signals in a row before reverting, so use a proper money management .
Strategy results are calculated on 20 trading days using 1000$ as initial capital and working at 10x leverage.
The user who wants to use this strategy, especially via an automated bot, must always set a stoploss at 3-5% from entry point or use a proper risk management strategy .
This is not the "Holy Grail", so use it with caution.
This script will let you set all notifications you may need in order to be alerted on each triggered signals.
The backtesting script version of this indicator, which will let you backtest this script and find best settings for your preferred market, can be found here below:
This is a premium indicator , so send me a private message in order to get access to this script .

JooNim_LS/AlertsXBTUSD _ BITMEX
SMA와 TSI를 사용해서 만든 지표입니다.
An indicator created using SMA and TSI.
비트코인 차트 15분봉 / 30분봉 / 1시간봉 / 4시간봉에서 주로 사용이 됩니다.
This use bitcoin chart in 15M / 30M / 1H / 4H
제가 설정한 2개의 값이 서로 크로스 해서 발생하게 되는 값입니다.
The two values that I set are crossed into each other.
L = 롱을 매수하는 시그널 입니다.
L = Long Signal
S = 숏을 매수하는 시그널 입니다.
S = Short Signal
반대 포지션이 뜨게되면 스위칭 및 손절을 하면 됩니다.
If the opposite position is raised, you can switch and lose.
얼러트기능을 추가하였습니다.
얼러트는 봉마감을 기준으로 설정하시면 됩니다.
You have added the Alerts feature.
You can set the Alerts based on the closing date.
언제든지 댓글을 달아주시기 바랍니다.
Please leave comments anytime.
신청하시는분 누구든지 승인해드리겠습니다.
I'll approve it to anyone who applies.
댓글이 안달리시는 분들은 저에게 메세지를 보내주십시오.
If you don't have any comments, please send me a message.
또한, 새로운 아이디어나 추가됐으면 하는 아이디어가 있다면 메세지나 댓글 주셔도 좋습니다.
Also, if you have a new idea or idea that you want to add, you can send a message or comment.

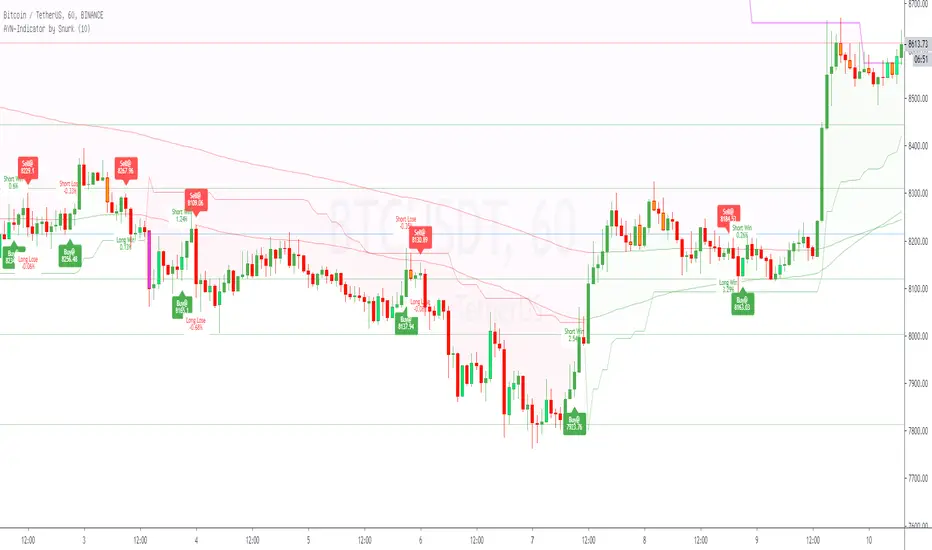
AYN: Buy-, Sell-, Trend- and SwingSignals incl. AutoFibo
Hi,
i want to introduce you to my AllYouNeed-Indicator. I calculate the buy sell signals within different timeframes independent in wich timeframe you are, therefore Pinescript suppose the Signal could be repainted. I was not able to fix this error, but after frequent checks of the result i haven't found a single repaint. Please try it out and let me know me, if you still get caught by a repaint.
Features:
- Short, Mid and Longterm-Trends
- Buy and Sell Signals and Results as well with Labels (Prices, Percentage, Win/Lose)
- Length Multiplier for different Marketsituations
- Trend-Signals with Barcolors (Lime=Uptrend, Fuchsia=Downtrend)
- Swing-Signals with Barcolors (Lime=Upswing, Orange=Downswing)
- Auto-Fibonacci with changing Linecolors as Support(green) / Resistance(red)
Hope you like it, feel free to contact me for further informations.
Please leave a comment on what I can do better, thanks.
Best regards,
snurk
[BERA] SUper BOSSHey beras and bulas, this is another gift for you! work in sync with KNIFE CUT script
Please message me if you like my indicators. Thanks you.
This indicator work in sync with KNIFE CUT, check it.
SUper BOSS
Is a special indicator with 2 metrics you can use for be a better trade and stop losing money entering useless positions.
using also KNIFE CUT you will get up to 4 parameters you can compare, for enter only good trades.
This indicator can:
Supports and resistances area as point of reference.
OverBought, Oversold candles
Green line is a LONG, Red line is a SHORT.
4H example, work with all timeframes also for excellent 15m scalping.
SEE? many opportunities.
Tried this with 15m timeframe trading ALGO MOON or DOOM and the result is incredible.
With SUper BOSS and KNIFE CUT, you will earn money in any timeframe!
I may find 15 trades a day with this system.
See price history.
You not believe? i believe.

[BERA] KNIFE CUT
Hey beras and bulas, this is my gift for you!
Please message me after you tried my indicators.
This indicator work in sync with SUper BOSS or SB , check it.
KNIFE CUT
Is a special indicator with 2 metrics you can use for be a better trade and stop losing money entering useless positions.
This indicator can:
The Area in the center measure "Market cycles" check below, and "BUY PRESSURE", check the reaction with the price action, impressive? i know.
About the bars green or red, are trend bars, compare it to the price action and you can see that these bars catched all uptrends and downtrends.
(you can change also resolutions of background bars, current H4 resolution if you watch lower timeframes.)
*BUY PRESSURE / TREND BACKGROUND BARS
*MARKET CYCLES
This script work with every exchange and pairs, also forex.
See price history.
You not believe? i believe.

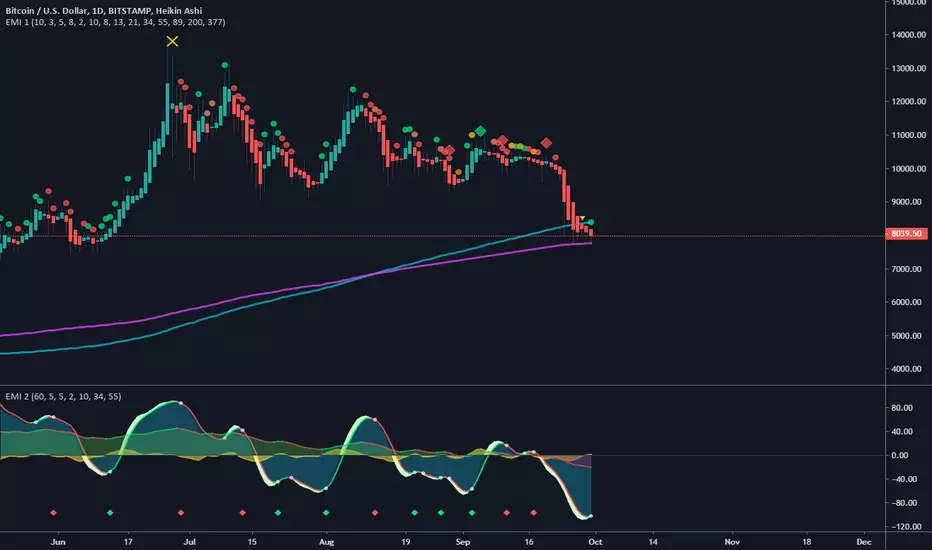
(EMI 1) Epic Market Indicator v2.2Had to release a new version, due to house rules.
This indicator is usable for every market and I do suggest to use it in combination with EMI 2.
Green = buy/long, Red = sell/short
Orange = Price action divergence/convergence.
Yellow X = Manipulation, you might to be careful when you see this, most of the time dumps happens afterwards.
Always wait for the candle/bar to close and if possible wait for another confirmation. No confirmation most of the time means, trend continuation.
Diamonds are the strongest signal, you might want to to buy/long or sell/short when you see this signals.
Cirles/Dots are trend continuation, shows which way the trend. More of the same color in a row the stronger the prediction. But once you see an orange colored signal then it's possibly going to diverge.
Longer the term/period the more accurate prediction signals will be.
You can enable/disable other tools in the settings:
EMA's, SMA , Bollinger Bands and Pivots .
But also trend colors
Setup your own configurations the way you like. I recommend using Fibonacci seq . Keep in mind, sooner the prediction signals become the more riskier.
update:
- Added bollinger bands with trend color. You can disable or enable this in the settings.
- Modified manipulation conditions.
- Modified buy and sell conditions.
MS MONEY CCI SQUEEZEAbout
I have used this indicator to find many lucrative opportunities. This indicator takes the moving average of CCI in custom, volatility-specific conditions. CCI measures "overbought" in the red-shaded region and "Oversold" in the green-shaded region. The shaded regions do not constitute a buy/sell signal alone, the MS CCI Squeeze is best used when market conditions agree and is best used when the user has fundamental reasoning for "reversal-like" situations to align. The MS CCI Squeeze will soon have a synergistic partner called "MS RSI Squeeze" indicator that will look similar to help better measure volatility and strength trend.
About the Commodity Channel Index (CCI)
The commodity channel index (CCI) is an oscillator originally introduced by Donald Lambert in 1980. Since its introduction, the indicator has grown in popularity and is now a very common tool for traders in identifying cyclical trends not only in commodities, but also equities (stocks) and currency trading.
How to set an Alert
If the user wants to set an alert , click on one of the support/ resistance lines (black-dashed) near the zero mark. Clicking on the horizontal line above or below the zero line will populate a yellow arrow which will allow you to set alerts when wanted.
Please Read For Better Efficiency
When using this indicator, keep an eye out for harmonic patterns, both bullish and bearish head and shoulders patterns for "HIDDEN" breakout opportunities.
Please like, follow and share and I will continue building better indicators.

[astropark] Long-Short Strategy V2 [alarms]This indicator is not an holy grail, but it is an amazing trend finder and works nicely between 30m and 4h timeframes :)))
This is a modified version of the following strategy:
After the great success of V2, as a lot of people around asked me about, I decided to publish a new version which will let you set alarms on Buy and Sell , so each time a signal is triggered you will be notified accordingly and FAST!
HOW TO USE THIS INDICATOR
Buy/Long at next candle's open price when you see a green "B" label on the chart , trying to buy as low as possible near or below the green cloud, considering it as moving support for more buys/longs. The bigger the cloud, the stronger the bull-trend and so the stronger the support.
Sell/Short at next candle's open price when you see a red "S" label on the screen , trying to sell as high as possible near or over the red cloud, considering it as moving resistance for more sells/shorts. The bigger the cloud, the stronger the bear-trend and so the stronger the resistance.
Keep in mind that the lower the timeframe you work on, the easier is the trend to change rapidly, so always set a -2% / -5% stop-loss on trades and follow the trend with a good trailing stop strategy . If you need help, just send me a direct message.
This is not a free indicator, so send me a private message in order to get access to this script .
Do you like my scripts? Offer me a coffee, a beer, a pizza or whatever :)
BTC jar: 1K5kuYQPEqoNo6GRmJbHWMPmqwKM5S3oRR
ETH jar: 0x091b541a6dd6fe08c4e7bd909baafb2fce9b975e
LTC jar: LSVoAChsZrVsvbNyUfdpxtFpDAUSaUTUig
XRP jar: (XRP deposit tag) 103997763 (XRP deposit address) rEb8TK3gBgk5auZkwc6sHnwrGVJH8DuaLh
PS: Do you need a customization or do you need a dev who implements your strategy? send me a private message ;-)
