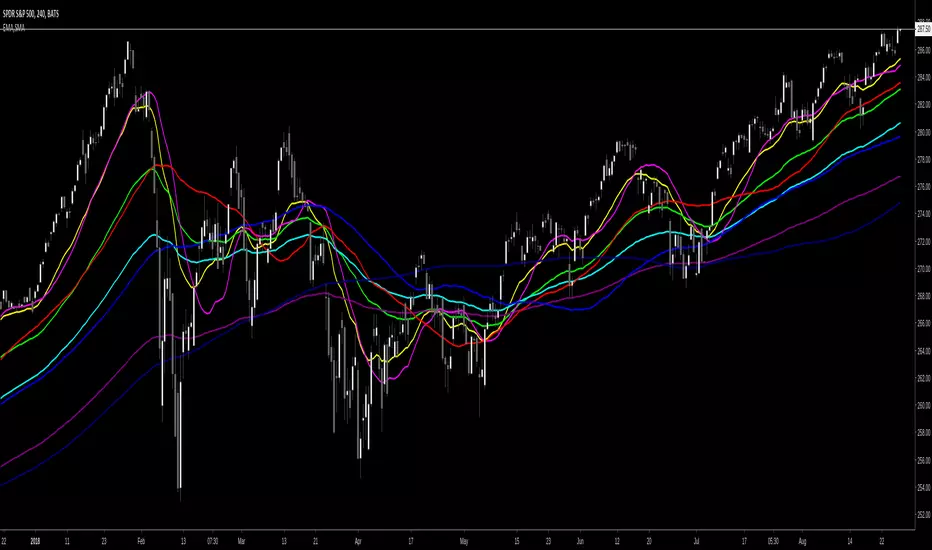
Sma

Multi SMA EMA WMA HMA BB (5+5 MAs + Bollinger Bands) MTF by RRBMulti SMA EMA WMA HMA BB (5+5 Moving Averages of Any Type with Bollinger Bands) MTF by RagingRocketBull 2018
Version 1.0
This indicator shows multiple MAs of any type (SMA EMA WMA HMA etc) with BB and MTF support
There are several versions: Simple, MTF, Pro MTF and Ultimate MTF. This is the MTF version. The Differences are listed below. All versions have BB
- Simple: you have 2 groups of MAs that can be assigned any type (5+5)
- MTF: +assign 1 custom Timeframe to any group combo (5+5 Custom TF)
- Pro MTF: +multiple Timeframes for multiple MA groups (4*3 MTF), horizontal levels and show max bars back options
- Ultimate MTF: +individual settings for each MA, multiple Timeframes
There are 2 groups of MAs, 3rd group is BB. You can:
- show/hide all MAs in a group. Use length 0 to hide a particular MA independently or uncheck in Style.
- apply any MA type to all MAs in a particular MA group. For example, you can assign all EMAs the HMA type. Groups are called EMAs and SMAs just for reference.
- assign Custom Timeframe to a particular MA/BB group combination or all groups. For example, show daily (D) EMAs+SMAs on H1 Timeframe, or only H4 (240) BB on H1.
You can use different types of MAs as dynamic S/R levels to trade of off and MA crosses as signals for possible trend change (golden/death bull/bear crosses).
Current Timeframe MAs can be used together with Custom Timeframe MAs on a single chart. Higher TF MAs are more important than lower TF MAs.
Most common MA types are: SMA, EMA, WMA, HMA.
Most common MA lengths are: 12, 20, 26, 30, 50, 100, 200, 400 etc.
MTF Notes:
- Script UI uses simple timeframe textbox instead of input resolution dropdown to allow for 240 120 and other custom TFs
- Groups that are not assigned a Custom TF will use Current Timeframe (0).
- MTF will work for any MA type assigned to the group. BB group always uses SMA type.
- MTF works both ways: you can display a higher TF MA/BB on a lower TF or a lower TF MA/BB on a higher TF.
- MTF MA values are normally aligned at the boundary of their native timeframe. This produces stair stepping when a higher TF MA is viewed on a lower TF.
Therefore Point Density/Smoothing is applied by default on MA MTF for visual aesthetics. Set to 0 to disable and see exact ma mtf values (lines with stair stepping and original mtf alignment).
- Smoothing is disabled for BB MTF because fill doesn't work with smoothed MAs after duplicate values are replaced with na.
- MTF MA Value fluctuation is possible on the current bar due to default security lookahead
Features:
- 2 groups of custom 5+5 MAs of any type including Hull Moving Average (HMA)
- BB
- 1x Custom Timeframe with step line smoothing for 3 groups (MAs + BB)
1. based on 3EmaBB, uses plot, fill, security, change, barstate, stdev and custom hma functions
2. you can't set certain constants from input due to Pinescript limitations - change the code as needed, recompile and use as a private script version
3. you can't have plot* inside ?/if/for/function, and implementing condition forks using 2 sets of plots (na vs non-na) doubles indicator params and styles - confusing
4. swma has a fixed length = 4, alma and linreg have additional offset and smoothing params
Feel free to use. Good Luck!

Multi SMA EMA WMA HMA BB (5+5 MAs + Bollinger Bands) by RRB
Multi SMA EMA WMA HMA BB (5+5 Moving Averages of Any Type with Bollinger Bands) by RagingRocketBull 2018
Version 1.0
This indicator shows multiple MAs of any type (SMA EMA WMA HMA etc) with BB on a chart at the same time with/without MTF support depending on the version.
There are several versions (published later): Simple, MTF, Pro MTF and Ultimate MTF. This is the Simple version. The Differences are listed below. All versions have BB
- Simple: you have 2 groups of MAs that can be assigned any type (5+5)
- MTF: +assign 1 custom Timeframe to any group combo (5+5 Custom TF)
- Pro MTF: +multiple Timeframes for multiple MA groups (4*3 MTF), horizontal levels and show max bars back options
- Ultimate MTF: +individual settings for each MA, multiple Timeframes
You can use different types of MAs as dynamic S/R levels to trade of off and MA crosses as signals for possible trend change (golden/death bull/bear crosses).
Most common MA types are: SMA, EMA, WMA, HMA.
Most common MA lengths are: 12, 20, 26, 30, 50, 100, 200, 400 etc.
Features:
- 2 groups of custom 5+5 MAs of any type including Hull Moving Average (HMA)
- BB
1. based on 3EmaBB, uses plot, fill, stdev and custom hma functions
2. swma has a fixed length = 4, alma and linreg have additional offset and smoothing params
Feel free to use. Good Luck!

Moving Average Percent Difference by KIVANC fr3762Percent Difference between varios moving averages like sma , ema , wma , vwma and Hull MA and price to measure volatility and indicate crosses better.
1=SMA, 2=EMA, 3=WMA, 4=VWMA, 5=HullMA
Moving average type can be selected from the settings of the indicator.
the default value for the length of the moving averages taken as 50.
Author: KıvanÇ @fr3762 on twitter (tweets are only in TURKISH)
MAPD Fiyat ve çeşitli hareketli ortalamalar arası yüzde değeri hesaplamakta kullanılır.
indikatörle fiyatın kesişimlerini daha yi görmek ve bir çeşit volatilite ölçümü için de kullanılır.
Hareketli ortalamalar için varsayılan değer 50 bar olarak seçilmiştir/değiştirilebilir.
1=SMA, 2=EMA, 3=WMA, 4=VWMA, 5=HullMA olarak seçilebilir
İndikatörü geliştiren: Tim Tillson

Philakone 4EMAs + 3MAs (200+100+50)Hi guys ^^
This script combine all Philakone EMAs plus i added death and golden cross MAs which is ( 200 MA + 50 MA ) plus 100 MA
You can fully customize all moving averages MA EMA show or hide or change color or thickness and ofc 0.79% play with source code :)
BTC tip :
3BMEXA9mJMhMBJR9MR3t7othh7BijxUNW7
Thanks ^^


Multiple Moving Averages [clean]Very simple indicator script to display multiple simple moving averages. I know others have made this but they often are too feature-rich and can get cluttered.
Can optionally show a cross when MA 1 crosses MA 3. These are colors such that when MA 1 crosses BELOW MA 3 a red cross is shown, and green when crossing above.

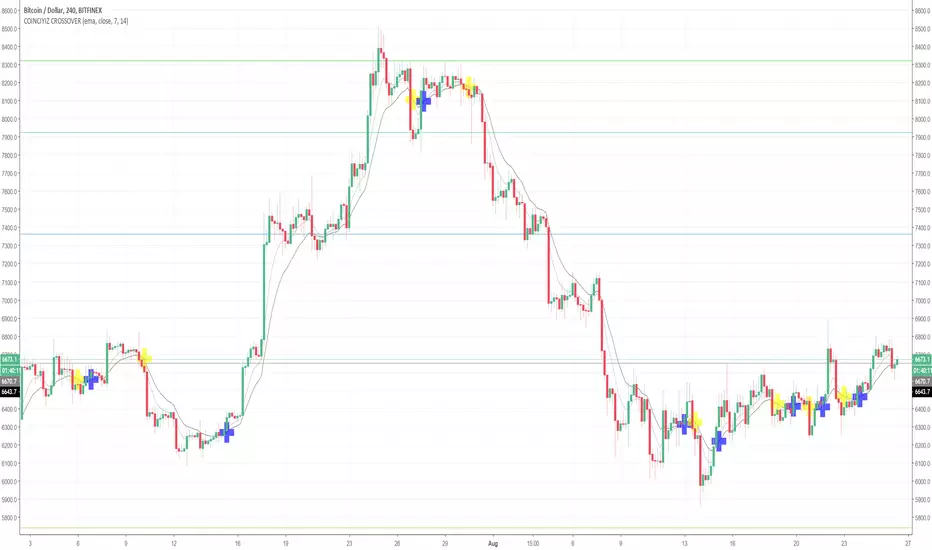
COINCIYIZ CROSSOVER 1.1A crossover is used by a technical analyst to forecast how a stock will perform in the near future. For most models, the crossover signals that it’s time to either buy or sell the underlying asset. Investors use crossovers along with other indicators to track things like turning points, price trends and money flow.
Crossovers indicating a moving average are generally the cause of breakouts and breakdowns. Moving averages can determine a change in the price trend based on the crossover. For example, a technique for trend reversal is using a five-period simple moving average along with a 9/21-period simple moving average. A crossover between the two will signal a reversal in trend, or a breakout or breakdown.
A breakout would be indicated by the five-period moving average crossing up through the 21-period. This is also indicative of an uptrend, which is made of higher highs and lows. A breakdown would be indicated by the five-period moving average crossing down through the 9/21-period. This is also indicative of a downtrend, composed of lower highs and lows.
Longer time frames result in stronger signals. For example, a daily chart carries more weight than a one-minute chart. Conversely, the shorter time frames give earlier indicators, but they are also susceptible to false signals as well.
(R: investopedia)
Short signal - Yellow
Long signal - Blue
Moving Average x6 Strategy
Strategy 1 : EMA 13-48
Strategy 2 : SMA 50-200
Strategy 3 : SMA 100-200
Strategy 4 : SMA 9-13-21-55
Strategy 5 : SMA 21-50-200/EMA 144
Strategy 6 : SMA 50-100-200/EMA 144
Unlimited Color Combination
Unusual Strategies to Win


Torasko SMASimple Moving Averages for both momentum (21, 50 day), as well as mid- and long term support/resistance (100, 200 day).

PPO spreadScript requested by @sergebtpepper7, hope it will serve someone else :)
You can use it and modify it by your needs.

(JS) Ultimate Multi Time Frame Moving AveragesSick of having to pull up tons of charts to check the moving averages on various time frames? Me too, so I decided to make the "Ultimate Multi Time Frame Moving Averages" overlay.
So what's it do? Simple. It allows you to plot moving averages from other time frames on your current chart. There's a bunch of built in MA's, and I also added space for two custom SMAs and three custom EMAs.
The custom moving averages can be set to any length or time frame that you desire.
The ones that come built in include:
5 Day SMA
10 Day SMA
20 Day SMA
50 Day SMA
100 Day SMA
200 Day SMA
5 Week SMA
10 Week SMA
20 Week SMA
50 Week SMA
100 Week SMA
200 Week SMA
Now you can simply check or un-check any of the following to see where these MAs fall on your current chart, no more flipping back and forth! Enjoy!


2xIchimoku Cloud + 4xMA + Williams FractalUpdated version of the previously published multi-indicator which includes
4x Moving Averages
2x Ichimoku Clouds
Bill Williams Fractals
Changes:
-Toggle switches for each indicator on input tab for easy on/off
-MA Type Selector (EMA/SMA/WMA/VWMA)
-Various default style change
Many thanks to both redwraith and jedireza for helping me work out the MA section
www.tradingview.com
www.tradingview.com
Next improvements: Ichimoku settings

Seven Moving AvveragesThis is a simple yet very flexible moving average script. There are more than few moving average scripts out there but non of them are as flexible as this one.
This script lets you have seven different moving averages. Each moving average can be set separately, each can :
1- switch the moving average between EMA and SMA
2- set the flat percentage, this setting will be used to determine where we don't have trend in that moving average to set the color to black (default)
3- set the source
You can easily set the colors in the style tab.
This script was developed by request of few of my friends.

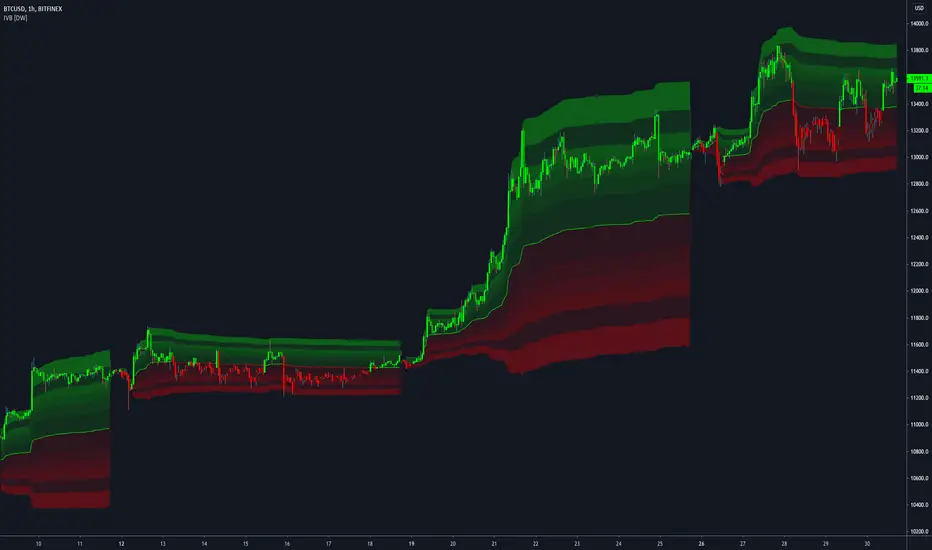
Interval Volatility Bands [DW]This is an experimental study that utilizes Volume Weighted Average Price or Time Weighted Average Price calculations, Bollinger Bands, and Fibonacci numbers to estimate volatility over a specified interval.
First, the basis is calculated by selecting:
-VWAP, which has the option to be calculated using real volume or tick volume
-TWAP, which has the option to be calculated using the standard method or exponential method
Next, standard deviation from the basis is calculated and multiplied by a specified expansion coefficient. The result is then added to and subtracted from the basis to calculate the high and low bands.
There are three band calculation methods to chosse from in this script:
-Standard, which uses the default calculations
-Average, which takes a cumulative average of standard deviation
-Hybrid, which takes the maximum of the standard and average standard deviation methods
Lastly, the high and low band ranges are multiplied by Fibonacci Percentages 23.6 - 78.6.
A custom color scheme with eight default presets to choose from is included.
Multiple Moving Averages using only 1 indicator! (configurable)Simple modification to an existing script that allows for configurable MA lookback-lengths


Triple Power Moving Average v.02 by @Nico.MuselleALL THE POWER OF MULTIPLE MOVING AVERAGES ---- NOW COMPLETELY FOR FREE
Did you ever want to apply the Daily Moving Averages to an hourly chart ?
Are you tired of switching between time frames for seeing where that moving average is on the higher time frame ?
Do you want to display these moving averages on your current time frame ?
NOW YOU CAN !
In comes the Power Moving Average which offers you the opportunity to :
Display moving averages of any (higher) time frame you wish
In this version we added 4 hour, 6 hour, 8 hour and 12 hour selection for your moving averages
Select which type of Moving Average you want to display
Select up to 3 different types, lengths and time frames to display
Power Moving Average offers the following types of averages :
SMA - Simple Moving Average
EMA - Exponential Moving Average
WMA - Weighted Moving Average
VWMA - Volume Weighted Moving Average
RMA
See the configuration options here :
i.imgur.com
Q : Why are the Power Moving Averages not smooth historically ?
A : As the moving average is calculated on the close of the higher time frame and this close does not change for X- candles, the moving value does not change
Q : Can I add more than one Power Moving Average ?
A : Yes you can, just apply the Power Moving Average multiple times to your chart (free TradingView accounts are limited to 3 indicators)
Q : Can I apply lower time frame Moving Averages ?
A : While this is possible, the value will change during your current time frame candle, this might however be something scalpers want ?
Q : I have a free TradingView account and reached my indicator limit, what can I do ?
A : There are 2 possible solutions, first one is to get a TradingView Pro account (www.tradingview.com), second option is to get our Triple Power Moving Average for FREE.
If you like the indicator, please like and share !
Thank you !

Leeloo Triple Simple Moving AverageAllows you to have three simple moving averages in one indicator.
