Quarterly Divider The "Quarterly Divider" script draws vertical lines at the start of each quarter (January, April, July, October) on the Trading View chart. It also labels each line with the corresponding quarter (Q1, Q2, Q3, Q4) at the bottom of the line, making it easy to visualize the start of each trading quarter. The color and thickness of the lines are customizable
NB. works effectively is used on the weekly timeframe
Smartmoneyconcept

Smart Money Breakout Signals [AlgoAlpha]Introducing the Smart Money Breakout Signals, a cutting-edge trading indicator designed to identify key structural shifts and breakout opportunities in the market. This tool leverages a blend of smart money concepts like Break of Structure (BOS) and Change of Character (CHoCH) to provide traders with actionable insights into market direction and potential entry or exit points.
Key Features :
✨ Market Structure Analysis : Automatically detects and labels BOS and CHoCH for trend confirmation and reversals.
🎨 Customizable Visualization : Tailor bullish and bearish colors for breakout lines and signals to suit your preferences.
📊 Dynamic Take-Profit Targets : Displays three tiered take-profit levels based on breakout volatility.
🔔 Real-Time Alerts : Stay ahead of the game with notifications for bullish and bearish breakouts.
📋 Performance Dashboard : Monitor signal statistics, including win rates and total signals, directly on your chart.
How to Use :
Add the Indicator : Add the script to your favourites ⭐ and customize settings like market structure horizon and confirmation type.
Monitor Breakouts : Observe BOS and CHoCH labels to identify potential trend shifts. Use the breakout lines and tiered take-profit levels to plan trades effectively.
Set Alerts : Enable alerts for bullish or bearish breakouts to act on opportunities without constant monitoring.
How It Works :
The indicator identifies market structure by analyzing pivot highs and lows over a user-defined time horizon. A breakout is confirmed based on either candle closes or wicks surpassing previous pivot points. Upon detection, the script generates signals with breakout lines and calculates take-profit targets based on the distance from the breakout level. A built-in dashboard tracks performance metrics like total signals and win rates, giving traders real-time feedback on strategy effectiveness.

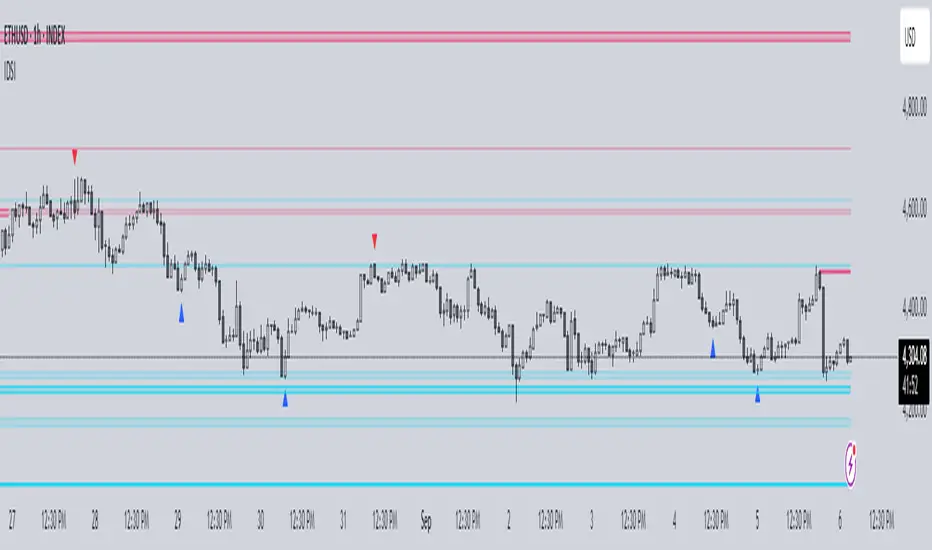
Comprehensive Trading Toolkit [BigBeluga]Trading Toolkit is a comprehensive indicator inspired by the trading strategies of the renowned crypto influencer Michaël van de Poppe . This tool combines RSI divergences, correction zones, and advanced support/resistance levels to provide traders with a robust framework for analyzing market movements.
🔵 Key Features:
RSI Divergences on Chart:
Automatically identifies and plots RSI divergences (bullish and bearish) directly on the main price chart.
Green lines indicate bullish divergences, suggesting potential upward reversals.
Red lines indicate bearish divergences, signaling possible downward movements.
Correction Boxes:
Traders typically define a correction as a drop in value of 10% or more. This drop can happen over a few hours or a few days. Also, it can last for less than 24 hours or many months.
This indicator visualizes corrections with blue shaded boxes, triggered by a percentage decline defined in the settings.
The boxes highlight sharp price drops, helping traders identify significant market movements quickly.
Advanced Support and Resistance Levels:
Dynamically detects key support and resistance levels based on price pivots.
When the price is above a level, it plots a green shaded area from the cross point, marking support.
When the price drops below a level, it plots a red shaded area, highlighting resistance.
Dashed lines indicate weaker levels, while solid lines represent stronger, more reliable levels.
🔵 Usage:
Identify Divergences: Use plotted RSI divergences to detect potential market reversals and align them with price action.
Analyze Correction Zones: Utilize correction boxes to evaluate significant price declines and find potential buying opportunities during these corrections.
Leverage Support and Resistance Levels: Confirm breakouts, reversals, or consolidation zones with the color-coded areas.
Enhance Risk Management: Combine divergences and correction zones to set informed stop-loss or take-profit levels.
Trading Toolkit empowers traders with actionable insights into market trends, corrections, and support/resistance dynamics, making it an invaluable tool for crypto and forex markets.

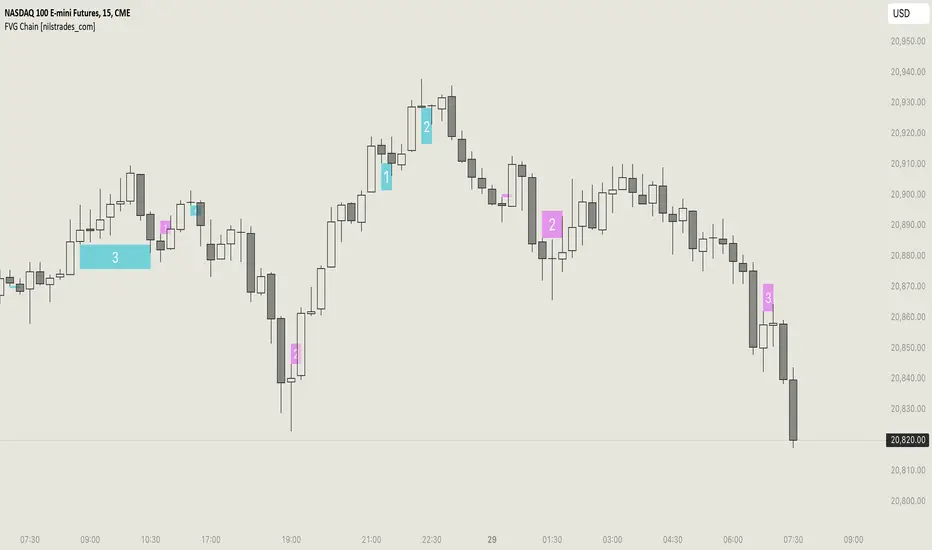
FVG Chain (Consecutive Fair Value Gaps / Imbalances)This indicator detects fair value gaps that are created out of the touch of older fair value gaps, hence creating an "FVG chain".
It counts +1 for the chain whenever a new price leg's FVG is touched.
You can use the current FVG Chain count, as well as the high, low, and price leg high/low of the current FVG as input source in external indicators. Check the data window to see the plot values.
How FVGs are detected:
Bullish: The low of the current confirmed bar is above the high of 2 bars back.
Bearish: The high of the current confirmed bar is below the low of 2 bars back.
A bullish FVG chain is broken if:
The current FVG's price leg low is broken.
The previous bar closed below the FVG, and the current confirmed bar closed below the previous bar.
A bearish FVG chain is broken if:
The current FVG's price leg high is broken.
The previous bar closed above the FVG, and the current confirmed bar closed above the previous bar.
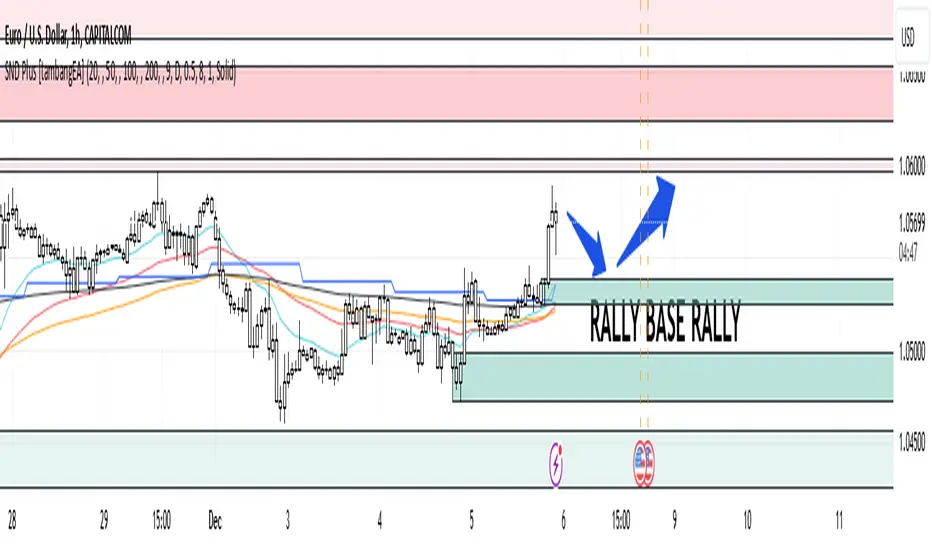
Supply and Demand Plus [tambangEA]The Supply and Demand Plus is an advanced version of the highly-regarded Supply and Demand indicator
Designed to offer additional functionality for professional traders. Building on the core features of the original script, the "Plus" version incorporates enhanced zone selection capabilities and multi-timeframe Exponential Moving Averages (EMAs). This makes it a versatile tool for those who seek to refine their trading strategies using supply and demand principles while integrating trend-following techniques.
🔹 New Capabilities in Supply and Demand Plus
1. Customizable Zone Selection:
Users can now choose which specific zones to display on the chart:
Continuation Trader
-Rally-Base-Rally (RBR): Bullish continuation zones.
-Drop-Base-Drop (DBD): Bearish continuation zones.
Contrarian Trader
-Drop-Base-Rally (DBR): Bullish reversal zones.
-Rally-Base-Drop (RBD): Bearish reversal zones.
This feature allows traders to filter the zones relevant to their strategy, reducing chart clutter and enhancing focus.
2. Multi-Timeframe EMAs:
🔹 The Meeting Zone: "Base"
-The meeting zone is where supply meets demand, often referred to as the equilibrium price range. In this range:
-Sellers are willing to sell at prices buyers are willing to pay.
-Trading volume is usually higher as transactions occur more frequently.
-On the candle chart, this area may appear as sideways movement (consolidation) or regions with balanced candle sizes and wicks, signaling relative agreement between buyers and sellers.
🔹 Key Observations in Candle Charts
-Breakouts: When prices break out of a meeting zone, they indicate that one side (buyers or sellers) has gained significant control. This can lead to new supply or demand zones.
-Retests: Often, prices return to test these zones (called pullbacks) before continuing in the dominant direction. Retests confirm the strength of a supply or demand zone.
-Volume Spikes: High trading volumes near these zones signify active participation and can validate the importance of the zone.
The indicator includes five Exponential Moving Averages (EMAs) that can be plotted across different timeframes simultaneously. This enables traders to:
Track trend strength and direction across multiple timeframes.
Identify dynamic support and resistance levels.
Combine EMA signals with supply and demand zones for confluence-based trading decisions.
EMA Settings:
Fully customizable periods (e.g., EMA 20, 50, 100, etc.).
Adjustable colors and thickness for each EMA.
Multi-timeframe capability to analyze higher or lower timeframes without changing the chart.
🔹 How It Works :
The script works through a series of processes:
1.Zone Identification:
-Uses historical price patterns and pivot levels to map out supply and demand zones.
-Zones dynamically adjust to reflect market conditions, staying relevant to current price action.
-The color of the Zone can be set individually
2.Volume and Market Context:
-Integrates volume analysis to filter out weaker zones.
-Highlights zones with confluence between high volume and price rejections, signaling areas of strong institutional interest.
3.Trend Integration:
-Employs proprietary logic to assess market trends, ensuring that traders only act on zones aligned with broader momentum.
-This feature minimizes counter-trend trades, which are inherently riskier.
4.User Customization:
-Fully customizable zone sensitivity, timeframe settings, and visual preferences allow traders to adapt the tool to their strategy.
Four EMAs in sequence from Chart EMAs to Daily EMA are indicators of a strong trend
The "Base" zone of RBR and DBD supported by Daily EMAs within the zone,
is a strong meeting of buyers and sellers in the past.
Zone can be calibrated how many percent comparison of open close candle to high low candle
the number of candles in Base can be set to the maximum number of candles
🔹 Utility for Traders
The indicator provides a clear roadmap for traders by:
-Identifying high-probability trade zones.
-Confirming entries with volume and trend data.
-Offering actionable insights in both trending and ranging markets.
🔹 Why It Stands Out
Unlike generic supply and demand indicators or trend-following tools, Supply and Demand Plus incorporates an original approach by:
-Seamlessly combining zone identification, volume analysis, and trend confirmation into a single cohesive tool.
-Adapting dynamically to changing market conditions.
-Supporting advanced traders with MTFA, while remaining accessible to beginners with its intuitive design.
Example : Continuation Trader + Retests
The idea is when the "Base" zone occurs, then there is a meeting between buyers and sellers with a large enough volume and will leave a trace in the past.
In accordance with one of the principles in Dow Theory, namely History Repeats Itself, the price will return to the "Base" zone, before continuing the trend
Before
After
🔹 Update and Versioning
This script is an evolution of previous Supply and Demand tools, incorporating valuable user feedback and innovative features. All future updates, including improvements and new functionalities, will be integrated within this script under the Update feature, ensuring continuity and ease of access for users.
🔹 Conclusion
We believe that success lies in the association of the user with the indicator, opposed to many traders who have the perspective that the indicator itself can make them become profitable. The reality is much more complicated than that.
The aim is to provide an indicator comprehensive, customizable, and intuitive enough that any trader can be led to understand this truth and develop an actionable perspective of technical indicators as support tools for decision making.
🔹 DISCLAIMER/RISK WARNING
Trading foreign exchange on margin carries a high level of risk, and may not be suitable for all investors.
All content, tools, scripts, articles, & education provided by are purely for informational & educational purposes only. Past performance does not guarantee future results.
London/NY Sessions [jpkxyz]London/NY Sessions Indicator Guide
This indicator tracks the forex market's most active trading periods: London session, New York session, and their overlap.
This characteristics of the London and New York trading sessions are well documented and many traders use them as a key element in their trading strategies. It is most relevant in forex trading, however it is to an extend also applicable in cryptocurrencies.
London Session (08:00-16:00 UTC)
Most active trading session (35% of daily forex volume)
Highest trading volume and liquidity
Major price movements and trend development
Significant institutional participation
New York Session (13:00-20:00 UTC)
Second most active trading period
High institutional order flow
Major US economic releases
Significant impact on USD pairs
London/New York Overlap (13:00-16:00 UTC)
The most active period in forex markets:
Maximum market liquidity
Highest daily trading volume
Strong price movements
Tightest spreads
Peak institutional activity
This indicator helps traders:
Visualize key trading sessions
Track session highs and lows
Monitor overlap dynamics
Identify potential support/resistance levels (session highs/lows)

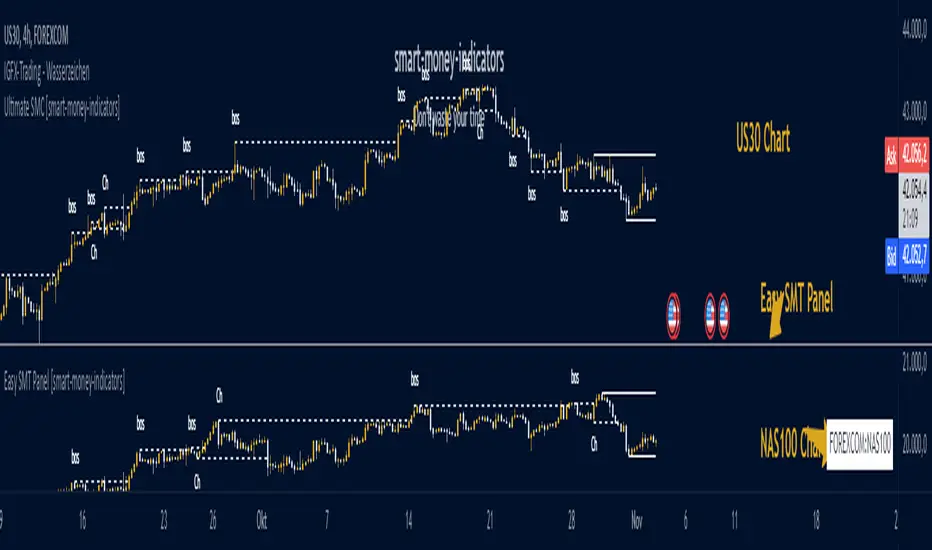
Fair Value Gaps Advanced [smart-money-indicators]This indicator is a tool to support the "SMC" strategy.
This indicator does not provide entry or exit signals.
This indicator is a tool to mark key price areas.
This indicator is a tool to mark key time areas.
This indicator is particularly distinguished by its high customizability of tools,
setting it apart from the indicators currently available on the TradingView platform.
This Fair Value Gaps or Imbalance Indicator marks liquidity areas using boxes.
Fair Value Gaps are created in high-momentum conditions, leaving an area that, in theory and as supported by backtesting, tends to be revisited.
The following settings can be configured:
Show only one-sided Gaps
- Only Fair Value Gaps formed by three consecutive bullish or bearish candles are displayed.
Extend Fair Value Gap
-The box is extended to the current candle.
Draw Mid Line
- A 50% line of the Fair Value Gap is drawn.
Extend Mid Line
-The midline is extended to the current candle.
Remove filled Fair Value Gap
-Filled Fair Value Gaps are removed.
Enable inverse Fair Value Gap
- When a bullish Fair Value Gap is broken, it creates a bearish resistance area.
- When a bearish Fair Value Gap is broken, it creates a bullish support area.
-Display Last X active Buyside Fair Value Gaps
-Display Last X active Sellside Fair Value Gaps
-Display Last X active Buyside Inverse Fair Value Gaps
-Display Last X active Sellside Inverse Fair Value Gaps

Easy SMT Panel [smart-money-indicators]This indicator is the ultimate tool for identifying divergences between two instruments.
This indicator does not provide entry or exit signals.
This indicator is a tool to mark key price areas.
This indicator is a tool to mark key time areas.
This indicator is particularly distinguished by its high customizability of tools,
setting it apart from the indicators currently available on the TradingView platform.
No more annoying switching between instruments across two layout windows! Depending on the instrument in the main window, specify which instrument should be displayed in the panel!
It's up to you to decide the criteria for determining divergences, as this indicator highlights the following key areas using lines and boxes:
Structure Breaks:
- Bearish Change of Character
- Bearish Break of Structure
- Bullish Change of Character
- Bullish Break of Structure
Premium / Discount Area:
- Premium / Discount area of the current range, since the last Change of Character or Break of Structure
Liquidity Areas:
- Asia Session (during or after the session)
- London Session (during or after the session)
- New York Session (during or after the session)
- London Close Session (during or after the session)
- Session Quarters
- Central Banks Dealer Range
How can I use or interpret these areas?
Structure Breaks:
- Has Instrument 1 experienced a structure break at a high/low, but Instrument 2 has not? This could indicate a divergence!
Liquidity Areas:
- Has Instrument 1 already broken a session high/low, but Instrument 2 has not? This could indicate a divergence!
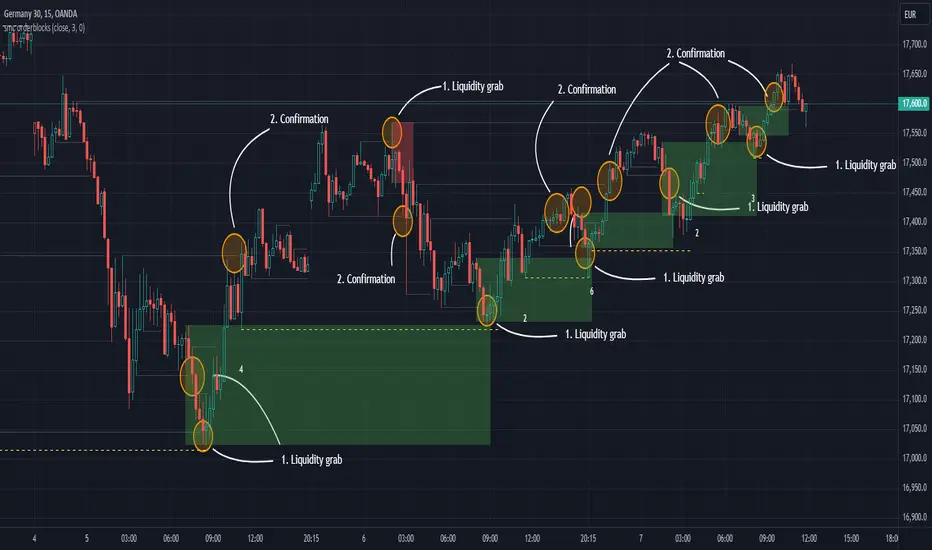
Smart Money Setup 07 [TradingFinder] Liquidity Hunts & Minor OB🔵 Introduction
The Smart Money Concept relies on analyzing market structure, tracking liquidity flows, and identifying order blocks. Research indicates that traders who apply these methods can improve their accuracy in predicting market movements by up to 30%.
These elements allow traders to understand the behavior of market makers, including banks and large financial institutions, which have the ability to influence price movements and shape major market trends. By recognizing how these entities operate, traders can align their strategies with Smart Money actions and better anticipate shifts in the market.
Smart Money typically enters the market at points of high liquidity where trading opportunities are more attractive. By following these liquidity flows, professional traders can position themselves at market reversal points, leading to profitable trades.
The Smart Money Setup 07 indicator has been specifically designed to detect these complex patterns. Using advanced algorithms, this indicator automatically identifies both bullish and bearish trading setups, assisting traders in discovering hidden market opportunities.
As a powerful technical analysis tool, the Smart Money Setup indicator helps predict the actions of major market participants and highlights optimal entry and exit points. Essentially, this tool enables traders to act like institutional investors and market makers, making the most of price fluctuations in their favor.
Ultimately, the Smart Money Setup 07 indicator transforms complex technical analysis into a simple and practical tool. By detecting order blocks and liquidity zones, this tool helps traders execute their strategies with greater precision, leading to more informed and successful trading decisions.
🟣 Bullish Setup
🟣 Bearish Setup
🔵 How to Use
One of the key strengths of the Smart Money Setup 07 indicator is its ability to accurately identify order blocks and analyze liquidity flows. Order blocks represent areas where large buy or sell orders are placed by Smart Money investors, which often indicate key reversal points in the market. Traders can use these order blocks to pinpoint potential entry and exit opportunities.
The Smart Money Setup indicator detects and visually displays these order blocks on the chart, helping traders identify the best zones to enter or exit trades. Since these zones are frequently used by large institutional investors, following these blocks allows traders to capitalize on price fluctuations and trade with confidence.
🟣 Bullish Smart Money Setup
A Bullish Smart Money Setup forms when the market creates Higher Lows and Higher Highs. In this situation, the indicator analyzes pivot points, liquidity flows, and order blocks to identify buy opportunities. Liquidity points in these setups indicate areas where Smart Money is likely to enter long positions.
In the bullish setup image, multiple Higher Lows and Higher Highs are formed. The green zone represents a Bullish Order Block, signaling traders to enter a long trade. The Smart Money Setup indicator displays a green arrow, indicating a high-probability upward price movement from this liquidity zone.
🟣 Bearish Smart Money Setup
A Bearish Smart Money Setup occurs when the market structure shows Lower Highs and Lower Lows, indicating weakness in price. The indicator identifies these patterns and highlights potential sell opportunities. Liquidity points in this setup mark areas where Smart Money enters sell positions.
In the bearish setup image, a Lower High is followed by a Lower Low, with the red liquidity zone acting as a Bearish Order Block. The Smart Money Setup indicator shows a red arrow, signaling a likely downward move, offering traders an opportunity to enter short positions.
🔵 Settings
Pivot Period : This setting determines how many candles are needed to form a pivot point. A default value of 2 is optimal for quickly identifying key pivot points in price action.
Order Block Validity Period : This parameter defines the lifespan of an order block. Traders can adjust how long each order block remains valid. For instance, setting it to 500 means that an order block will be valid for 500 bars after its formation.
Mitigation Level OB : This setting allows traders to select whether order blocks should be based on the "Proximal," "50% OB," or "Distal" levels, helping traders manage risk more effectively.
Order Block Refinement : Traders can refine the order blocks with precision. The indicator offers two refinement modes: Defensive and Aggressive. The Defensive mode identifies safer order blocks, while the Aggressive mode targets higher-risk blocks with the potential for larger reversals.
🔵 Conclusion
The Smart Money Setup 07 indicator is a powerful tool for identifying key Smart Money movements in the market. It provides traders with essential insights for making informed trading decisions, particularly when combined with technical analysis and liquidity flow analysis. This indicator allows traders to accurately pinpoint entry and exit points, helping them maximize profits and minimize risk.
By offering a range of customizable settings, the Smart Money Setup indicator adapts to different trading styles and strategies. Furthermore, its ability to detect order blocks and identify supply and demand zones makes it an indispensable tool for any trader looking to enhance their strategy.
In conclusion, the Smart Money Setup 07 is a crucial tool for traders aiming to optimize their trading performance. By utilizing the concepts of Smart Money in technical analysis, traders can make more precise decisions and take advantage of market fluctuations.

Price Action Analyst [OmegaTools]Price Action Analyst (PAA) is an advanced trading tool designed to assist traders in identifying key price action structures such as order blocks, market structure shifts, liquidity grabs, and imbalances. With its fully customizable settings, the script offers both novice and experienced traders insights into potential market movements by visually highlighting premium/discount zones, breakout signals, and significant price levels.
This script utilizes complex logic to determine significant price action patterns and provides dynamic tools to spot strong market trends, liquidity pools, and imbalances across different timeframes. It also integrates an internal backtesting function to evaluate win rates based on price interactions with supply and demand zones.
The script combines multiple analysis techniques, including market structure shifts, order block detection, fair value gaps (FVG), and ICT bias detection, to provide a comprehensive and holistic market view.
Key Features:
Order Block Detection: Automatically detects order blocks based on price action and strength analysis, highlighting potential support/resistance zones.
Market Structure Analysis: Tracks internal and external market structure changes with gradient color-coded visuals.
Liquidity Grabs & Breakouts: Detects potential liquidity grab and breakout areas with volume confirmation.
Fair Value Gaps (FVG): Identifies bullish and bearish FVGs based on historical price action and threshold calculations.
ICT Bias: Integrates ICT bias analysis, dynamically adjusting based on higher-timeframe analysis.
Supply and Demand Zones: Highlights supply and demand zones using customizable colors and thresholds, adjusting dynamically based on market conditions.
Trend Lines: Automatically draws trend lines based on significant price pivots, extending them dynamically over time.
Backtesting: Internal backtesting engine to calculate the win rate of signals generated within supply and demand zones.
Percentile-Based Pricing: Plots key percentile price levels to visualize premium, fair, and discount pricing zones.
High Customizability: Offers extensive user input options for adjusting zone detection, color schemes, and structure analysis.
User Guide:
Order Blocks: Order blocks are significant support or resistance zones where strong buyers or sellers previously entered the market. These zones are detected based on pivot points and engulfing price action. The strength of each block is determined by momentum, volume, and liquidity confirmations.
Demand Zones: Displayed in shades of blue based on their strength. The darker the color, the stronger the zone.
Supply Zones: Displayed in shades of red based on their strength. These zones highlight potential resistance areas.
The zones will dynamically extend as long as they remain valid. Users can set a maximum number of order blocks to be displayed.
Market Structure: Market structure is classified into internal and external shifts. A bullish or bearish market structure break (MSB) occurs when the price moves past a previous high or low. This script tracks these breaks and plots them using a gradient color scheme:
Internal Structure: Short-term market structure, highlighting smaller movements.
External Structure: Long-term market shifts, typically more significant.
Users can choose how they want the structure to be visualized through the "Market Structure" setting, choosing from different visual methods.
Liquidity Grabs: The script identifies liquidity grabs (false breakouts designed to trap traders) by monitoring price action around highs and lows of previous bars. These are represented by diamond shapes:
Liquidity Buy: Displayed below bars when a liquidity grab occurs near a low.
Liquidity Sell: Displayed above bars when a liquidity grab occurs near a high.
Breakouts: Breakouts are detected based on strong price momentum beyond key levels:
Breakout Buy: Triggered when the price closes above the highest point of the past 20 bars with confirmation from volume and range expansion.
Breakout Sell: Triggered when the price closes below the lowest point of the past 20 bars, again with volume and range confirmation.
Fair Value Gaps (FVG): Fair value gaps (FVGs) are periods where the price moves too quickly, leaving an unbalanced market condition. The script identifies these gaps:
Bullish FVG: When there is a gap between the low of two previous bars and the high of a recent bar.
Bearish FVG: When a gap occurs between the high of two previous bars and the low of the recent bar.
FVGs are color-coded and can be filtered by their size to focus on more significant gaps.
ICT Bias: The script integrates the ICT methodology by offering an auto-calculated higher-timeframe bias:
Long Bias: Suggests the market is in an uptrend based on higher timeframe analysis.
Short Bias: Indicates a downtrend.
Neutral Bias: Suggests no clear directional bias.
Trend Lines: Automatic trend lines are drawn based on significant pivot highs and lows. These lines will dynamically adjust based on price movement. Users can control the number of trend lines displayed and extend them over time to track developing trends.
Percentile Pricing: The script also plots the 25th percentile (discount zone), 75th percentile (premium zone), and a fair value price. This helps identify whether the current price is overbought (premium) or oversold (discount).
Customization:
Zone Strength Filter: Users can set a minimum strength threshold for order blocks to be displayed.
Color Customization: Users can choose colors for demand and supply zones, market structure, breakouts, and FVGs.
Dynamic Zone Management: The script allows zones to be deleted after a certain number of bars or dynamically adjusts zones based on recent price action.
Max Zone Count: Limits the number of supply and demand zones shown on the chart to maintain clarity.
Backtesting & Win Rate: The script includes a backtesting engine to calculate the percentage of respect on the interaction between price and demand/supply zones. Results are displayed in a table at the bottom of the chart, showing the percentage rating for both long and short zones. Please note that this is not a win rate of a simulated strategy, it simply is a measure to understand if the current assets tends to respect more supply or demand zones.
How to Use:
Load the script onto your chart. The default settings are optimized for identifying key price action zones and structure on intraday charts of liquid assets.
Customize the settings according to your strategy. For example, adjust the "Max Orderblocks" and "Strength Filter" to focus on more significant price action areas.
Monitor the liquidity grabs, breakouts, and FVGs for potential trade opportunities.
Use the bias and market structure analysis to align your trades with the prevailing market trend.
Refer to the backtesting win rates to evaluate the effectiveness of the zones in your trading.
Terms & Conditions:
By using this script, you agree to the following terms:
Educational Purposes Only: This script is provided for informational and educational purposes and does not constitute financial advice. Use at your own risk.
No Warranty: The script is provided "as-is" without any guarantees or warranties regarding its accuracy or completeness. The creator is not responsible for any losses incurred from the use of this tool.
Open-Source License: This script is open-source and may be modified or redistributed in accordance with the TradingView open-source license. Proper credit to the original creator, OmegaTools, must be maintained in any derivative works.

Price Action Volumetric Breaker Blocks [UAlgo]The Price Action Volumetric Breaker Blocks indicator is designed to identify and visualize significant price levels in the market. It combines concepts of price action, volume analysis, and market structure to provide traders with a comprehensive view of potential support and resistance areas. This indicator identifies "breaker blocks," which are price zones where the market has shown significant interest in the past.
These blocks are created based on swing highs and lows, and are further analyzed using volume data to determine their strength. The indicator also tracks market structure shifts, providing additional context to price movements.
By visualizing these key levels and market structure changes, traders can gain insights into potential areas of price reversal or continuation, helping them make more informed trading decisions.
🔶 Key Features
Dynamic Breaker Block Identification: The indicator automatically detects and draws breaker blocks based on swing highs and lows. These blocks represent areas of potential support and resistance.
Volume-Weighted Strength Analysis: Each breaker block is analyzed using volume data to determine its bullish and bearish strength. This is visually represented by the proportion of green (bullish) and red (bearish) coloring within each block.
Market Structure Break (MSB) and Break of Structure (BOS): The indicator identifies and labels Market Structure Breaks (MSB) and Break of Structure (BOS) events, providing context to larger market trends.
Customizable Settings:
- Adjustable swing length for identifying pivot points
- Option to show a specific number of recent breaker blocks
- Choice between wick or close price for violation checks
- Toggle to hide overlapping blocks for cleaner analysis
Violation Detection: Automatically detects when a breaker block has been violated (broken through), either by wick or close price, depending on user settings.
Overlap Control: Provides an option to hide overlapping order blocks, ensuring that the chart remains clean and easy to read when multiple blocks are detected in close proximity.
🔶 Interpreting Indicator
Breaker Blocks:
Breaker blocks are key areas where the price moves through and invalidates a previously identified order block. The indicator detects a breaker block when the price violates an order block by exceeding its high or low (depending on whether it's a bullish or bearish block). This violation is determined by either the wick or the close of a candle, depending on the user's selection in the "Violation Check" setting. When a breaker block is detected, the indicator removes the violated order block from the chart, signaling that the zone is no longer relevant for future price action.
Bullish Breaker Block: This occurs when a bearish order block (red) is violated by the price closing above the block’s top boundary or when the wick surpasses this level. It signals that a prior bearish structure has been invalidated, and the market may shift to a bullish trend.
Bearish Breaker Block: This occurs when a bullish order block (teal) is violated by the price closing below the block’s bottom boundary or when the wick drops below it. It suggests that a previous bullish structure has been broken, indicating potential bearish momentum.
Market Structure Labels:
"MSB" (Market Structure Break) labels indicate a potential change in trend direction.
"BOS" (Break of Structure) labels confirm the continuation of the current trend after breaking a significant level.
Block Strength:
A block with more green indicates stronger bullish interest.
A block with more red indicates stronger bearish interest.
The relative sizes of the green and red portions show the balance of power between buyers and sellers at that level.
🔶 Disclaimer
Use with Caution: This indicator is provided for educational and informational purposes only and should not be considered as financial advice. Users should exercise caution and perform their own analysis before making trading decisions based on the indicator's signals.
Not Financial Advice: The information provided by this indicator does not constitute financial advice, and the creator (UAlgo) shall not be held responsible for any trading losses incurred as a result of using this indicator.
Backtesting Recommended: Traders are encouraged to backtest the indicator thoroughly on historical data before using it in live trading to assess its performance and suitability for their trading strategies.
Risk Management: Trading involves inherent risks, and users should implement proper risk management strategies, including but not limited to stop-loss orders and position sizing, to mitigate potential losses.
No Guarantees: The accuracy and reliability of the indicator's signals cannot be guaranteed, as they are based on historical price data and past performance may not be indicative of future results.

Liquidity Zones [BigBeluga]This indicator is designed to detect liquidity zones on the chart by identifying significant pivot highs and lows filtered by volume strength. It plots these zones as boxes, highlighting areas where liquidity is likely to accumulate. The indicator also draws lines extending from these boxes, marking the levels where price may "grab" this liquidity. The size of these boxes can be dynamic, adjusting based on the volume size, offering a visual representation of market areas where traders might expect significant price reactions.
🔵 IDEA
The idea behind the Liquidity Zones indicator is to help traders identify key market levels where liquidity accumulates. Liquidity zones are areas where there are enough buy or sell orders that can potentially lead to significant price movements. By focusing on pivot points filtered by volume strength, the indicator aims to provide a clearer picture of where large players may have positioned their orders. This insight allows traders to anticipate potential market reactions, such as reversals or breakouts, when the price reaches these zones. The option for dynamic box height further refines the visualization, showing the extent of liquidity based on the volume's intensity.
🔵 KEY FEATURES & USAGE
◉ Volume-Filtered Pivot Highs and Lows:
The indicator scans for pivot highs and lows on the chart, filtering these points based on the volume strength setting (Low, Mid, High). This ensures that only the most significant liquidity zones, backed by notable trading volume, are highlighted. Traders can adjust the filter to focus on different levels of market activity, from small fluctuations to major volume spikes.
Low:
Mid:
High:
◉ Dynamic and Static Liquidity Zones:
Liquidity zones are plotted as boxes around pivot points, with an optional dynamic mode that adjusts the box height based on the normalized volume. This dynamic adjustment reflects the liquidity carried by the volume, making it easier to gauge the significance of each zone. In static mode, the boxes have a fixed height, providing a consistent visual reference for the zones.
◉ Color Intensity Based on Volume:
The indicator adjusts the color intensity of the liquidity zones based on the volume strength. Higher volume zones will be displayed with more intense colors, giving a visual cue to the strength of the liquidity present in that area. This makes it easier to differentiate between zones of varying importance at a glance, allowing traders to quickly identify where the market has the highest concentration of liquidity.
◉ Liquidity Grab Detection and Red Circles:
When the price interacts with a liquidity zone, the indicator detects whether liquidity has been "grabbed" at these levels. If the price moves into a zone and crosses a level, the box label changes to "Liquidity Grabbed," and the line marking the level becomes dashed.
Reversal Points:
The beginning of a trend:
Additionally marks these "liquidity grabs" with red circles, indicating both recent and past liquidity grabs. This feature helps traders identify areas where liquidity has been absorbed by the market, which may signal potential reversals or shifts in market direction.
◉ Dashboard Display:
A dashboard in the upper right corner of the chart provides an overview of the indicator's settings and status. It shows the number of plotted zones, as set in the input settings, and whether the dynamic mode is active. This quick reference helps traders stay informed about the indicator's configuration without needing to open the settings panel.
🔵 CUSTOMIZATION
Length & Zones Amount: Set the length for pivot detection and the maximum number of zones to be displayed on the chart. This allows you to control how many liquidity zones you want to monitor at any given time.
Volume Strength Filter: Adjust the filter to Low, Mid, or High to control the strength of volume required for a pivot to be considered a significant liquidity zone. Higher settings focus on zones with greater volume, indicating stronger liquidity.
Dynamic Distance Mode: Enable or disable the dynamic mode, which adjusts the box height based on the volume size. When dynamic mode is off, the boxes have a fixed height based on the ATR, offering a consistent visualization regardless of the volume size.
The Liquidity Zones indicator is a versatile tool for identifying areas of significant market activity, offering a clear view of where liquidity is likely to reside. By filtering these zones through volume strength and providing dynamic or static visualization options, it equips traders with insights into potential market reaction points, enhancing their ability to anticipate and respond to market movements. The varying color intensity based on volume further aids in quickly recognizing the most critical liquidity zones on the chart.

Price Action Volumetric Order Blocks [UAlgo]"Price Action Volumetric Order Blocks" indicator aims to identify significant price zones in the market based on a combination of price action and volume analysis. It utilizes the concept of "Order Blocks," which are areas on the chart where large orders are believed to have been placed, influencing price behavior. By analyzing price swings and volume activity, the indicator attempts to highlight potential support and resistance levels.
🔶 Key Features
Swing Length: This input allows you to adjust the timeframe used to identify price swings for order block detection. A longer swing length will focus on larger timeframes and potentially capture stronger order blocks.
Show Last X Order Blocks: This controls the number of order blocks displayed on the chart. You can choose to visualize a specific number of the most recent order blocks.
Violation Check: This setting determines how the indicator identifies potential order block violations. You can choose between "Wick" or "Close" violations. A "Wick" violation occurs when the price (wick) extends beyond the order block boundaries, while a "Close" violation signifies that the closing price breaches the order block.
Hide Overlap: This option allows you to manage the display of overlapping order blocks. If set to "True," only non-overlapping order blocks will be shown, potentially offering a clearer visualization.
Colors: You can customize the color scheme for bullish (upward) and bearish (downward) order blocks to enhance visual clarity on the chart.
🔶 Interpreting the Indicator
Order Blocks: The teal-colored boxes represent bullish order blocks, indicating areas of demand where buying pressure is likely to be strong. Red-colored boxes represent bearish order blocks, indicating areas of supply where selling pressure is likely to be dominant. These zones often signal potential reversal points or consolidation areas.
Strength Calculations: The indicator calculates the relative strength of bullish and bearish blocks based on volume. A higher bullish strength indicates stronger buying pressure, while higher bearish strength suggests more selling pressure. Traders can use this information to gauge the strength of a price level and predict future price movements.
Market Structure Lines: The indicator displays horizontal lines to depict the current market structure, labeled as "MSB" (Market Sell Balance) or "BOS" (Break of Structure). These lines can help visualize the prevailing trend direction.
Order Block Violations: When a price wick or close breaches an order block (depending on the chosen violation type), the corresponding order block visualization is removed from the chart. This can signify a potential weakening of the identified support or resistance zone.
🔶 Disclaimer
Use with Caution: This indicator is provided for educational and informational purposes only and should not be considered as financial advice. Users should exercise caution and perform their own analysis before making trading decisions based on the indicator's signals.
Not Financial Advice: The information provided by this indicator does not constitute financial advice, and the creator (UAlgo) shall not be held responsible for any trading losses incurred as a result of using this indicator.
Backtesting Recommended: Traders are encouraged to backtest the indicator thoroughly on historical data before using it in live trading to assess its performance and suitability for their trading strategies.
Risk Management: Trading involves inherent risks, and users should implement proper risk management strategies, including but not limited to stop-loss orders and position sizing, to mitigate potential losses.
No Guarantees: The accuracy and reliability of the indicator's signals cannot be guaranteed, as they are based on historical price data and past performance may not be indicative of future results.

Institutional Demand Supply IndicatorINTRODUCTION
Institutional demand and supply zones are key areas on a price chart where large institutional traders, such as banks and hedge funds, place significant buy or sell orders. These zones often act as strong support or resistance levels due to the substantial volume of trades executed by institutions.
There are various ways to identify these areas of interest on the charts, but the main goal is to study the price movements, especially significant ones. Large financial entities tend to operate in the same price areas repeatedly. Instead of chasing price movements and risking counter moves, it's better to wait for the price to return to these areas, expecting that these entities will buy or sell there again.
INDICATOR SETTINGS:
1. High Probability Zones (HPZ) - High Probability Zones (HPZ) are demand and supply zones identified using advanced calculations to highlight the most relevant and significant areas. These zones have a higher probability of impacting price movements. Better to keep it turned On.
2. Zone Extension? - Extending zones can be useful for identifying areas that have already been retraced as these zones may continue to influence market dynamics despite the retracement.
3. Zone Type - This option lets you select the zone layout type. 4 options are given which are self explanatory.
4. Directional Candle Count - This option keeps a count of number of consecutive bullish / bearish candle that you would like to set as qualifying parameter for demand / supply zone. For Example - If you keep the number 1, the script will draw a demand or supply zone by just checking if 1 candle has met all the criteria's and calculations.
5. Zone Validity Percentage - You can set the percent change for the number of candles mentioned in point 4 above.
6. HPZ - Keep the number between 6 to 10. As you move the number up, less number of zones will be displayed.
7. Zone Count - You can adjust the number of visible demand and supply zones on the chart. Increase this number if you want to display more zones, or decrease it if the chart becomes too cluttered.
D I S P L A Y
1. Background Color Demand / Supply Zone - This is the background color of demand and supply zone.
2. Channel Color Demand / Supply Zone - This is the color of channel.
3. Channel Line Style - Choose between Solid, dotted or dashed.
4. Background Color Transparency - Choose the transparency of background color
5. Channel Line Width - Choose Channel line width between 1 to 4.
6. Channel Line Transparency - Choose Channel Line Transparency and keep it between 1 to 100.
Sometimes, a level may be breached on one timeframe, but that doesn’t mean the indicator is not working. To understand the price action better, switch to a different timeframe to check why that level was breached and why it found support at a different zone on another timeframe. Look at the 2 screenshots below.
Unicorn ICT Signals [TradingFinder] Breaker Block + FVG Zones🔵 Introduction
The "ICT Unicorn Model" trading strategy in the "Inner Circle Trader" (ICT) style is one of the well-known strategies in the world of Forex and financial market trading.
The ICT methodology was developed by Michael Huddleston and is based on technical analysis and Price Action concepts.
This style focuses specifically on interpreting price movements and identifying optimal entry and exit points in the market.
In the Unicorn strategy, traders seek points where the probability of price reversal or trend continuation is high. This strategy is primarily based on recognizing and analyzing Price Action patterns and market structure.
By understanding"ICT Unicorn Model", traders can make more informed decisions about where to enter or exit trades, thereby increasing their chances of success in the market.
🟣 Understanding the Breaker Block
A Breaker Block is a specialized form of an Order Block that changes its role after a key market level is broken. Typically, an Order Block is an area on the chart where large institutional orders are likely to be placed, providing strong support or resistance.
However, when this area is breached, and the price moves in the opposite direction, it transforms into what is known as a Breaker Block. This shift indicates a reversal in market sentiment, turning the previous support into resistance or vice versa, thereby signaling a potential trend change to traders.
🟣 The Significance of the Fair Value Gap (FVG)
The Fair Value Gap (FVG) refers to an area on a price chart where the price rapidly moves through a level, leaving behind a gap. This gap represents an imbalance between supply and demand and is often seen as a potential area for price to return and fill the gap.
These zones are crucial for traders as they can indicate future price movements, providing opportunities to enter or exit trades.
🟣 Defining the ICT Unicorn Model
When an FVG overlaps with a Breaker Block, it forms a highly significant trading area known as a Unicorn. This overlap creates an ideal zone for traders to enter the market, as it combines two powerful technical signals.
The Unicorn Model is therefore considered an optimal strategy for identifying precise entry and exit points in the financial markets.
Demand ICT Unicorn Model :
Supply ICT Unicorn Model :
🔵 How to Use
🟣 Bullish ICT Unicorn
The Bullish ICT Unicorn model is applicable when the market is in an uptrend, and traders are seeking buying opportunities.
Follow these steps to identify Bullish ICT Unicorn :
Identify the Bullish Breaker Block : Locate an area where the price moved upward after breaking an Order Block. This area now acts as a Breaker Block.
Identify the Bullish FVG : Look for a Fair Value Gap near the Breaker Block.
Confirm the Unicorn : When the Bullish Breaker Block and Bullish FVG overlap, a Bullish Unicorn is confirmed. Traders can enter a buy position when the price returns to this zone.
🟣Bearish ICT Unicorn
The Bearish ICT Unicorn model is used when the market is in a downtrend, and traders are looking for selling opportunities.
To identify Bearish ICT Unicorn, follow these steps :
Identify the Bearish Breaker Block : Find an area where the price moved downward after breaking an Order Block. This area now acts as a Breaker Block.
Identify the Bearish FVG : Check if a Fair Value Gap has formed near the Breaker Block.
Confirm the Unicorn : When the Bearish Breaker Block and Bearish FVG overlap, a Bearish Unicorn is confirmed. Traders can enter a sell position when the price returns to this zone.
🔵 Setting
🟣 Global Setting
Pivot Period of Order Blocks Detector : Enter the desired pivot period to identify the Order Block.
Order Block Validity Period (Bar) : You can specify the maximum time the Order Block remains valid based on the number of candles from the origin.
Mitigation Level Breaker Block : Determining the basic level of a Breaker Block. When the price hits the basic level, the Breaker Block due to mitigation.
Mitigation Level FVG : Determining the basic level of a FVG. When the price hits the basic level, the FVG due to mitigation.
Mitigation Level Unicorn : Determining the basic level of a Unicorn Block. When the price hits the basic level, the Unicorn Block due to mitigation.
🟣 Unicorn Block Display
Show All Unicorn Block : If it is turned off, only the last Order Block will be displayed.
Demand Unicorn Block : Show or not show and specify color.
Supply Unicorn Block : Show or not show and specify color.
🟣 Breaker Block Display
Show All Breaker Block : If it is turned off, only the last Breaker Block will be displayed.
Demand Main Breaker Block : Show or not show and specify color.
Demand Sub (Propulsion & BoS Origin) Breaker Block : Show or not show and specify color.
Supply Main Breaker Block : Show or not show and specify color.
Supply Sub (Propulsion & BoS Origin) Breaker Block : Show or not show and specify color.
🟣 Fair Value Gap Display
Show Bullish FVG : Toggles the display of demand-related boxes.
Show Bearish FVG : Toggles the display of supply-related boxes.
🟣 Logic Settings
🟣 Order Block Refinement
Refine Order Blocks : Enable or disable the refinement feature. Mode selection.
🟣 FVG Filter
FVG Filter : This refines the number of identified FVG areas based on a specified algorithm to focus on higher quality signals and reduce noise.
Types of FVG filters :
Very Aggressive Filter: Adds a condition where, for an upward FVG, the last candle's highest price must exceed the middle candle's highest price, and for a downward FVG, the last candle's lowest price must be lower than the middle candle's lowest price. This minimally filters out FVGs.
Aggressive Filter: Builds on the Very Aggressive mode by ensuring the middle candle is not too small, filtering out more FVGs.
Defensive Filter: Adds criteria regarding the size and structure of the middle candle, requiring it to have a substantial body and specific polarity conditions, filtering out a significant number of FVGs.
Very Defensive Filter: Further refines filtering by ensuring the first and third candles are not small-bodied doji candles, retaining only the highest quality signals.
🟣 Alert
Alert Name : The name of the alert you receive.
Alert ICT Unicorn Model Block Mitigation :
On / Off
Message Frequency :
This string parameter defines the announcement frequency. Choices include: "All" (activates the alert every time the function is called), "Once Per Bar" (activates the alert only on the first call within the bar), and "Once Per Bar Close" (the alert is activated only by a call at the last script execution of the real-time bar upon closing). The default setting is "Once per Bar".
Show Alert Time by Time Zone :
The date, hour, and minute you receive in alert messages can be based on any time zone you choose. For example, if you want New York time, you should enter "UTC-4". This input is set to the time zone "UTC" by default.
🔵Conclusion
The Unicorn Model in ICT, utilizing the concepts of Breaker Blocks and Fair Value Gaps, provides an effective tool for identifying entry and exit points in financial markets. By offering more precise signals, this model helps traders make better decisions and minimize trading risks.
Success in applying this model requires practice and a deep understanding of market structure, but it can significantly improve trading performance.

long&short signal Smart Money Concepts (SMC) with MACD Signals Smart Money Concepts (SMC) with MACD Signals
Advanced SMC and MACD Integration for Precision Trading
The "Smart Money Concepts (SMC) with MACD Signals" indicator is a powerful and versatile tool designed to enhance trading strategies by integrating two highly effective technical analysis methods into a single, cohesive indicator. This advanced script combines the Smart Money Concepts (SMC) methodology with the Moving Average Convergence Divergence (MACD) indicator to provide traders with a comprehensive trading solution that identifies key market trends and potential trading opportunities.
What It Does:
Smart Money Concepts (SMC):
The SMC component of this indicator identifies significant price levels and zones where market participants, particularly institutional investors, may be active. It calculates high and low anchor levels based on historical price data, creating zones that help traders understand where price action may encounter support or resistance. These anchor levels are used to plot background colors on the chart, highlighting critical areas of interest where price might react, and generating buy (long) and sell (short) signals based on price interactions with these levels.
MACD (Moving Average Convergence Divergence):
The MACD component provides insights into market momentum and trend strength. By calculating the difference between two moving averages and comparing it to a signal line, the MACD indicator helps traders identify potential changes in trend direction. The script plots the MACD line, signal line, and histogram, offering a clear visual representation of market momentum. Buy (long) and sell (short) signals are generated when the MACD line crosses above or below the signal line, providing timely alerts to potential trading opportunities.
Why It’s Special:
This indicator stands out for its dual functionality, combining the price level analysis of SMC with the momentum-based insights of MACD. The integration allows traders to benefit from both trend and price level analysis, offering a more robust and accurate trading tool. The SMC component highlights critical price zones and provides context for price action, while the MACD component confirms the strength and direction of market trends.
By using this combined approach, traders can make more informed decisions based on comprehensive market analysis. The indicator not only helps in identifying significant price levels and potential market reversals but also provides real-time signals to capitalize on these opportunities. Whether you are a day trader or a swing trader, the "Smart Money Concepts (SMC) with MACD Signals" indicator is designed to enhance your trading strategy with precision and clarity.
This unique combination of SMC and MACD offers a powerful toolset for traders looking to refine their trading strategies and improve their market analysis. With its user-friendly visualizations and signal generation, this indicator is an essential addition to any trader’s toolkit.

SMC Orderblocks (MTF)The SMC Orderblocks Indicator is designed to detect institutional orderblocks by focusing on price action and pattern detection, with a strong emphasis on identifying liquidity grabs.
This tool helps traders pinpoint areas where significant institutional trades are likely to occur by assuming the presence of orderblocks based on observed market behavior.
Unlike other indicators that may rely heavily on volume, the SMC Orderblocks Indicator offers a fresh approach rooted in a deep study of price action and Smart Money Concepts (SMC).
🔍 Unique Approach
Unlike other orderblock indicators that typically depend on volume to detect orderblocks (a common and valid method), the SMC Orderblocks Indicator explores a new approach. After extensive study and understanding of price action and SMC principles, this indicator focuses on market behavior to assume where institutional orderblocks might be. This approach offers traders a unique perspective and valuable insights, allowing them to view the market through a different lens.
🧠 The Theory Behind It
In trading, liquidity is essential for institutions and large market participants to execute their substantial orders. Orders tend to cluster around predictable levels, such as recent highs or lows, creating pools of liquidity. To secure better entry points for their large trades, institutions and market makers may manipulate prices to sweep these liquidity levels. The SMC Orderblocks Indicator is designed to detect these market manipulations—when price moves to capture liquidity—and uses these events to assume the presence of orderblocks at key levels. By recognizing these manipulations, the indicator provides insights into potential areas of significant institutional activity.
⚙️ How It Works
In order to make it work, there are two big essentail parts for this indicator. The first one is being able to identify liquidity areas. The second one is to detect the liquidity grab pattern.
1. Identifying Liquidity
So, in order to find market manipulations, mainly "liquidity grabs", the first thing we need is to find where the liquidity is.
Here "liquidity", refers to "orders", and only the exchange actually knows at what price orders are placed. The limit orders are visible in the order book and most of the time the exchange let this information be publicly accessed. But not all orders are in the orderbook. The stop-limit orders like stop-loss orders are added in the orderbook only when the market price reaches a certain price (the stop price).
At present, when using a chart script like Pinescript, there is no known way to access this real information.
But fortunately, traders and institutional behavior stay the same. Traders tend to place their orders at predictable levels, like above highs or below lows. They can also be near inducement areas, specifically created by institutions to induce traders to place their orders at certain levels.
So, the job of the indicator is first to find these levels, regardless of the method used. In the previous version of this script, I used pivots to detect highs and lows, but this method was lacking when it came to finding inducement zones or stacks of liquidity.
Instead, the indicator now uses a new method to check whether there is a stack of non-liquidated candles. This method allows the detection of inducement zones with unliquidated candles. When the stack reaches a certain number (by default, three), the liquidity is marked as valid for sweep detection.
Note: When using the indicator, you can enable the display of liquidity (to see mitigated and unmitigated liquidity) and their stack number.
2. Detecting a Liquidity sweep
Once the first and key part is done, we need to detect the market manipulation: the liquidity grabs. Liquidity grab patterns are always the same. In the following example, let's assume the institutions want to fill sell orders in a bearish market. Here are the steps they will likely take:
- 1. The institutionals place their main orders (the orderblock) at a desired price.
- 2. They let the liquidity accumulate next to that desired price. They can even induce traders to place their own orders there. The will serve as liquidity.
- 3. Institutionals will manipulate the market price to move it towards their awaiting orders to fill them. Once that price is reach, and their orders are being filled, the market price will start moving in the opposite direction.
- 4. The grab is confirmed, when the liquidity in that oppsiite direction is grabed, or simply when the bearish market trend resumes by breaking the lows, along with additional confirmations
Sometimes, institutions will have two opposite positions in the same asset—one short and one long. This is called hedging. The goal here is to use the long orders to push the market price towards the main sell orders. Once the sell orders are filled and the market price starts falling, they may try to push it up again to close their long position with minimal loss and finally let the price fall for good.
It is at that moment that it is best to enter the market. This is why, by default, the indicator will display when the price starts moving upward towards the liquidity grab: because it's where the manipulation started and where the price is likely to reach again before resuming the main trend.
Real-Time Visualization:
As soon as an "orderblock" (or market manipulation) is detected, the indicator will display it on the chart in real time.
This immediate visualization helps traders stay ahead and catch the main market move.
💡 Usage Tips
Apply the script to your chart. This is a price-action based script so it will work on most markets. You do not need to edit settings but you can adjust them to match your trading style.
To get the most out of the SMC Orderblocks Indicator, it’s recommended to use it alongside other analysis tools, espacially market structure indicators. You can try the free-to-use SMC Market Structure (MTF) to filter the interesting orderblocks.
Additionnaly, if you search liquidity areas to set as your trade's target, you can enable their display to see mitigated and unmitigated liquidity lines. The display is disabled by default to keep charts clean.
While the indicator helps detect potential institutional orderblocks based on liquidity grabs, combining its insights with your trading knowledge and other tools will enhance decision-making.
⚠️ Disclaimer
While this method provides useful information, the orderblocks can only be assumed based on market behavior. Moreover, given how the indicator works, the accuracy cannot be guaranteed. It's important to combine the indicator's information with your own experience and other confirmation methods.
Orderblocks are also time-sensitive. The fact that an orderblock was detected and displayed on the chart does not guarantee that orders will still be present when the price returns to that level. If too much time has elapsed since the orderblock was created, or if the market structure has changed, it may be wise to disregard it. Always seek additional confirmation before opening a position.
The theory presented here on how institutional orderblocks are made, and how the market may be manipulated to fill orders, is based on my own research, knowledge, and analysis. Since I have never worked within an institution, these are educated assumptions and could be incorrect. Please always do your own research.
🚀 Active Development
The SMC Orderblocks Indicator is continuously evolving, with updates aimed at improving the rules for detecting and confirming orderblocks. Future updates may include new features and bug fixes to enhance performance and adapt to different trading styles.
📬 Note: If you encounter a bug, please contact me directly via private message, as I do not want to pollute the comment section with screenshots.
If you have any questions or suggestions for new features, feel free to reach out. You can also add a comment to boost its visibility.
Additionally, it’s recommended to compare the results of this indicator with others to find what best suits your trading style.
Please note that while this indicator is a paid script, you do not need to pay to test it. Contact me directly on TradingView via private message or through my socials, or leave a comment, and I’ll provide you with a free trial.
Market Core [BigBeluga]MARKET CORE Toolkit
The BigBeluga Market Core Toolkit is a comprehensive suite of advanced trading indicators designed to provide traders with a holistic view of market dynamics, structure, and potential opportunities.
In an ever-evolving market, relying on a single indicator can leave traders vulnerable to gaps in their analysis. The BigBeluga Market Core Toolkit addresses this challenge by integrating a range of complementary indicators that work synergistically to reveal the full picture. From detecting key support and resistance levels to identifying market structure shifts, volume imbalances, inefficiencies or analysis of money flow, this toolkit covers every aspect of market behavior.
⬤ Order Blocks
BigBeluga Order Blocks revolutionize the way traders visualize potential areas of significant market activity. Unlike traditional order block indicators that often result in cluttered, noisy charts, these Order Blocks are designed for clarity and effectiveness. They simulate and predict where large areas of market orders may rest by analyzing volume and volatility, providing excellent support or resistance areas.
The blocks offer cleaner chart presentation with reasonable distribution, volume ratio visualization within each block, and categorization into Strong, High and Balanced blocks.
Additionally, a third line has been introduced to rank order blocks by volume using a modified percent rank method for more precise ranking.
This ranking system uses percentile ranks, a concept commonly used in standardized tests. In the context of order blocks, the percentile rank of a particular order block's volume is interpreted as the percentage of the order blocks strength. This method provides a more nuanced and statistically robust way of comparing and prioritizing order blocks.
Key features:
Cleaner chart presentation with reasonable distribution of blocks
Volume ratio visualization within each block (bullish vs bearish)
Categorization into High and Balanced blocks for easy identification of significant levels
Relative volume percentage and volume delta display
Advanced ranking system using modified percent rank method for volume comparison
These Order Blocks help traders:
Forecast excellent support or resistance areas
Gain insight into the balance of the market at specific levels
Identify significant market levels at a glance
Visualize market imbalances through volume delta
Prioritize order blocks based on their relative volume importance
Make more informed decisions about potential entry and exit points
⬤ Beluga Profile
The Beluga Profile is a revolutionary market analysis tool that transforms complex market data into a clear, intuitive visual narrative. At its core, it combines a Dual-Profile Analysis, merging Delta Volume Profile with Money Flow Profile to give traders a comprehensive view of market dynamics.
The percentage scale on the left side aren't just numbers; they represent the Levels Strength Percentage, a crucial ranking system that immediately draws your attention to the most significant price zones. Complementing this, a heat map overlay brings these strength levels to life, offering an instant, color-coded representation of where the market's most influential areas lie.
To the right, a detailed breakdown of volume and money flow for each level provides the hard data behind the visual cues. This granular information allows you to dive deep into the market's structure, understanding not just where the significant levels are, but why they matter.
Below the main chart, the Delta Volume Bar serves as a foundation, showing the average delta of the volume profile. This bar is more than just a measure of volume – it's a window into the underlying forces driving price movement. Just above this bar, a macro trend indicator in the form of an arrow offers a quick, clear signal of the overall market direction based on these delta volume calculations.
But the Beluga Profile doesn't just show you what's happening – it helps you understand the 'why' and 'how'. The Adaptive Points of Interest feature allows you to customize your analysis, focusing on the areas that matter most to your trading strategy. You can select from various options including Money Flow, Delta+, Delta-, Volume+, and Level % (Highest), tailoring the display to your specific analytical needs. This flexibility ensures you can focus on the most relevant data for your trading style. Real-time Active Price Tracking ensures you're always in sync with the latest market movements.
All of these elements work in concert, creating a symphony of market information. They empower you to:
Spot key price levels with uncanny precision
Foresee potential market turns before they happen
Grasp the quality and strength of price moves
Adjust your strategy on the fly as market conditions shift
Develop a holistic understanding of market structure and participant behavior
Make informed decisions backed by a clear view of the overall market trend
In essence, the Beluga Profile isn't just a tool – it's your market storyteller, translating the complex language of price, volume, and money flow into a narrative that you can understand and act upon with confidence.
⬤ Smart Money Concepts (SMC)
The Smart Money Concepts component of the toolkit focuses on automatically detecting key market structures crucial in technical analysis. It identifies and visualizes Break of Structure (BOS) and Change of Character (CHOCH) patterns, helping traders spot potential trend reversals and significant market movements. This includes BOS identification when price breaks previous support or resistance and CHOCH detection for potential trend reversals, with automatic detection of both bullish and bearish patterns.
The latest enhancement to this feature adds a new layer of analysis through Delta Volume Calculation. When a BOS or CHOCH is detected, the toolkit calculates the delta volume within the range from the high or low point to the break point. This analysis considers all the candles in this range and determines whether the volume is predominantly bullish, bearish, or neutral.
Bullish Volume: If the delta volume is bullish, a green diamond is plotted at the high or low point, indicating potential upward momentum.
Bearish Volume: If the delta volume is bearish, a red diamond is plotted, suggesting downward pressure.
Neutral Volume: When the volume is neutral, a yellow diamond is displayed, indicating a balance in buying and selling forces.
This visual representation of volume dynamics provides an additional layer of insight, helping traders assess the strength and direction of price movements following a structure break. You can see an example of this on the attached image, where the diamonds clearly indicate the type of volume driving the breakout.
The toolkit also incorporates Fair Value Gap (FVG) Detection. Fair Value Gaps represent inefficiencies in the market, where there is an imbalance between buy and sell orders. These gaps often act as magnets for price, potentially leading to future reversals or continuations when filled. The toolkit identifies and highlights these gaps, allowing traders to recognize areas where the market may seek to rebalance.
Additionally, Double Top and Bottom Pattern Detection has been integrated, identifying potential reversal points at these classic price formations. Double tops signal potential bearish reversals after a price peak, while double bottoms suggest potential bullish reversals after a price dip. These patterns can be crucial indicators for traders looking to capitalize on upcoming trend changes.
Smart Money Concepts help traders:
Identify potential trend reversals early with a clearer view of market structure.
Recognize significant changes in market structure and volume participation.
Differentiate between temporary pullbacks and genuine trend changes using volume insights (color coded diamonds).
Shows Fair Value gaps which helps to identify price momentum and inefficiencies in the market.
This enhancement ensures that traders can not only see structural changes but also understand the volume behind those moves, leading to more informed and confident trading decisions.
⬤ Support and Resistance Levels
This powerful tool is designed to identify key price levels in the market, providing traders with a clear visual representation of potential support and resistance areas. It goes beyond simple level identification by incorporating a sophisticated ranking system and adjustable sensitivity.
The grading system of levels is a unique feature that evaluates the significance of high and low points in the price action. It takes into consideration how many times the price has touched or interacted with specific levels. This means that levels which have been tested multiple times are given higher importance in the ranking. For example, a price level that has acted as support or resistance three times will be ranked higher than a level that has only been touched once.
By leveraging this grading system, traders can focus on the most significant levels that have repeatedly influenced price action, potentially improving the accuracy of their trading decisions and risk management strategies.
This Support and Resistance Levels indicator helps traders:
Identify and prioritize potential reversal points based on their historical significance and frequency of price interaction
Set more accurate entry and exit points aligned with key market levels, focusing on those with higher ranking
Understand the hierarchical structure of market support and resistance, distinguishing between major and minor levels
Plan stop-loss and take-profit levels with greater precision, using the ranking to gauge the strength of each level
Adapt their analysis to varying market strengths and volatilities, with the ability to filter out less significant levels
Recognize recurring price patterns and potential breakout levels based on the ranked historical price interactions
⬤ How to Use the Toolkit
Each of these indicators, while powerful on its own, works synergistically with the others to provide a more complete picture of the market.
The strength of this toolkit lies in its ability to analyze the market from multiple perspectives
Combining these advanced trading indicators into a cohesive toolkit empowers traders with a comprehensive, multi-dimensional view of the market that no single indicator could provide on its own. The market's complexity demands an approach that goes beyond relying on just one aspect, such as price action, volume, or order flow. Integrating these diverse indicators creates a robust analytical framework that captures the market from multiple angles, leading to more accurate insights and better-informed decision-making.
Analyze Order Blocks to identify potential support/resistance and volume imbalances
Use Beluga Profile for comprehensive market structure and trend analysis
Monitor SMC indicators for potential trend reversals and breakouts
Utilize Support and Resistance Levels for precise entry/exit points and risk management
Combine insights from all tools for a multi-dimensional view of market conditions
⬤ Customization
Each component of the toolkit offers various customization options to suit different trading styles and preferences. These inputs allow traders to adjust settings to better fit their analysis needs and strategies:
Order Blocks
- Order Blocks : Set the amount of Order Blocks on the chart.
- Color Selection : Choose the color for highlighting the order blocks on your chart.
Market Structure
- Sensitivity : Adjust the sensitivity for detecting market structure breaks. Higher sensitivity will detect more granular breaks, while lower sensitivity focuses on more significant movements.
- Data : Enable or disable the display of market structure data.
- Zigzag Option : Toggle Zigzag displays from highs and lows.
S/R (Support and Resistance)
- Sensitivity : Control how sensitive the tool is in detecting support and resistance levels. Lower sensitivity will highlight fewer but stronger levels, while higher sensitivity may reveal more levels.
- Width % : Adjust the width of the support and resistance zones to visually emphasize their importance.
- Color Selection : Choose colors for both support and resistance levels for better clarity.
FVG (Fair Value Gap)
- Max : Set the maximum number of fair value gaps to display. Higher values will show more gaps, while lower values will focus on the most prominent ones.
- Color Selection : Customize the color for the fair value gap areas.
Volume Profile
- Length : Define the look-back period for the volume profile analysis. A longer length considers more historical data, while a shorter length focuses on recent data.
- Levs : Choose the number of volume levels to display, allowing for more or fewer volume bars within the profile.
- BG : Enable or disable background shading for the volume profile.
- HeatMap : Activate or deactivate the heat map overlay for volume intensity visualization.
- POC (Point of Control) : Toggle the Point of Control display and choose between different metrics, such as volume+, money flow, Delta+ and Delta-, Level % (Highesr), to base the POC on.
- Color Selection : Customize the color for the Point of Control line.
These customization options provide traders with the flexibility to tailor the toolkit to their specific trading strategies, enhancing their ability to identify key market signals with precision.
Each component of the toolkit offers various customization options to suit different trading styles and preferences.
The BigBeluga Market Core Toolkit synthesizes complex market data into clear, actionable formats, providing traders with professional-level insights. It's a comprehensive market analysis system that can give traders a significant edge in understanding market behavior and identifying high-probability trade setups. While highly effective, it's recommended to use this toolkit in conjunction with fundamental analysis and sound risk management practices for optimal trading results.
Paid script

Curved Smart Money Concepts Probability (Zeiierman)█ Overview
The Curved Smart Money Concepts Probability indicator, developed by Zeiierman, is a sophisticated trading tool designed to leverage the principles of Smart Money trading. This indicator identifies key market structure points and adapts to changing market conditions, providing traders with actionable insights into market trends and potential reversals. The trading tool stands out due to its unique curved structure and advanced probability features, which enhance its effectiveness and usability for traders.
█ How It Works
The indicator operates by analyzing market data to identify pivotal moments where institutional investors might be influencing price movements. It employs a combination of adaptive trend lengths, multipliers for sensitivity adjustments, and pivot periods to accurately capture market structure shifts. The indicator calculates upper and lower bands based on adaptive sizes and identifies zones of overbought (premium) and oversold (discount) conditions.
Key Features of Probability Calculations
The Curved Smart Money Concepts Probability indicator integrates sophisticated probability calculations to enhance trading decision-making:
Win/Loss Tracking: The indicator tracks the number of successful (win) and unsuccessful (loss) trades based on the identified market structure points (ChoCH, SMS, BMS). This provides a historical context of the indicator's performance.
Probability Percentages: For each market structure point (ChoCH, SMS, BMS), the indicator calculates the probability of the next move being successful or not. This is presented as a percentage, giving traders a quantifiable measure of confidence in the signals.
Dynamic Adaptation: The probability calculations adapt to market conditions by considering the frequency and success rate of the signals, allowing traders to adjust their strategies based on the indicator’s historical accuracy.
Visual Representation: Probabilities are displayed on the chart, helping traders quickly assess the likelihood of future price movements based on past performance.
Key benefits of the Curved Structure
The Curved Smart Money Concepts Probability indicator features a unique curved structure that offers several advantages over traditional linear structures:
Noise Reduction: The curved structure smooths out short-term market fluctuations, reducing the noise often seen in linear structures. This helps traders focus on the true trend direction rather than getting distracted by minor price movements.
Adaptive Sensitivity: The curved structure adjusts its sensitivity based on market conditions. This means it can effectively capture both short-term and long-term trends by dynamically adapting to changes in market volatility, something linear structures struggle with.
Enhanced Trend Detection: By providing a more gradual transition between market phases, the curved structure helps in identifying trends more accurately. This is particularly useful in volatile markets where linear structures might give false signals due to their rigid nature.
Improved Market Structure Analysis: The curved structure's ability to adapt and smooth out irregularities provides a clearer picture of the overall market structure. This clarity is essential for identifying premium and discount zones, as well as mid-range support and resistance levels, which are crucial for effective ICT Smart Money Trading.
█ Terminology
ChoCH (Change of Character): Indicates a potential reversal in market direction. It is identified when the price breaks a significant high or low, suggesting a shift from a bullish to bearish trend or vice versa.
SMS (Smart Money Shift): Represents the transition phase in market structure where smart money begins accumulating or distributing assets. It typically follows a BMS and indicates the start of a new trend.
BMS (Bullish/Bearish Market Structure): Confirms the trend direction. Bullish Market Structure (BMS) confirms an uptrend, while Bearish Market Structure (BMS) confirms a downtrend. It is characterized by a series of higher highs and higher lows (bullish) or lower highs and lower lows (bearish).
Premium: A zone where the price is considered overbought. It is calculated as the upper range of the current market structure and indicates a potential area for selling or shorting.
Mid Range: The midpoint between the high and low of the market structure. It often acts as a support or resistance level, helping traders identify potential reversal or continuation points.
Discount: A zone where the price is considered oversold. It is calculated as the lower range of the current market structure and indicates a potential area for buying or going long.
█ How to Use
Identifying Trends and Reversals: Traders can use the indicator to identify the overall market trend and potential reversal points. By observing the ChoCH, SMS, and BMS signals, traders can gauge whether the market is transitioning into a new trend or continuing the current trend.
Example Strategies
⚪ Trend Following Strategy:
Identify the current market trend using BMS signals.
Enter a trade in the direction of the trend when the price retraces to the mid-range zone.
Set a stop-loss just below the mid-range (for long trades) or above the mid-range (for short trades).
Take profit in the premium/discount zone or when a ChoCH signal indicates a potential reversal.
⚪ Reversal Strategy:
Wait for a ChoCH signal to identify a potential market reversal.
Enter a trade in the direction of the new trend as indicated by the SMS signal.
Set a stop-loss just beyond the recent high (for short trades) or low (for long trades).
Take profit when the price reaches the premium or discount zone opposite to the entry.
█ Settings
Curved Trend Length: Determines the length of the trend used to calculate the adaptive size of the structure. Adjusting this length allows traders to capture either longer-term trends (for smoother curves) or short-term trends (for more reactive curves).
Curved Multiplier: Scales the adjustment factors for the upper and lower bands. Increasing the multiplier widens the bands, reducing sensitivity to price changes. Decreasing it narrows the bands, making the structure more responsive.
Pivot Period: Sets the period for capturing trends. A higher period captures broader trends, while a lower period focuses on short-term trends.
Response Period: Adjusts the structure’s responsiveness. A low value focuses on short-term changes, while a high value smoothens the structure.
Premium/Discount Range: Allows toggling between displaying the active range or previous range to analyze real-time or historical levels.
Structure Candles: Enables the display of curved structure candles on the chart, providing a modified view of price action.
-----------------
Disclaimer
The information contained in my Scripts/Indicators/Ideas/Algos/Systems does not constitute financial advice or a solicitation to buy or sell any securities of any type. I will not accept liability for any loss or damage, including without limitation any loss of profit, which may arise directly or indirectly from the use of or reliance on such information.
All investments involve risk, and the past performance of a security, industry, sector, market, financial product, trading strategy, backtest, or individual's trading does not guarantee future results or returns. Investors are fully responsible for any investment decisions they make. Such decisions should be based solely on an evaluation of their financial circumstances, investment objectives, risk tolerance, and liquidity needs.
My Scripts/Indicators/Ideas/Algos/Systems are only for educational purposes!
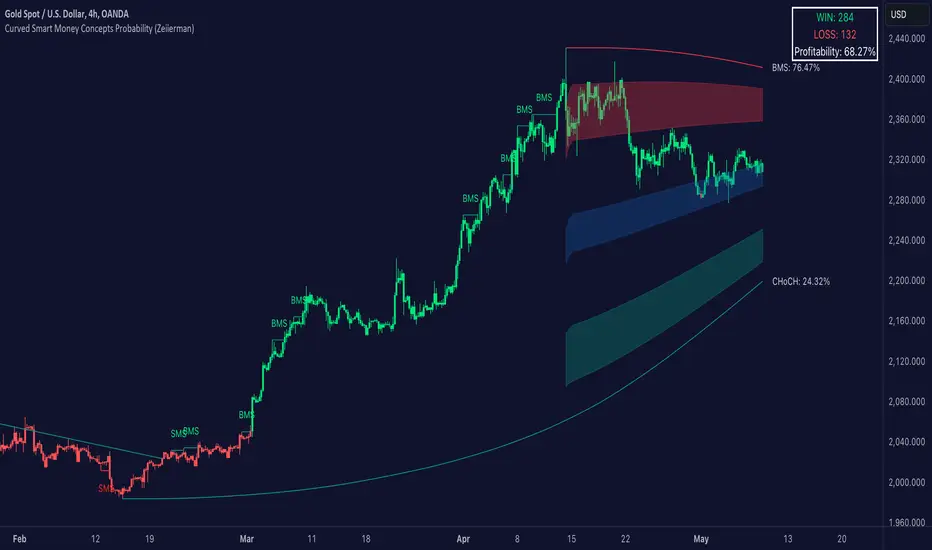
ICT Balance Price Range [UAlgo]The "ICT Balance Price Range " indicator identifies and visualizes potential balance price ranges (BPRs) on a price chart. These ranges are indicative of periods where the market exhibits balance between bullish and bearish forces, often preceding significant price movements.
🔶 What is Balanced Price Range (BPR) ?
Balanced Price Range is a concept based on Fair Value Gap. Balanced price range (BPR) is the area on price chart where two opposite fair value gaps overlap.
When price approaches the Balanced Price Range (BPR), we assume that the price will react quickly and strongly here. This is because its the combination of two fair value gaps and being a good point of interest for smart money traders.
🔶 Key Features:
Bars to Consider: Determines the number of bars to evaluate for BPR conditions.
Threshold for BPR: Sets the minimum range required for a valid BPR to be identified.
Remove Old BPR: Option to automatically remove invalidated BPRs from the chart.
Bearish/Bullish Box Color: Customizable colors for visual representation of bearish and bullish BPRs.
🔶 Disclaimer
This indicator is provided for educational and informational purposes only.
It should not be considered as financial advice or a recommendation to buy or sell any financial instrument.
The use of this indicator involves inherent risks, and users should employ their own judgment and conduct their own research before making any trading decisions. Past performance is not indicative of future results.
🔷 Related Scripts
Fair Value Gaps (FVG)

Smart Money Analysis with Golden/Death Cross [YourTradingSensei]Description of the script "Smart Money Analysis with Golden/Death Cross":
This TradingView script is designed for market analysis based on the concept of "Smart Money" and includes the detection of Golden Cross and Death Cross signals.
Key features of the script:
Moving Averages (SMA):
Two moving averages are calculated: a short-term (50 periods) and a long-term (200 periods).
The intersections of these moving averages are used to determine Golden Cross and Death Cross signals.
High Volume:
The current trading volume is analyzed.
Periods of high volume are identified when the current volume exceeds the average volume by a specified multiplier.
Support and Resistance Levels:
Key support and resistance levels are determined based on the highest and lowest prices over a specified period.
Buy and Sell Signals:
Buy and sell signals are generated based on moving average crossovers, high volume, and the closing price relative to key levels.
Golden Cross and Death Cross:
A Golden Cross occurs when the short-term moving average crosses above the long-term moving average.
A Death Cross occurs when the short-term moving average crosses below the long-term moving average.
These signals are displayed on the chart with text color changes for better visualization.
Using the script:
The script helps traders visualize key signals and levels, aiding in making informed trading decisions based on the behavior of major market players and technical analysis.
Custom candle lighting(CCL) © 2024 by YourTradingSensei is licensed under CC BY-NC-SA 4.0. To view a copy of this license.

SMC Community [algoat] — Smart Money ConceptsEmpower your trading with the core principles of the Smart Money Concepts through interactive features and highly customizable settings.
The indicator's strength lies in the unique SMC Core algorithm, a calculation based on real price action data, capturing every tick from small intraday fluctuations to significant high timeframe movements.
algoat SMC Core is our continually evolving, specialized structure mapping algorithm, serving as the backbone of our price action related publications.
⭐ Key Features
Swing Market Structure: Change of Character, Break of Structure
Recognize and visualize real-time market structures with swing elements. Identify and mark key structural changes in the market to visually highlight shifts in market trends and patterns. This feature is designed to alert you to significant changes in the market's behavior, signaling a potential shift from accumulation to distribution phases, or vice versa. It helps traders adapt their strategies based on evolving market dynamics.
Order Flow: Structure Fractal
Connect the successive structural high and low levels, visualizing the intricate flow of market movements. This feature highlights fractal structures within the market, enabling traders to detect significant price action patterns.
Structure Range: Determine Discount, Premium, and Equilibrium Zones
This feature provides a unique way of visualizing price areas where a security could be overbought or oversold (premium or discount zones) and where the price is expected to be fair and balanced (equilibrium zone). Distance from the current price is displayed in percentage terms, which can assist traders with crucial data for risk management and strategic planning. The Range function helps you identify the most favorable price zones for entries and set your stop-loss and take-profit levels more accurately.
Liquidity Grabs: Reveal Hidden Manipulation Attempts
Identify uncovered market areas where high liquidity trading may take place. Liquidity Grabs help track "smart money" footprints by identifying levels where large institutional traders may have induced liquidity traps. Understanding these traps can aid in avoiding false market moves and optimizing trade entries.
Institutional Interest Zones: Order Blocks and Fair Value Gaps
Uncover areas where bigger orders may be lined up. Reveal zones of interest ordered by volume strength. Receive warnings about market price imbalances.
▸ Order Blocks pinpoint crucial zones where large institutional investors ("smart money") have shown strong buying or selling interest recently. These blocks can serve as a tool for identifying key areas for potential trade entries or exits.
▸ Fair Value Gaps detect discrepancies between the perceived market value and the actual market price, revealing potential areas for price correction. With its mitigation settings, you can fine-tune the FVG detection according to the magnitude of value misalignment you consider significant.
Mitigation types dictate how price interacts with a zone, with order blocks requiring a close through (indicating stronger price movement) and fair value gaps requiring a wick through (hinting at weak rejection).
══════════════════
⭐ Why SMC?
In the ever-evolving trading landscape, mainstream methods and strategies can quickly become outdated as they are widely adopted. Liquidity is constantly sought after, and the best source for this is exploring and exploiting trading strategies that are widely accepted and applied. Currently, one of these strategies is the SMC (Supply, Demand, and Price Action).
It's no coincidence that our educational materials incorporate concepts such as liquidity grabs (LG) and Smart Money Traps (SMT). As the application of SMC gains popularity among retail traders, trading with this approach becomes more challenging. Therefore, the recent focus has been on reforming the SMC methodology, as it is the only method that relies on real price movements and will always work when applied correctly.
The indicator reflects our personal use and deep comprehension of Smart Money Concepts. It provides streamlined tools for tracking algorithmic trends with modern visualizations, without unnecessary clutter.
▸ What does the proper application of SMC entail?
Many SMC traders associate their key areas of interest with the market structure, which is generally considered acceptable. However, depending solely on a single foundation can lead to significant deviations, which may cause notable impacts on trading results. Moreover, if the basis for the market structure calculation is inaccurate, the consequences can be even more severe. It's akin to risking money on a lottery ticket, believing it will be a winner.
Our methodology is different, and it may ensure longevity in the financial markets. The structure remains crucial, but it is not the sole foundation of everything; instead, it serves as a validation tool. Each calculation, such as order blocks (OB), Fair Value Gaps (FVG), liquidity grabs (LG), range analysis, and more, is independent and unique, separate from the structure. However, validation must ultimately come from the structure itself.
We employ individual and high-quality filters: before a function calculation is validated by the structure, it must undergo rigorous testing based on its own set of validation conditions. This approach aims to enhance robustness and accuracy, providing traders with a reliable framework for making informed trading decisions.
▸ An example of structure validation: Order Block with "Swing Sensitivity"
These order blocks will only be displayed and utilized by the script if there is a swing structure validation with a valid break. In other words, the presence of a confirmed swing Change of Character (ChoCh) or Break of Structure (BoS) is essential for the Order Block to be considered valid and relevant.
This approach ensures that the order blocks are aligned with the overall market structure and are not based on isolated or unreliable price movements. Whether it's Fair Value Gaps (FVG), Liquidity Grabs (LG), Range calculations, or other functionalities, the same underlying principle holds true. The background structure calculation serves as a validation mechanism for the data and insights generated by these functions, ensuring they adhere to the specific criteria and rules established within our methodology. By incorporating this robust validation process, traders can have confidence in the reliability and accuracy of the information provided by the indicator, allowing them to make informed trading decisions based on validated data and analysis.
══════════════════
👉 Usage - the general approach
Determine your trading style and build your basic strategy:
The indicator helps you understand your trading style, whether it's swing trading, scalping or another approach. By analyzing the SMC indicator, you gain valuable information about potential market trends, entry and exit points, and overall market sentiment.
Steps:
Identify Trading Style: Determine whether you are a swing trader, scalper, or long-term investor. This will influence how you use the indicator.
Analyze Market Trends: Use the SMC indicator to observe market trends and identify potential entry and exit points.
Adapt Strategies: Adjust your strategies based on the market dynamics revealed by the SMC indicator, such as changes in order flow or market structure.
👉 Example of usage
In the following chart, you'll notice how we've utilized the indicator to formulate a strategic trading approach. We've employed Order Blocks equipped with volume parameters to identify crucial market zones. Simultaneously, we've leveraged swing/internal market structures to gain insights into potential long- and short-term market turnarounds. Lastly, we've examined trend line liquidity zones to pinpoint probable impulses and breakouts within ongoing trends.
Now we can see how the price descended to the order block with the highest volume, which we had previously marked as our point of interest for an entry. As the price closed below the median Order Block, we noted its mitigation. After an internal CHoCH, it's directing us towards the main Order Block as a target.
══════════════════
🧠 General advice
Trading effectively requires a range of techniques, experience, and expertise. From technical analysis to market fundamentals, traders must navigate multiple factors, including market sentiment and economic conditions. However, traders often find themselves overwhelmed by market noise, making it challenging to filter out distractions and make informed decisions. By integrating multiple analytical approaches, traders can tailor their strategies to fit their unique trading styles and objectives.
Confirming signals with other indicators
As with all technical indicators, it is important to confirm potential signals with other analytical tools, such as support and resistance levels, as well as indicators like RSI, MACD, and volume. This helps increase the probability of a successful trade.
Use proper risk management
When using this or any other indicator, it is crucial to have proper risk management in place. Consider implementing stop-loss levels and thoughtful position sizing.
Combining with other technical indicators
Integrate this indicator with other technical indicators to develop a comprehensive trading strategy and provide additional confirmation.
Conduct Thorough Research and Backtesting
Ensure a solid understanding of the indicator and its behavior through thorough research and backtesting before making trading decisions. Consider incorporating fundamental analysis and market sentiment into your trading approach.
══════════════════
⭐ Conclusion
We hold the view that the true path to success is the synergy between the trader and the tool, contrary to the common belief that the tool itself is the sole determinant of profitability. The actual scenario is more nuanced than such an oversimplification. A word to the wise is enough: developed by traders, for traders — pioneering innovations for the modern era.
Risk Notice
Everything provided by algoat — from scripts, tools, and articles to educational materials — is intended solely for educational and informational purposes. Past performance does not assure future returns.
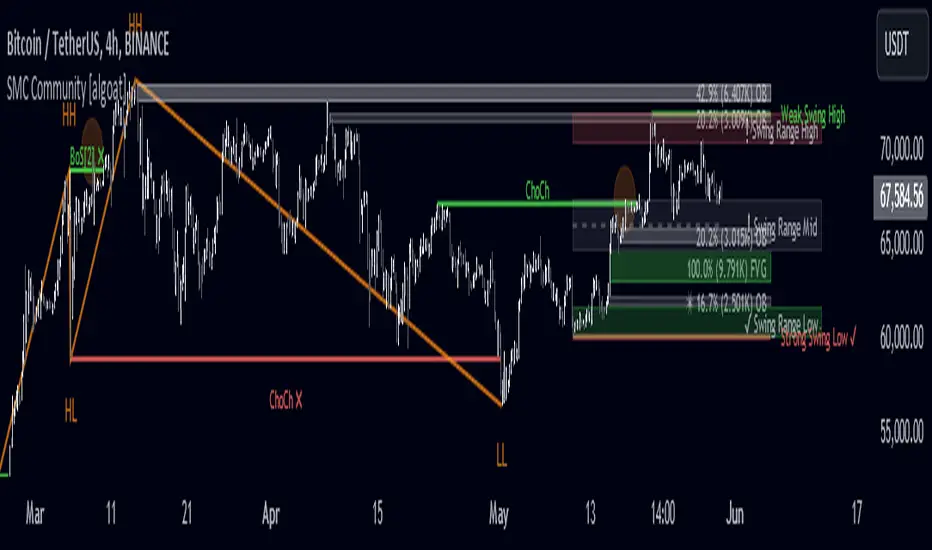
Liquidity Grab Zones | Flux Charts💎 GENERAL OVERVIEW
Introducing our new Liquidity Grab Zones Indicator! This indicator finds liquidity grabs in the current ticker and renders buyside & sellside liquidity grab zones. The retests and breakout of the zones are labeled, and you can set up alerts to get notified. For more information, please check the "HOW DOES IT WORK" section.
Features of the new Liquidity Grab Zones Indicator :
Renders Buyside & Sellside Liquidity Grab Zones
Retests & Breaks
Inverse Zones After Broken Feature
Alerts For All Features
Customizable Algorithm
Customizable Styles
🚩UNIQUENESS
Liquidity grabs can be useful when determining candles that have executed a lot of market orders, so you can plann your trades accordingly. This indicator lets you customize the pivot length and the wick-body ratio for liquidity grabs, provide retest & breakout labels, with customized styling and alerts.
📌 HOW DOES IT WORK ?
Liquidity grabs occur when one of the latest pivots has a false breakout. Then, if the wick to body ratio of the bar is higher than 0.5 (can be changed from the settings) a zone is plotted.
These zones usually indicate areas of high market interest where price action may reverse or accelerate. Identifying these zones can provide traders with critical levels for entering or exiting trades. A breakout of these zones generally mean strong movements are inbound, while failing breakouts make these zones act like support / resistance zones.
The indicator also reverses the type of the zone after an invalidation (can be turned off from the settings). This feature helps traders identify potential reversals more accurately.
The zone width is set to the area from the wick to the body of the candlestick, which can be seen here :
⚙️SETTINGS
1. General Configuration
Pivot Length -> This setting determines the range of the pivots. This means a candle has to have the highest / lowest wick of the previous X bars and the next X bars to become a high / low pivot.
Wick-Body Ratio -> After a pivot has a false breakout, the wick-body ratio of the latest candle is tested. The resulting ratio must be higher than this setting for it to be considered as a liquidity grab.
Zone Invalidation -> Select between Wick & Close price for Liquidity Grab Zone Invalidation.
Use these customizable settings to fine-tune the indicator according to your trading strategy and preferences.
