SPDR Sectors TableThis script generates an interactive and customizable SPDR Sectors Table designed to monitor and analyze the performance of the 11 main sectors of the S&P 500 via sector-specific ETFs. It offers a dynamic overview of daily or periodic sector movements, making it a valuable tool for traders, analysts, and investors implementing sector rotation strategies.
█ DEFINITIONS
SPDR Sectors ETFs are exchange-traded funds managed by State Street Global Advisors, which divide the S&P 500 into the following 11 sectors:
- Communication Services (XLC)
- Consumer Discretionary (XLY)
- Consumer Staples (XLP)
- Energy (XLE)
- Financials (XLF)
- Health Care (XLV)
- Industrials (XLI)
- Materials (XLB)
- Real Estate (XLRE)
- Technology (XLK)
- Utilities (XLU)
These ETFs aim to replicate the performance of their respective sectors as defined by the Global Industry Classification Standard (GICS). The funds are periodically rebalanced to match changes in the S&P 500 composition, offering an accurate snapshot of sectoral trends.
█ INDICATOR
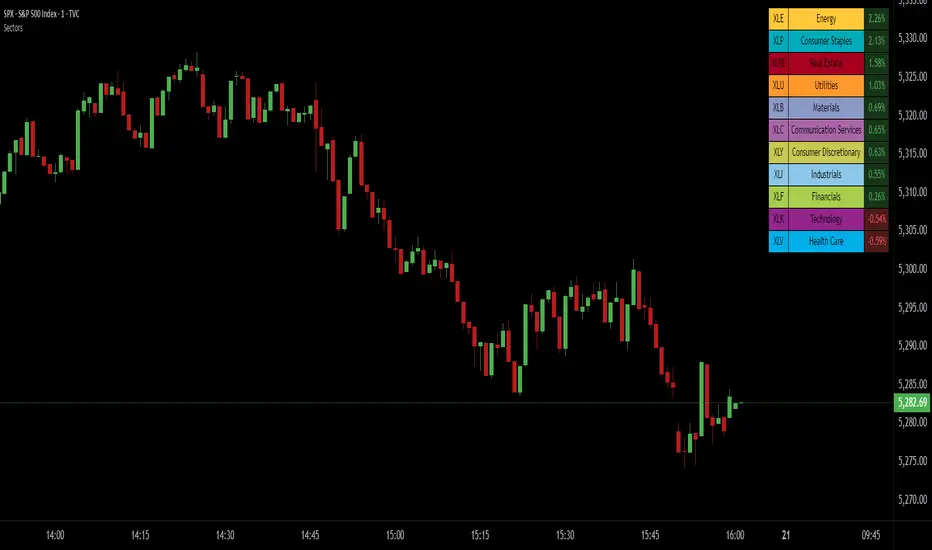
The table displays each sector's ticker and full name, following official GICS terminology and SPDR color coding. It also shows percentage performance, calculated daily on intraday charts or based on the selected time frame.
Users can sort the table by either percentage performance or the relative weight of each ETF in the S&P 500. The default weight values reflect data updated as of 17 April 2025, and can be manually adjusted based on the most recent sector weightings available on the official SPDR website.
Spdr
SPDR TrackerMonitor all SPDR Index Funds in one location! The purpose of this indicator is to review which sectors are trend up vs down to better manage risk against SPY, other funds and/or individual stocks.
With this indicator it may become more apparent which sectors to begin investment in that are at lows compared to others, or use it to determine which stocks may be undervalued or overvalued against SPY.
There is a small table at the bottom where each fund symbol is presented along with it's mode value, last period change as well as last period volume - there's a tooltip that shows the description for each symbol for a quick reminder.
Review the configuration pane where:
Individual funds can have their visibility toggled
Change funds colors
Adjust display mode for each fund (SMA, EMA, VWMA, BBW, Change, ATR, VWAP - many more!)
Some presentation modes may look better on some timeframes vs others, adjust lengths and use anchor point for VWAP.
Future updates may bring about new features, I have some code organization and refactoring to do but wanted to share the idea anyways.
Feel free to drop any suggestions for feature enhancement and I hope it brings success to many, enjoy.

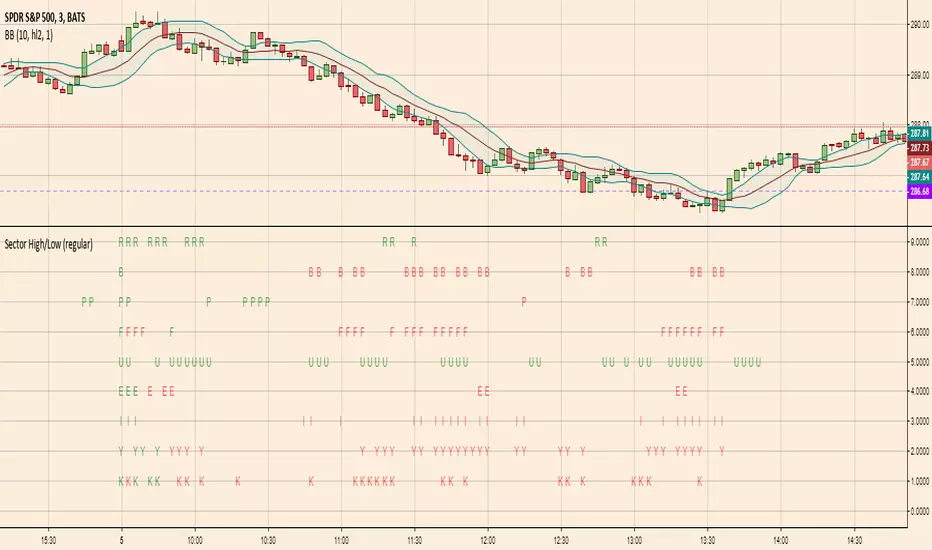
Sector High/LowHighlights which S&P SPDR Sector ETFs are at highs of day (green letter) or lows of day (red letter)
The first candle of the day is always all-green because by default the first candle of the day has the high of the day. So this indicator is more meaningful later in the day when sectors are making repeated highs/lows