IDLP – Intraday Daily Levels Pro [FXSMARTLAB]🔥 IDLP – Intraday Daily Levels Pro
IDLP – Intraday Daily Levels Pro is a precision toolkit for intraday traders who rely on objective daily structure instead of repainting indicators and noisy signals.
Every level plotted by IDLP is derived from one simple rule:
Today’s trading decisions must be based on completed market data only.
That means:
✅ No use of the current day’s unfinished data for levels
✅ No lookahead
✅ No hidden repaint behavior
IDLP reconstructs the previous trading day from the intraday chart and then projects that structure forward onto the current session, giving you a stable, institutional-style intraday map.
🧱 1. Previous Daily Levels (Core Structure)
IDLP extracts and displays the full previous daily structure, which you can toggle on/off individually via the inputs:
Previous Daily High (PDH)
Previous Daily Low (PDL)
Previous Daily Open
Previous Daily Close,
Previous Daily Mid (50% of the range)
Previous Daily Q1 (25% of the range)
Previous Daily Q3 (75% of the range)
All of these come from the day that just closed and are then locked for the entire current session.
What these levels tell you:
PDH / PDL – true extremes of yesterday’s price action (liquidity zones, breakout/reversal points).
Previous Daily Open / Close – how the market positioned itself between session start and end
Mid (50%) – equilibrium level of the previous day’s auction.
Q1 / Q3 (25% / 75%) internal structure of the previous day’s range, dividing it into four equal zones and helping you see if price is trading in the lower, middle, or upper quarter of yesterday’s range.
All these levels are non-repaint: once the day is completed, they are fixed and never change when you scroll, replay, or backtest.
🎯 2. Previous Day Pivot System (P, S1, S2, R1, R2)
IDLP includes a classic floor-trader pivot grid, but critically:
It is calculated only from the previous day’s high, low, and close.
So for the current session, the following are fixed:
Pivot P – central reference level of the previous day.
Support 1 (S1) and Support 2 (S2)
Resistance 1 (R1) and Resistance 2 (R2)
These levels are widely used by institutional desks and algos to structure:
mean-reversion plays, breakout zones, intraday targets, and risk placement.
Everything in this section is non-repaint because it only uses the previous day’s fully closed OHLC.
📏 3. 1-Day ADR Bands Around Previous Daily Open
Instead of a multi-day ADR, IDLP uses a pure 1-Day ADR logic:
ADR = Range of the previous day
ADR = PDH − PDL
From that, IDLP builds two clean bands centered around the previous daily Open:
ADR Upper Band = Previous Day Open + (ADR × Multiplier)
ADR Lower Band = Previous Day Open − (ADR × Multiplier)
The multiplier is user-controlled in the inputs:
ADR Multiplier (default: 0.8)
This lets you choose how “tight” or “wide” you want the ADR envelope to be around the previous day’s open.
Typical use cases:
Identify realistic intraday extension targets, Spot exhaustion moves beyond ADR bands, Frame reversals after reaching volatility extremes, Align trades with or against volatility expansion
Again, since ADR is calculated only from the completed previous day, these bands are totally non-repaint during the current session.
🔒 4. True Non-Repaint Architecture
The internal logic of IDLP is built to guarantee non-repaint behavior:
It reconstructs each day using time("D") and tracks:
dayOpen, dayHigh, dayLow, dayClose for the current day
prevDayOpen, prevDayHigh, prevDayLow, prevDayClose for the previous day
At the moment a new day starts:
The “current day” gets “frozen” into prevDay*
These prevDay* values then drive: Previous Daily Levels, Pivots, ADR.
During the current day:
All these “previous day” values stay fixed, no matter what happens.
They do not move in real time, they do not shift in replay.
This means:
What you see in the past is exactly what you would have seen live.
No fake backtests.
No illusion of perfection from repainting behavior.
🎯 5. Designed For Intraday Traders
IDLP – Intraday Daily Levels Pro is made for:
- Day traders and scalpers
- Index and FX traders
- Prop firm challenge trading
- Traders using ICT/SMC-style levels, liquidity, and range logic
- Anyone who wants a clean, institutional-style daily framework without noise
You get:
Previous Day OHLC
Mid / Q1 / Q3 of the previous range
Previous-Day Pivots (P, S1, S2, R1, R2)
1-Day ADR Bands around Previous Day Open
All calculated only from closed data, updated once per day, and then locked.
Spot

CB Spot v BN Futs Premium by Chop324Coinbase Spot vs Binance Futures Premium Tracker
What This Indicator Does:
This indicator automatically tracks the price premium or discount between Coinbase spot prices and Binance perpetual futures for any cryptocurrency you're viewing. It works dynamically with whatever ticker you load it on - no manual configuration needed.
How It Works:
The script extracts the base currency from your current chart (BTC, ETH, SOL, etc.) and automatically constructs the corresponding tickers:
Coinbase Spot: COINBASE: USD
Binance Perpetual Futures: BINANCE: USDT.P
It then calculates the simple price difference: Coinbase Spot - Binance Futures
Visual Display:
The premium/discount is plotted as a histogram:
Green columns: Coinbase trading at a premium (higher than Binance)
Red columns: Coinbase trading at a discount (lower than Binance)
Baseline at 0: Represents price parity between exchanges
Why This Matters:
Coinbase premium is a useful market sentiment indicator, particularly for institutional/US retail activity:
Positive premium: Often indicates strong US-based buying pressure
Negative premium: May suggest selling pressure or capital flowing to offshore exchanges
Extreme deviations: Can signal localized supply/demand imbalances or arbitrage opportunities
Usage:
Simply load the indicator on any crypto chart (BTCUSDT, ETHUSDT, SOLUSDT, etc.) and it will automatically display the premium/discount for that asset.
Note: Requires both Coinbase spot and Binance perpetual futures data to be available for the symbol you're viewing.

BTC Perp-Spot PremiumBTC Perp‑Spot Premium w/ EMA Cross
This indicator measures the premium or discount between BTC spot prices and perpetual futures across major exchanges. It visualizes real-time sentiment in the derivatives market and identifies potential inflection points by comparing the behavior of spot traders (real demand) and perp traders (speculative positioning).
What It Does
Calculates the premium spread
Shows the percentage difference between perp and spot prices as a color-coded histogram. Blue bars indicate perps trading above spot (aggressive longs), while red bars suggest perps below spot (risk-off or bearish positioning).
7-exchange composite data feed
Uses a robust average of six perpetual futures sources and seven spot market sources across Binance, Bybit, OKX, Coinbase, Bitfinex, Kraken, and Bitstamp for a balanced and high-fidelity view.
EMA crossover signals
Includes a customizable EMA and MA of the premium. Crossovers are visualized with subtle circle markers to signal sentiment shifts—blue for EMA crossing above, red for crossing below.
Zero baseline
A horizontal line at zero makes it easy to identify when perps flip from premium to discount territory and vice versa.
Dynamic stats table
Displays live values for the perp average, spot average, and premium % in a neatly formatted corner table.
Why It's Useful
This tool helps traders:
Monitor market sentiment and speculative aggression
Spot inefficiencies between derivatives and spot markets
Identify early reversal or continuation signals
Track potential liquidation zones or trend exhaustion
Confirm breakouts with perp/spot alignment
Whether you're trading short-term momentum or watching for mean-reverting setups, this premium analysis tool brings deeper context to BTC price action directly on your chart.

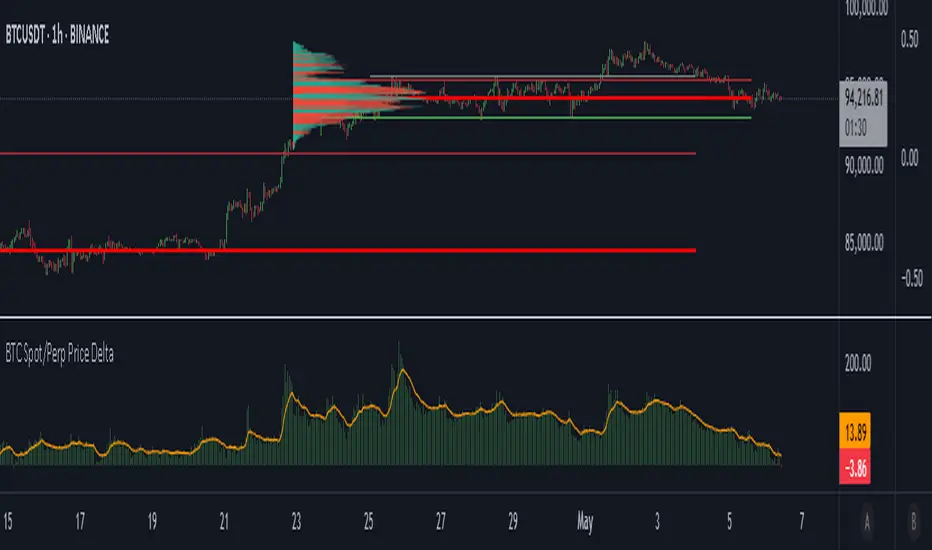
BTC Spot/Perp Price DeltaThe indicator gathers price from 3 btc spot pairs (largest by volume) and 3 btc perp pairs (also largest by volume).
The average Spot and Perp prices are then derived.
The indicator plots the price difference between the Spot average and the Perps average (Spot minus Perps).
Green plot above the zero line means Spot price is higher than the Perp price at a candle close - Contango.
Red plot below the zero line means Spot Price is lower than the Perp price at a candle close - Backwardation.
The orange line is the EMA. Default value is 100 periods. Changeable by User.
Use cases:
1. Perp market is way larger than the Spot market, measured by traded Volume. We may say that the Perps market is more "stable", because it is more liquid. When Spot price deviates a lot from the Perps price, in both positive and negative directions, we may expect a mean reversion.
High Green or Red indicator values = expect price reversion.
2. Helps to observe absorption. If the indicator values are high (in both directions), but the price is barely moving, we can come to a conclusion that the opposite side Limit orders are being deployed to absorb Spot market orders.
Typically, this also indicates mean reversion.
3. You are welcome to use the indicator and perhaps find your own use cases.
Any suggestions on how to improve this indicator are welcome.
Spot Vs Perp PremiumThis indicator visualizes the price premium or discount between spot and perpetual futures markets for any crypto asset, using data from Binance, OKX, and Bybit. It helps traders track sentiment shifts, uncover arbitrage signals, and identify potential short-term reversals or continuation moves based on how aggressively traders are positioned in derivatives relative to the spot market.
What It Does
- Calculates the premium:
The difference between spot price and perp price is shown as a histogram. A positive premium (spot > perp) suggests cautious or bearish perp traders, while a negative premium (perp > spot) may indicate aggressive long positioning or speculative activity.
Supports multiple venues:
You can toggle between Binance, OKX, Bybit, or view a 3-exchange average for a more smoothed view.
Automatic pair detection:
The script auto-detects the base and quote currency from your active chart, dynamically tracking the correct spot and perp contracts for the asset you're analyzing.
Invert option:
Flip the calculation to view the perp premium instead of the spot premium, useful for comparing directional funding bias or for personal preference in visual analysis.
Optional moving average:
Smooth the premium signal over time to track sustained shifts in sentiment and filter out noise.
Table display:
Displays the real-time premium value in the corner of the chart for clarity.
Why It's Useful
This tool gives insight into derivatives trader behavior vs real market pricing. Spot prices reflect actual buying/selling of assets, while perpetual futures are often driven by speculation, leverage, and short-term positioning. When these diverge significantly, it often precedes market inflection points:
- Perp trading above spot (negative premium): excessive long exposure, potential for mean reversion or liquidations.
- Perp trading below spot (positive premium): risk-off behavior or hedging, potential for squeeze or unwind.
You can use this indicator to:
- Anticipate liquidation-driven moves
- Spot early signs of trend exhaustion
- Confirm breakout strength with perp alignment
- Monitor crowd positioning in real-time
Inputs
- Exchange – Select from Binance, OKX, Bybit, or average all three
- Inverse Premium – Flip the calculation to see perp - spot instead
- Show MA – Overlay a moving average for premium smoothing
- Show Table – Toggle live premium table display
- MA Period – Customize the smoothing window
Enjoy! Please comment and like!
BINANCE-BYBIT Cross Chart: Spot-Perpetual CorrelationName: "Binance-Bybit Cross Chart: Spot-Perpetual Correlation"
Category: Scalping, Trend Analysis
Timeframe: 1M, 5M, 30M, 1D (depending on the specific technique)
Technical analysis: This indicator facilitates a comparison between the price movements shown on the Binance spot chart and the Bybit perpetual chart, with the aim of discerning the correlation between the two charts and identifying the dominant market trends. It automatically generates the corresponding chart based on the ticker selected in the primary chart. When a Binance pair is selected in the main chart, the indicator replicates the Bybit perpetual chart for the same pair and timeframe, and vice versa, selecting the Bybit perpetual chart as the primary chart generates the Binance spot chart.
Suggested use: You can utilize this tool to conduct altcoin trading on Binance or Bybit, facilitating the comparison of price actions and real-time monitoring of trigger point sensitivity across both exchanges. We recommend prioritizing the Binance Spot chart in the main panel due to its typically longer historical data availability compared to Bybit.
The primary objective is to efficiently and automatically manage the following three aspects:
- Data history analysis for higher timeframes, leveraging the extensive historical data of the Binance spot market. Variations in indicators such as slow moving averages may arise due to differences in historical data between exchanges.
- Assessment of coin liquidity on both exchanges by observing candlestick consistency on smaller timeframes or the absence of gaps. In the crypto market, clean charts devoid of gaps indicate dominance and offer enhanced reliability.
- Identification of precise trigger point levels, including daily, previous day, or previous week highs and lows, which serve as sensitive areas for breakout or reversal operations.
All-Time High (ATH) and All-Time Low (ATL) levels may vary significantly across exchanges due to disparities in historical data series.
This tool empowers traders to make informed decisions by leveraging historical data, liquidity insights, and precise trigger point identification across Binance Spot and Bybit Perpetual market.
Configuration:
EMA length:
- EMA 1: Default 5, user configurable
- EMA 2: Default 10, user configurable
- EMA 3: Default 60, user configurable
- EMA 4: Default 223, user configurable
- Additional Average: Optional display of an additional average, such as a 20-period average.
Chart Elements:
- Session separator: Indicates the beginning of the current session (in blue)
- Background: Indicates an uptrend (60 > 223) with a green background and a downtrend (60 < 223) with a red background.
Instruments:
- EMA Daily: Shows daily averages on an intraday timeframe.
- EMA levels 1h - 30m: Shows the levels of the 1g-30m EMAs.
- EMA Levels Highest TF: Provides the option to select additional EMA levels from the major timeframes, customizable via the drop-down menu.
- "Hammer Detector: Marks hammers with a green triangle and inverted hammers with a red triangle on the chart
- "Azzeramento" signal on TF > 30m: Indicates a small candlestick on the EMA after a dump.
- "No Fomo" signal on TF < 30m: Indicates a hyperextended movement.
Trigger Points:
- Today's highs and lows: Shows the opening price of the day's candlestick, along with the day's highs and lows (high in purple, low in red, open in green).
- Yesterday's highs and lows: Displays the opening price of the daily candlestick, along with the previous day's highs and lows (high in yellow, low in red).
You can customize the colors in "Settings" > "Style".
It is best used with the Scalping The Bull indicator on the main panel.
Credits:
@tumiza999: for tests and suggestions.
Thanks for your attention, happy to support the TradingView community.

Crypto Spot/Futures Dominance Indicator with AlertsFutures/Spot Dominance Indicator:
Overview:
The futures/spot dominance indicator is a versatile tool used by traders and analysts to assess the relative strength or dominance of the futures market in relation to the spot (or cash) market for a specific asset. It offers insights into market sentiment, potential arbitrage opportunities, and risk management while incorporating the VWAP indicator for added context.
How It Works:
This indicator automatically detects and adapts to the futures symbol applied to the chart, simplifying the setup for traders. However, it still necessitates manual input of the corresponding spot pair to ensure accuracy.
Automatic Futures Symbol Detection: The indicator starts by automatically detecting the futures symbol on the trading chart, eliminating the need for manual configuration. This ensures that the indicator is applied to the correct futures contract.
Manual Spot Pair Entry: To provide a reliable reference point for the comparison, traders must manually input the corresponding spot symbol via the indicator's inputs. For instance, if the indicator detects the BTCUSDT.P futures symbol, traders would manually enter the BTCUSDT spot symbol.
Gathering Data: The indicator collects historical price data for both the detected futures contract and the manually specified spot symbol. This data includes open, high, low, and close prices, as well as trading volume.
VWAP Calculation: To gain a deeper understanding of price trends and market dynamics, the indicator calculates the VWAP (Volume Weighted Average Price) for both the futures and spot markets. The VWAP places more weight on prices with higher trading volume, offering a weighted average that reflects market consensus.
Premium/Discount Calculation: By subtracting the VWAP of the spot market from the VWAP of the futures market, the indicator quantifies the premium or discount of the futures price concerning the spot price. A positive value indicates a premium, while a negative value suggests a discount.
Plotting: The premium/discount value is displayed as a line on the chart, often alongside moving averages or other smoothing techniques for improved trend analysis.
Alerts: In addition to its analysis capabilities, this indicator now includes alerts to enhance your trading experience. It alerts you in the following scenarios:
Premium Above Average: Notifies you when the premium crosses above the average line.
Premium Below Average: Alerts you when the premium crosses below the average line.
Premium Above Zero: Provides an alert when the premium crosses above the zero line.
Premium Below Zero: Generates an alert when the premium crosses below the zero line.
Benefits of the Futures/Spot Dominance Indicator:
Sentiment Analysis: Traders use the indicator to assess market sentiment. A futures premium might signify bullish sentiment, while a discount could indicate bearish sentiment.
Arbitrage Opportunities: Identifying price discrepancies between futures and spot markets can help traders spot arbitrage opportunities, where they can profit from price differentials.
Risk Management: The indicator assists in evaluating risks associated with futures positions, helping traders manage their exposure effectively.
Trend Confirmation: When used in conjunction with other technical indicators, futures/spot dominance, along with VWAP, can provide additional confirmation of price trends.
Hedging: Investors and corporations use this tool to gauge the effectiveness of hedging strategies based on futures contracts.
Speculative Trading: Traders and investors use the indicator to inform speculative positions, aligning their trades with perceived market strength or weakness.
Insightful Analysis: Futures/spot dominance analysis, enriched by VWAP data, offers insights into market behavior during specific events or changes in economic conditions.
In summary, the futures/spot dominance indicator, with its integration of VWAP and automatic futures symbol detection, provides traders and investors with a comprehensive tool to assess market dynamics. It aids in sentiment analysis, risk management, and trend confirmation while offering potential arbitrage opportunities. The newly added alerts enhance the indicator's functionality, providing timely notifications of key market events. However, it relies on manual input of the corresponding spot pair to ensure precise comparisons between futures and spot markets. It should be used alongside other analysis techniques for a well-rounded view of the market.

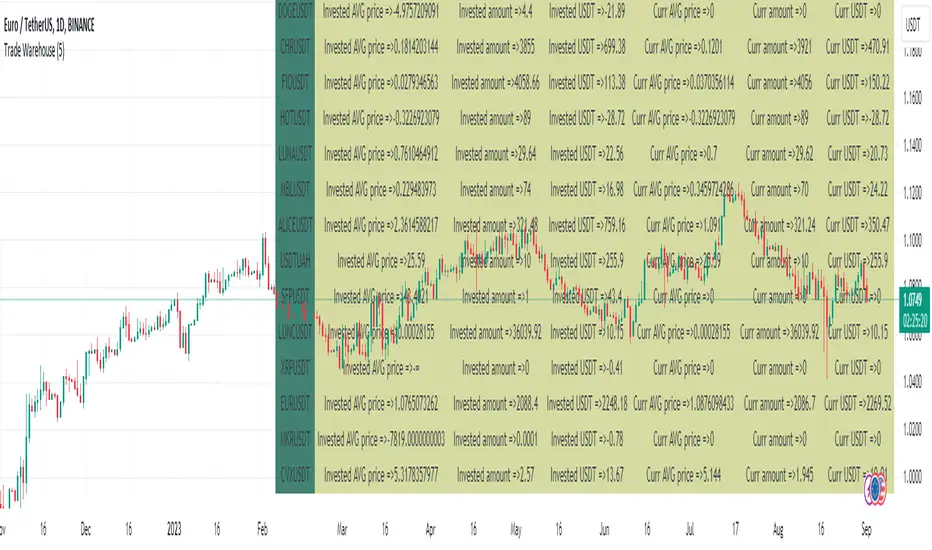
Trade Warehouse (SPOT trades)Hello there!
Let's imagine You are trading SPOT, buy more and more every new dump, but bear market is not going to stop... and your first trade was 3 YEARS AGO!!!
Can't believe it is true.
The problem is - exchanges allow You to see only new trades last 6 months(Binance). But I want to see all of them! How do I know AVG Price?
This script is my solution. Just use it to track and store your trade, so You can see AVG without uploading old trades everytime and using calculator.
Script description:
Here You can see the "Trade" type of variable. Python script using Pandas converts trades from .csv file into string type that You can input as trade(price, pair, amount, date..). After it uppends to the trades_array and pushed into the loop.
If trade date is more than current cundle - it pushes new trade to other arrays such a "pair", "avg_tot" etc. to comput it later.
If trade was buy - it increase invested capital and owned amount, opposite for sell and recomputs AVG price.
Since script has at least 1 trade it starts to plot AVG price.
There are 2 AVG price:
1. For total invested counting(You can get negative value if traded successful)
2. Current AVG price since last 0 currency amount(there is dust value to set how many usd we take as dust)
Table represents all assets statistics
Just upload your trades only 1 time, use script to convert it into pine code, and use as indicator. This script allow You to see ALL trades from oldest to the newest.
github.com/Arivadis/...w_Tradings_warehouse
If this script helped You - press Star (on GitHub) Like (on TradingView)
Warning -
Does not include free/earn/withdraw/deposit counting. Only Buy and Sell =>
This script has no idea about your side currency deposits, so if You got Your BTC or EUR or .. from another wallet and sold later - it can break your statistical data. Add this transfer manually(see examples inside script).
Use my github manual to get this script workin.
Installing takes around 3 minutes and contains 3-5 steps
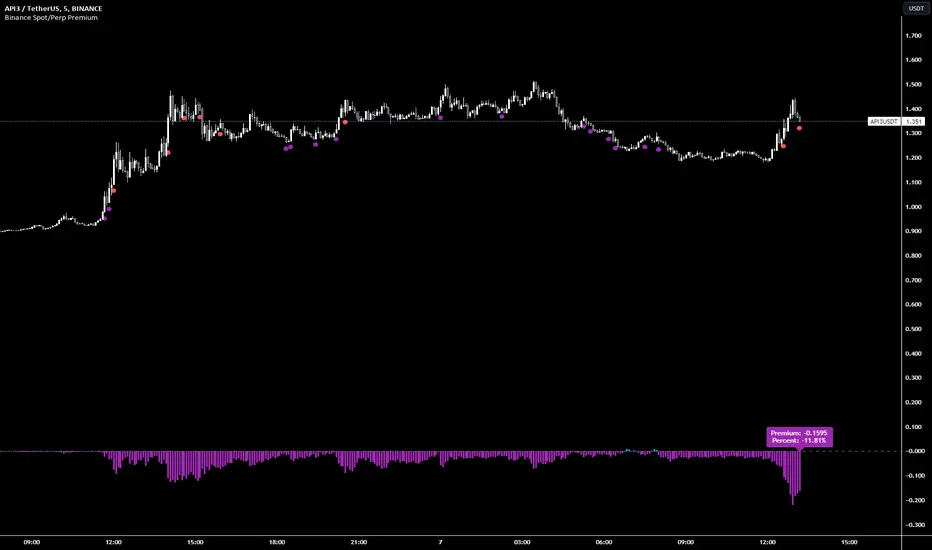
Binance Spot/Perp Premium | PCPR1NCIPALBinance Spot/Perp Premium Indicator
This indicator visually shows the price difference (called "Premium") between the perpetual contract and the spot market of a particular cryptocurrency on Binance.
Histogram: Displays the premium amount. Positive values are shown in blue and negative values in purple.
Blue Circle: Appears below the bar when the premium goes over 1% and there hasn't been a purple circle in the past 90 minutes.
Purple Circle: Appears below the bar when the premium drops below -1% and there hasn't been a blue circle in the past 90 minutes.
Green Circle: Shows up below the bar when the premium exceeds 5%. A new circle can appear every 15 minutes if the condition is met.
Red Circle: Appears below the bar when the premium drops more than -5%. After a red circle, there's a 30-minute cooldown before another can appear.
A label at the bottom displays the current premium amount and its percentage, helping users quickly gauge the market situation.
Annualized Spot-Future DifferenceThe "Annualized Spot-Future Difference" indicator (ASFD) compares the closing prices of a futures contract and its underlying spot asset. It calculates the price difference between the two instruments and annualizes this difference to provide a standardized measure for comparison.
The indicator takes inputs for the futures ticker symbol and the spot ticker symbol, allowing flexibility in selecting the specific assets for analysis. Additionally, it allows the user to input the contract date, which represents the expiration date of the futures contract.
The ASFD indicator plots the annualized difference between the futures and spot prices. It calculates the price difference by subtracting the spot price from the futures price. To annualize this difference, it considers the remaining days to the contract expiration and scales the difference accordingly.
The annualized difference can provide insights into market expectations, as it reflects the market's perception of the future price movement of the underlying asset. A positive value indicates that the futures price is higher than the spot price, potentially suggesting bullish sentiment. Conversely, a negative value suggests bearish sentiment, with the futures price lower than the spot price.
Traders and analysts can utilize the ASFD indicator to identify potential opportunities for arbitrage or evaluate market sentiment regarding the underlying asset. By monitoring changes in the annualized difference over time, they can gain insights into market dynamics and make informed trading decisions.
It's important to note that the ASFD indicator relies on accurate and up-to-date pricing data for both the futures and spot assets. Traders should verify that the selected ticker symbols correspond to the desired instruments and ensure that the contract date aligns with the relevant futures contract expiration.
Overall, the ASFD indicator provides a quantitative measure of the annualized price difference between futures and spot assets, enabling traders and analysts to assess market expectations and identify potential trading opportunities.

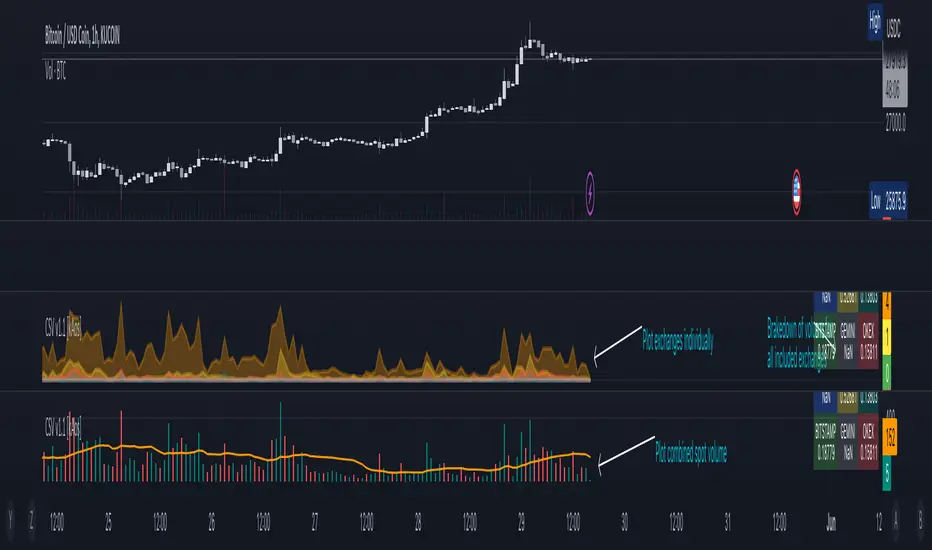
Combined Spot Volume | Crypto v1.1 [kAos]This script combines the "ticker volume" from 9 different exchanges. The default settings are for Crypto Assets only. In the settings window you can choose to plot the "combined volume" in a histogram form or "individual exchange volume" in an area view. (as shown on the chart) Addition to the plots there is also an Info Table in the bottom right corner that brakes down the volume to individual exchanges, shows how much volume was traded on which exchange. If the Table shows "NaN" on an exchange you need to check the spelling of that exchange, if thats correct, than the ticker is not available on that exchange.
Binance Auto Spot-Futures Premium/Discount -CheThis Script is based in the 2020 @Plumptoiletduck script
Special thanks to @tartigradia for the Auto Detect code for the Binance pair.
It tells us the difference in price between Spot and Perpetual Futures.
Now I incorporated the function that automatically detects the pair we are in to show the premium/discount of that pair.
You never need to select the currency you are in the script anymore!
It is specially designed for Binance coins, it includes all perpetuals.
How to use it?
Usually if the Futures are higher than the Spot it indicates that we are in an over exposure zone of longs in futures.
If the spot is cheaper than the futures it means that the futures are more fearful.
You can use this script with an Open Interest script to get an idea of what is going on.
Other examples:
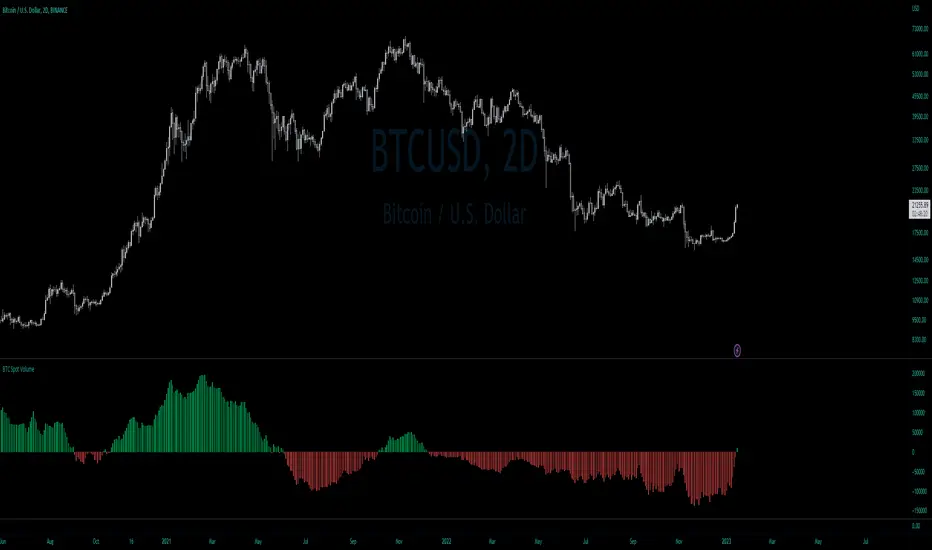
BTC Net Volume (Spot) (by JaggedSoft, fixed by SLN)• WHAT:
This indicator plots the aggregated net volume delta of BTC spot pairs from 8 exchanges over the last 60 periods (default settings).
Tracks the following pairs:
"BINANCE:BTCUSDT"
"BITFINEX:BTCUSD"
"POLONIEX:BTCUSDT"
"BITTREX:BTCUSDT"
"COINBASE:BTCUSD"
"BITSTAMP:BTCUSD"
"KRAKEN:XBTUSD"
"BITGET:BTCUSDT"
"GEMINI:BTCUSD"
• HOW TO USE:
Used for confirmation when watching futures that can experience quick movements in the form of liquidation-events. If the oscillator is green or trending upward, it's confirming a positive bias. The inverse is true for a negative bias. This is especially true on higher timeframes.
Can also be used to find correlations between different tech-assets.
• NOTES:
I forked JaggedSofts indicator to fix the data-source error it was having. Let me know if you want to customize exchanges or add more pairs, maybe I can add that in the future!
This indicator replaces the outdated alternative linked here : Please only use this one
• LIMITATIONS:
Only tested with normal japanese candlesticks .
• THANKS:
to the creator of this script, JaggedSoft. It's a great indicator!
• DISCLAIMER:
Not financial Advice, use at your own risk.
BankNifty VWAP VWAP - Volume-Weighted Average price ( VWAP )
The script draws Daily VWAP for BANKNIFTY SPOT , based on Futures Volume or underlying Index Stocks based on user input
BANKNIFTY INDICES IS THE WEIGHTAGE OF 12 STOCKS AS DECIDED BY EXCHANGE.
BANKNIFTY VWAP CALCULATES THE COMBINED VWAP OF THESE 12 STOCKS AND GENERATES VWAP FOR BANKNIFTY
It works with NIFTY as well. Please change the Symbol and Futures Volume symbol to "NSE:NIFTY" and "NSE:NIFTY1!"
NIFTY INDICES IS THE WEIGHTAGE OF 50 STOCKS AS DECIDED BY EXCHANGE.
NIFTY VWAP CALCULATES THE COMBINED VWAP OF THESE 50 STOCKS AND GENERATES VWAP FOR NIFTY
This script is intended for educational purposes only.
03/07/2022 WEIGHT AGE OF INDEX STOCKS (%)
HDFC Bank Ltd. - 27.63
ICICI Bank Ltd. - 22.98
Kotak Mahindra Bank Ltd. - 11.40
State Bank of India - 11.73
Axis Bank Ltd. - 11.6
IndusInd Bank Ltd. - 5.03
AU Small Finance Bank - Ltd. 2.54
Bandhan Bank Ltd. - 1.98
Bank of Baroda - 1.76
Federal Bank Ltd.- 1.76
PNB - 0.84
IDFC First Bank - 0.95

Spot [FTX] [Moto]Hello traders,
This indicator was primarily designed to show the dominating influence of the underlying spot asset while trading perpetual futures , specifically on FTX.
IMPORTANT: In order for this indicator to work properly/accurately you must be observing an FTX Perpetual future chart. The indicator detects which perpetual future symbol you're observing and changes its comparative metrics accordingly. If you're observing some other chart family, it will either be inaccurate or show nothing.
In my opinion spot price and metrics are more important to observe than derivatives. If I'm looking for entries or exits I want to know that spot is leading the way, and with evidential conviction. This indicator/signal is designed to be used in context and not to be the sole metrics observed. By comparing the spot chart metrics and the respective spot chart metrics, one is able to ascertain which candles are predominantly 'lead' or dominant via spot price action or conversely derivative lead. Generally, I've found, derivative lead moves have a highly likelihood of reverting
1) Spot engulfing - When spot has exerted control successfully on the current candlestick
This and other plot shapes contain plot shape sizing options and are optionally filtered via the cycled Rsi in the inputs
Smaller plot shapes (auto-sized) show when the candle is spot influenced, but not engulfing .
2) Spot Candle reversals - "E" and "e" plot shapes
These signals are sequential engulfing and opposing candles. "E" being when sequential engulfing candles print, "e" forms when spot candles are sequential, opposing, but not engulfing .
3) Bear / Bull Sequences: "Strong" / "Weak" plot shapes
These signals are looking for a Rsi mid-line (50) 'bounce' among the last four candles on the observed time frame. For example, this will give a signal when the rsi is above, below, below, and back above the 50 on the cycled Rsi .
4) "Prox" plot shapes - "p" and "P"
These plot shapes are purely based on Rsi and the confluence between two time frames. Signals occur when the low time frame and high time frame are near the 50 line of their respective Rsi but on opposing sides. There are two sets of these, comprising two different (optional) times frames each. Essentially these signals are to point out potential places of cascade in either direction. If however the market decides to "save" price, action can continue or perhaps violently push in the opposite direction. Consider them warnings to either follow or take advantage of. "P" plots indicate the lower time frame set, while "Prox" indicate the higher time frame signals. These signals can be optionally filtered by Rsi-Vwap directional bias, i.e above or below its "normal" range.
5) Exceptional spot reversals, 'X' and '+'
These plots show when spot sells immediately after buying and outside of the momentum bias. i.e spot selling immediately after spot buying when Rsi > 50.
6) Bar-coloring is provided on the more important signals
7) Alerts for almost all of the aforementioned metrics are included
Thanks,
DM for access
If the indicator throws an error, it's likely due to a newer ticker not being called in the script. I will update this periodically, or upon polite request.

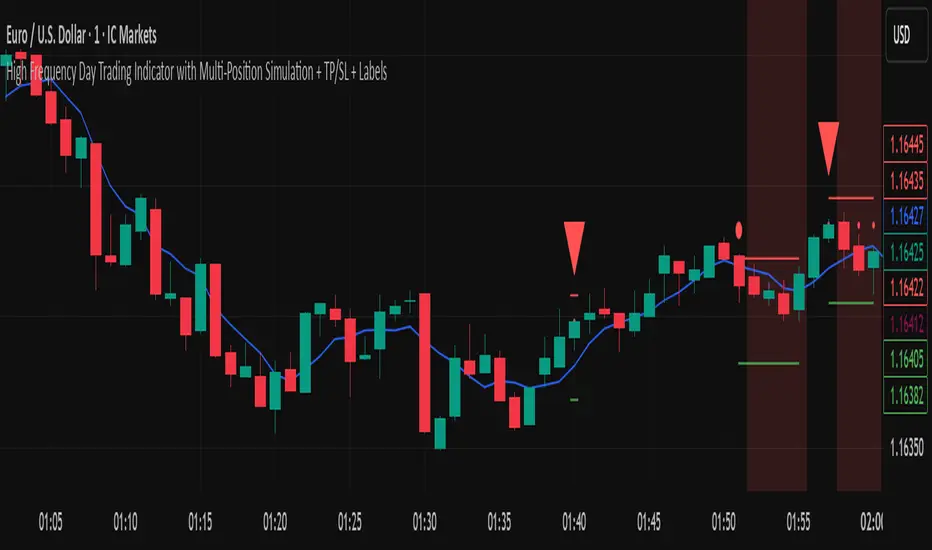
High Frequency Day Trading IndicatorMentioned Indicator uses RSI, Stoch RSI, SMA, EMA, SMMA, Double EMA to check for quick buying and selling areas for Day Trading.
For utilizing the tool, you'll need to wait for a Possible Trend Reversal (Represented by Triangle) and a confirmation to go Long by using a combination of Moving Averages which are then represented by circular dots on chart upon Bar Closure.
For Stop Loss once can simply place a Stop below/above the last Low/High respectively.
This trading Indicator is only recommended for high frequency trading on smaller time frames if you're using a highly volatile Coin/Asset Class.
Disclaimer: Please use this indicator in Test Environment to get a hold of concepts of this indicator. We do not advise using 100% capital for each order, as a matter of fact, we only recommend a risk of upto 1% on each position so Risk to Reward is maintained in proper sense. Please use Stops with all indicators and do not ever use an indicator without stop losses to save your capital.
NOTE: Indicator can be developed further to be used Trading Bots such as 3commas, Autoview, Wunderbit Bot, and Trailing Crypto Bots. For configuration of Automation Bots, you can contact us here on tradingview itself! :)
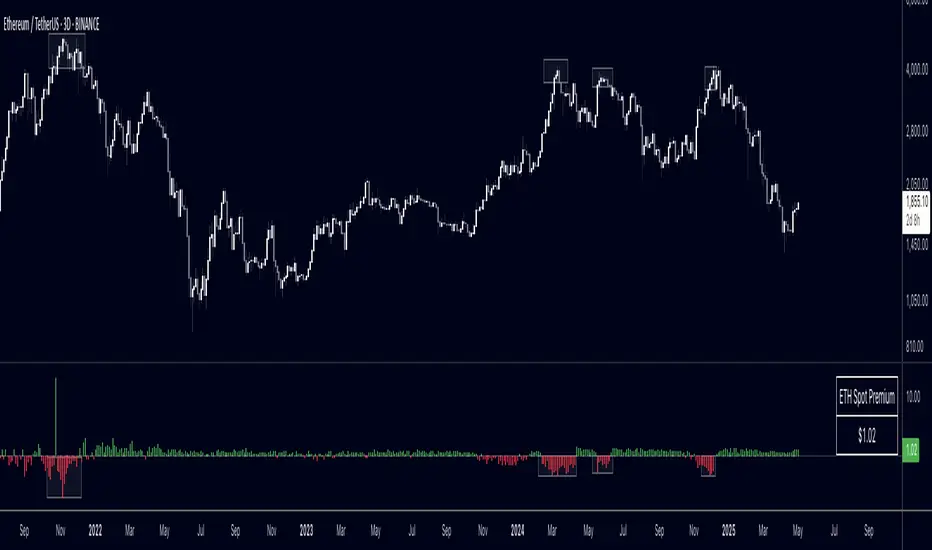
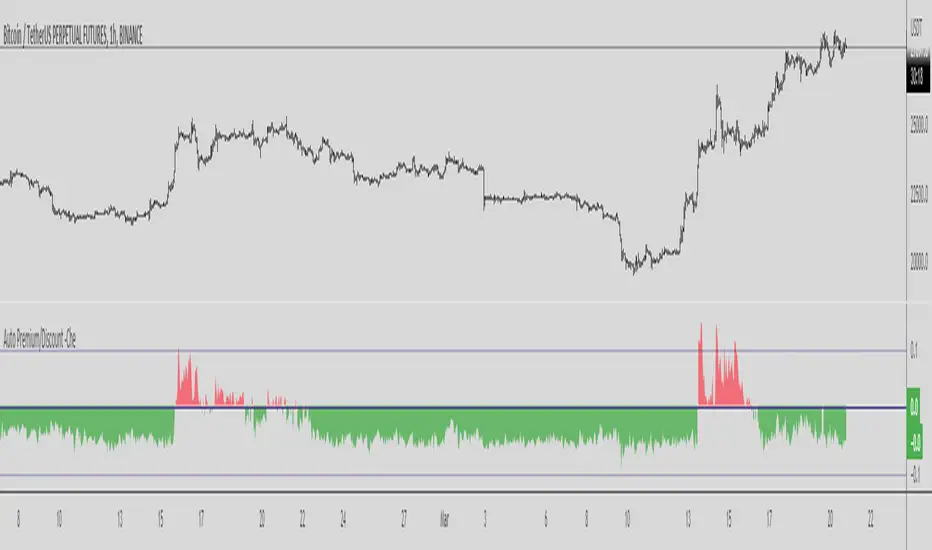
Premium IndexThis indicator shows the premium index data for the market (only crypto) you're currently looking at.
The premium index is the difference in price between the perpetual swap contract and the spot index price.
In plain and simple English: it shows whether the spot market for a specific coin is trading at a discount or at a premium.
This is official data from the exchange itself.
At the moment of publishing TradingView only has data for Binance.
So only use this indicator on Binance charts right now (USDT perps and BUSD perps).
Make sure you're looking at a perpetual swap contract, if you're looking at the spot market for example the indicator won't work.
Once TradingView adds more data like this I'll try to make sure that the logic of the code will also work for other markets.

DMT TEMPELTON PECKIntroduction
Bring your A-game to the market in A-Team style with DMT Templeton Peck – you’ll love it when this plan comes together!
Using customized standard deviations between historic price action ranges and volume metrics, DMT Templeton Peck enables traders to never miss a change in trend.
In its default state, the DMT Templeton Peck indicator displays key information, such as:
• Small trend line
• Large trend line
• Position entry prices
• Take profit levels
• Stop levels
• Buy and sell trend signals
In addition to providing core functionality for the indicator’s strategy signals, traders can use this data to enter or exit trades.
When price crosses both trend lines and consolidates there is a high probability that price will continue to move in the same direction. The most profitable results are achieved when trading in the direction of the current large time frame trend.
When small and large trend lines cross a trading signal is generated which can be used to automate trades. Please see the ‘TradingView Alerts’ section of this document for further details.
The Small & Large trend line’s display can be toggled, and their colors modified in the indicator’s style options as shown below.
Basic Strategy
In its simplest form, the strategy is to buy when the price crosses and consolidates above both trend lines and sell when the price crosses and consolidates below both trend lines.
How to Trade
Confident traders may choose to enter a long position at the point
#1 when the price passes above both trend lines and begins to consolidate.
However, the safer trade is to wait for the trend lines to cross at a point
#2 and then look for an entry in the direction of the local trend.
One price action begins to reverse to the downside the strategy reverses. Confident traders may choose to enter point
#3 when the price passes both trend lines and begins to consolidate once again under the previous price action structure that is now acting as resistance.
A sell signal is generated at the point
#4 which produced a small profit; however, a new short position could have been opened when the price retraced to resistance at a point
#5 and experienced a repeated number of strong rejections.
Do not worry if you miss a trade as there is often more than a single opportunity to enter – like at position #5 when price action retests the previous local price structure as resistance.
The indicator can be used on smaller time frames to scalp or find an entry after a larger time frame has signaled, however smaller time frames will also be “choppy” and should only be traded with a paper-tested strategy.
Traders should take profit on positions at resistance & support levels and look to have fully exited the trade by the time the price crosses back over both trend lines and/or loses a previously established price level.
Indicator Tuning
In its default state the indicator is tuned for swing trades using 30 minute & 1 hour time frames, however, you are encouraged to experiment with the indicator options.
Large & Small Length options define how many historic candles are used for the calculation of the relevant trend line.
As a rule of thumb, larger time frames would use smaller values and smaller time frames would use larger values, ie. On a daily chart, a large and small length could be defined as 400 and 100 respectively.
Please be aware that there are limits to the amount of historical data for any intraday level based on your TradingView subscription level:
• Basic – 5000 bars/candles
• Pro & Pro+ - 10000 bars/candles
• Premium – 20000 bars/cables
TradingView Alerts
By utilizing TradingView alerts DMT Templeton Peck's long and short signals can be used to trigger a trading bot.
To trigger a long position, set the TradingView Alert Condition to the DMT Templeton Peck indicator and select the ‘Long’ trigger condition with the ‘Once Per Bar Close’ option for best results.
To trigger a short position, set the TradingView Alert Condition to the DMT Templeton Peck indicator and select the ‘Short’ trigger condition with the ‘Once Per Bar Close’ option for best results.
Take profit options ‘Long_TP_1’ / ‘Short_TP_1’ and Stop options ‘Stop_long’ / ‘Stop_Short’ can also be configured in the same manner to conditionally trigger a trading bot and can be configured in the indicators Input options.

Binance Futures/Spot PriceShows the last price of either the spot or futures market on Binance, for the current coin.
It shows futures if you are in a spot market, and spot if you are in futures.
Currently this only works for USD stable coin pairs (BUSD, USDT, USDC, ...).
I don't plan to add COIN future pairs, it's not useful to me.
Additionally, it allows you to show the lowest and highest traded price (in the opposite market you are currently on: spot/futures) for a given period, and the respective chart, if you are into that sort of thing.
Bye :D

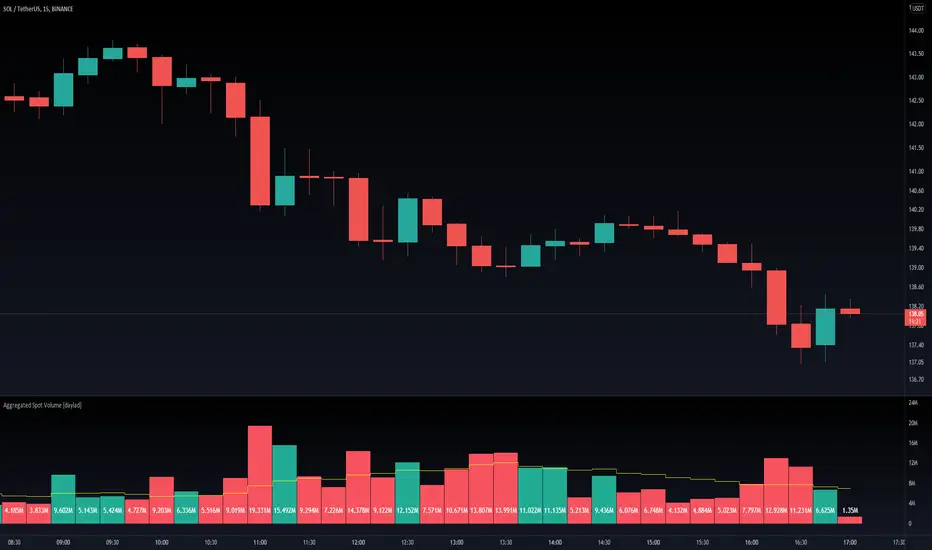
Aggregated Spot Volume [daylad]Works with any crypto chart! Automatically pulls and aggregates trading volume for the top stop pairs.
No need to manually update symbols, this indicator will detect if there is a matching symbol and add it.
Pulls data for the following pairs (when available):
COINBASE: + symbol + USD
COINBASE: + symbol + USDT
COINBASE: + symbol + EUR
BINANCE: + symbol + USDT
BINANCE: + symbol + BUSD
BINANCEUS: + symbol + USD
OKEX: + symbol + USDT
OKEX: + symbol + USDK
FTX: + symbol + USD
HUOBI: + symbol + USDT
BITFINEX: + symbol + USD
KRAKEN: + symbol + USD
KUCOIN: + symbol + USDT
CURRENCYCOM: + symbol + USD
POLONIEX: + symbol + USDT
UPBIT: + symbol + KRW
BITHUMB: + symbol + KRW
EXAMPLE -- If you are looking at the BINANCE:ADAUSDT chart, the indicator will automatically aggregate the volume from COINBASE:ADAUSD, COINBASE:ADAUSDT...etc... BINANCE:ADAUSDT...etc... BITHUMB:ADAKRW. If an exchange does not have a specific pair, then that pair returns 0 (does not add to the total).
If you have any questions feel free to ask. Happy trading!
WhaleCrew Crypto ArbitrageVisualizes the price difference (deviation) off BTC/ETH across multiple exchanges (Spot and/or Perpetuals)
Spot prices are represented by circles, while perpetual prices are shown as crosses.
Spot:
Binance
FTX
Bitfinex
Coinbase
Perpetuals:
Binance
FTX
Bybit
BitMEX

China to Derivateves DeltaCONCEPT
This indicator shows the delta between the Chinese market and the Derivatives, which implies the ability to track how China is trading.
FEATURES
USDT fixed Delta
Absolute Delta
Tether Desirability
TRADING
It's simple when USDT Fixed C2D, Absolute C2D and Tether Desirability are negative – this signals an increased pressure from sellers from China, also vice versa.
If you want access send me a private message so we can discuss it.
Cheers.

