Z-score changeAs a wise man once said that:
1. beginners think in $ change
2. intermediates think in % change
3. pros think in Z change
Here is the "Z-score change" indicator that calculates up/down moves normalized by standard deviation (volatility) displayed as bar chart with 1,2 and 3 stdev levels.
الانحراف المعياري (التقلّب)

Triple Confirmation Kernel Regression Overlay [QuantraSystems]Kernel Regression Oscillator - Overlay
Introduction
The Kernel Regression Oscillator (ᏦᏒᎧ) represents an advanced tool for traders looking to capitalize on market trends.
This Indicator is valuable in identifying and confirming trend directions, as well as probabilistic and dynamic oversold and overbought zones.
It achieves this through a unique composite approach using three distinct Kernel Regressions combined in an Oscillator.
The additional Chart Overlay Indicator adds confidence to the signal.
Which is this Indicator.
This methodology helps the trader to significantly reduce false signals and offers a more reliable indication of market movements than more widely used indicators can.
Legend
The upper section is the Overlay. It features the Signal Wave to display the current trend.
Its Overbought and Oversold zones start at 50% and end at 100% of the selected Standard Deviation (default σ = 3), which can indicate extremely rare situations which can lead to either a softening momentum in the trend or even a mean reversion situation.
The lower one is the Base Chart.
The Indicator is linked here
It features the Kernel Regression Oscillator to display a composite of three distinct regressions, also displaying current trend.
Its Overbought and Oversold zones start at 50% and end at 100% of the selected Standard Deviation (default σ = 2), which can indicate extremely rare situations.
Case Study
To effectively utilize the ᏦᏒᎧ, traders should use both the additional Overlay and the Base
Chart at the same time. Then focus on capturing the confluence in signals, for example:
If the 𝓢𝓲𝓰𝓷𝓪𝓵 𝓦𝓪𝓿𝓮 on the Overlay and the ᏦᏒᎧ on the Base Chart both reside near the extreme of an Oversold zone the probability is higher than normal that momentum in trend may soften or the token may even experience a reversion soon.
If a bar is characterized by an Oversold Shading in both the Overlay and the Base Chart, then the probability is very high to experience a reversion soon.
In this case the trader may want to look for appropriate entries into a long position, as displayed here.
If a bar is characterized by an Overbought Shading in either Overlay or Base Chart, then the probability is high for momentum weakening or a mean reversion.
In this case the trade may have taken profit and closed his long position, as displayed here.
Please note that we always advise to find more confluence by additional indicators.
Recommended Settings
Swing Trading (1D chart)
Overlay
Bandwith: 45
Width: 2
SD Lookback: 150
SD Multiplier: 2
Base Chart
Bandwith: 45
SD Lookback: 150
SD Multiplier: 2
Fast-paced, Scalping (4min chart)
Overlay
Bandwith: 75
Width: 2
SD Lookback: 150
SD Multiplier: 3
Base Chart
Bandwith: 45
SD Lookback: 150
SD Multiplier: 2
Notes
The Kernel Regression Oscillator on the Base Chart is also sensitive to divergences if that is something you are keen on using.
For maximum confluence, it is recommended to use the indicator both as a chart overlay and in its Base Chart.
Please pay attention to shaded areas with Standard Deviation settings of 2 or 3 at their outer borders, and consider action only with high confidence when both parts of the indicator align on the same signal.
This tool shows its best performance on timeframes lower than 4 hours.
Traders are encouraged to test and determine the most suitable settings for their specific trading strategies and timeframes.
The trend following functionality is indicated through the "𝓢𝓲𝓰𝓷𝓪𝓵 𝓦𝓪𝓿𝓮" Line, with optional "Up" and "Down" arrows to denote trend directions only (toggle “Show Trend Signals”).
Methodology
The Kernel Regression Oscillator takes three distinct kernel regression functions,
used at similar weight, in order to calculate a balanced and smooth composite of the regressions. Part of it are:
The Epanechnikov Kernel Regression: Known for its efficiency in smoothing data by assigning less weight to data points further away from the target point than closer data points, effectively reducing variance.
The Wave Kernel Regression: Similarly assigning weight to the data points based on distance, it captures repetitive and thus wave-like patterns within the data to smoothen out and reduce the effect of underlying cyclical trends.
The Logistic Kernel Regression: This uses the logistic function in order to assign weights by probability distribution on the distance between data points and target points. It thus avoids both bias and variance to a certain level.
kernel(source, bandwidth, kernel_type) =>
switch kernel_type
"Epanechnikov" => math.abs(source) <= 1 ? 0.75 * (1 - math.pow(source, 2)) : 0.0
"Logistic" => 1/math.exp(source + 2 + math.exp(-source))
"Wave" => math.abs(source) <= 1 ? (1 - math.abs(source)) * math.cos(math.pi * source) : 0.
kernelRegression(src, bandwidth, kernel_type) =>
sumWeightedY = 0.
sumKernels = 0.
for i = 0 to bandwidth - 1
base = i*i/math.pow(bandwidth, 2)
kernel = kernel(base, 1, kernel_type)
sumWeightedY += kernel * src
sumKernels += kernel
(src - sumWeightedY/sumKernels)/src
// Triple Confirmations
Ep = kernelRegression(source, bandwidth, 'Epanechnikov' )
Lo = kernelRegression(source, bandwidth, 'Logistic' )
Wa = kernelRegression(source, bandwidth, 'Wave' )
By combining these regressions in an unbiased average, we follow our principle of achieving confluence for a signal or a decision, by stacking several edges to increase the probability that we are correct.
// Average
AV = math.avg(Ep, Lo, Wa)
The Standard Deviation bands take defined parameters from the user, in this case sigma of ideally between 2 to 3,
to help the indicator detect extremely improbable conditions and thus take an inversely probable signal from it to forward to the user.
The parameter settings and also the visualizations allow for ample customizations by the trader. The indicator comes with default and recommended settings.
For questions or recommendations, please feel free to seek contact in the comments.

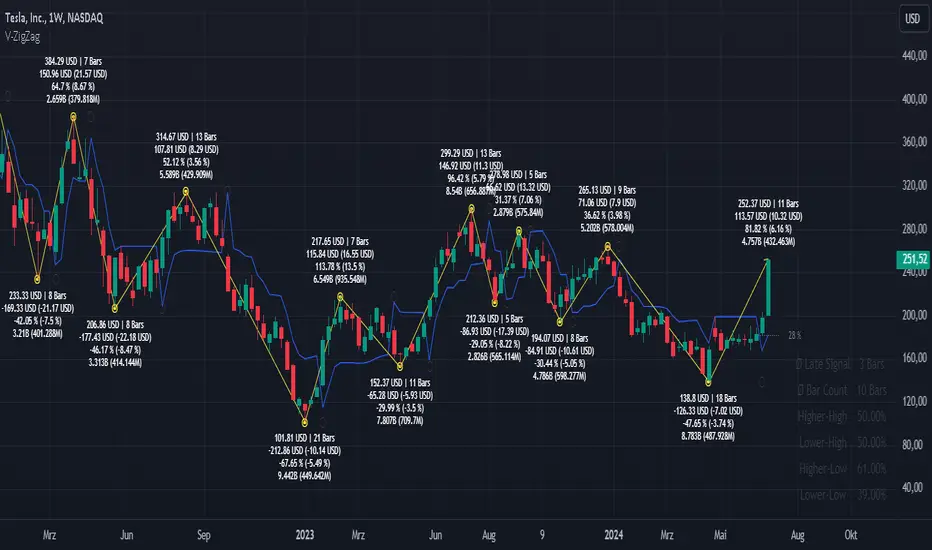
Volatility ZigZagIt calculates and plots zigzag lines based on volatility and price movements. It has various inputs for customization, allowing you to adjust parameters like source data, length, deviation, line styling, and labeling options.
The indicator identifies pivot points in the price movement, drawing lines between these pivots based on the deviation from certain price levels or volatility measures.
The script labels various data points at the ZigZag pivot points on the chart. These labels provide information about different aspects of the price movement and volume around these pivot points. Here's a breakdown of what gets labeled:
Price Change: Indicates the absolute and average percentage change between the two pivot points. It displays the absolute or relative change in price as a percentage. Additionally, the average absolute price increase or the average rate of increase can also be labeled.
Volume: Shows the total volume and average volume between the two pivot points.
Number of Bars: Indicates the number of bars between the current and the last pivot point.
Reversal Price: Displays the price of the reversal point (the previous pivot).
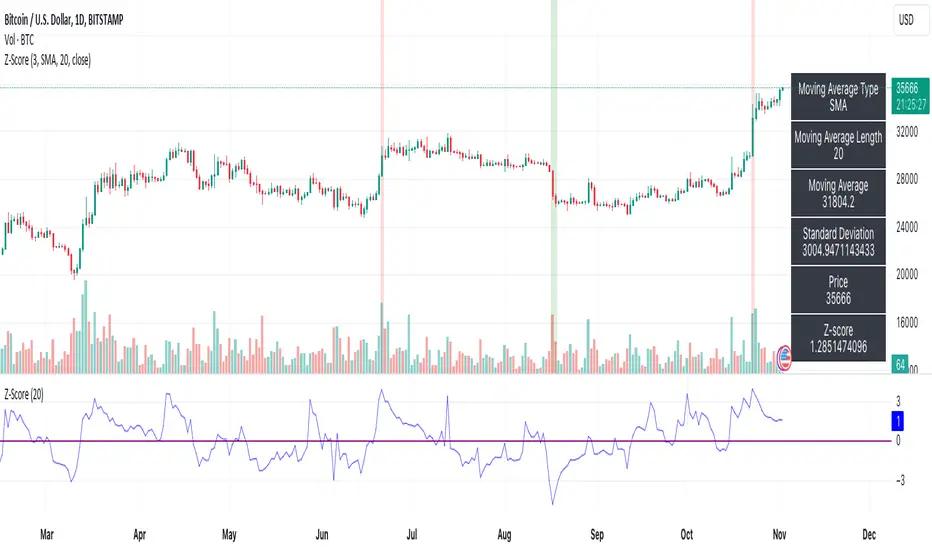
Z-ScoreThe "Z-Score" indicator is a unique and powerful tool designed to help traders identify overbought and oversold conditions in the market. Below is an explanation of its features, usefulness, and what makes it special:
Features:
Z-Score Calculation: The indicator calculates the Z-Score, a statistical measure that represents how far the current price is from the moving average (MA) in terms of standard deviations. It helps identify extreme price movements.
Customizable Parameters: Traders can adjust key parameters such as the Z-Score threshold, the type of MA (e.g., SMA, EMA), and the length of the moving average to suit their trading preferences.
Signal Options: The indicator offers flexibility in terms of signaling. Traders can choose whether to trigger signals when the Z-Score crosses the specified threshold or when it moves away from the threshold.
Visual Signals : Z-Score conditions are represented visually on the chart with color-coded background highlights. Overbought conditions are marked with a red background, while oversold conditions are indicated with a green background.
Information Table: A dynamic information table displays essential details, including the MA type, MA length, MA value, standard deviation, current price, and Z-Score. This information table helps traders make informed decisions.
Usefulness:
Overbought and Oversold Signals: Z-Score is particularly valuable for identifying overbought and oversold market conditions. Traders can use this information to potentially enter or exit positions.
Statistical Analysis: The Z-Score provides a statistical measure of price deviation, offering a data-driven approach to market analysis.
Customization: Traders can customize the indicator to match their trading strategies and preferences, enhancing its adaptability to different trading styles.
Visual Clarity: The visual signals make it easy for traders to quickly spot potential trade opportunities on the price chart.
In summary, the Z-Score indicator is a valuable tool for traders looking to incorporate statistical analysis into their trading strategies. Its customizability, visual signals, and unique statistical approach make it an exceptional choice for identifying overbought and oversold market conditions and potential trading opportunities.
Z-Score - AsymmetrikZ-Score-Asymmetrik User Manual
Introduction
The Z-Score Indicator is a powerful tool used in technical analysis to measure how far a data point is from the mean value of a dataset, measured in terms of standard deviations. This indicator helps traders identify potential overbought or oversold conditions in the market.
This user manual provides a comprehensive guide on how to use the Z-Score Indicator in TradingView.
0. Quickstart
- Set the thresholds based on your asset (number of standard deviations that you consider being extreme for this asset / timeframe).
- Red background indicates a possible overbought situation, green background an oversold one.
- The color and direction of the Z-Score Line acts as a confirmation of the trend reversal.
1. Indicator Overview
The Z-Score Indicator, also known as the Z-Score Oscillator, is designed to display the Z-Score of a selected financial instrument on your TradingView chart. The Z-Score measures how many standard deviations an asset's price is from its mean (average) price over a specified period.
The indicator consists of the following components:
- Z-Score Line: This line represents the Z-Score value and is displayed on the indicator panel.
- Background Color: The background color of the indicator panel changes based on user-defined thresholds.
2. Inputs
The indicator provides several customizable inputs to tailor it to your specific trading preferences:
- Number of Periods: This input allows you to define the number of periods over which the Z-Score will be calculated. A longer period will provide a smoother Z-Score line but may be less responsive to recent price changes.
- Z-Score Low Threshold: Sets the lower threshold value for the Z-Score. When the Z-Score crosses below this threshold, the background color of the indicator panel changes accordingly.
- Z-Score High Threshold: Sets the upper threshold value for the Z-Score. When the Z-Score crosses above this threshold, the background color of the indicator panel changes accordingly.
3. How to Use the Indicator
Here are the steps to use the Z-Score Indicator:
- Adjust Parameters: Modify the indicator's inputs as needed. You can change the number of periods for the Z-Score calculation and set your desired low and high thresholds.
- Interpret the Indicator: Observe the Z-Score line on the indicator panel. It fluctuates above and below zero. Pay attention to the background color changes when the Z-Score crosses your specified thresholds.
4. Interpreting the Indicator
- Z-Score Line: The Z-Score line represents the current Z-Score value. When it is above zero, it suggests that the asset's price is above the mean, indicating potential overvaluation. When below zero, it suggests undervaluation.
- Background Color: The background color of the indicator panel changes based on the Z-Score's position relative to the specified thresholds. Green indicates the Z-Score is below the low threshold (potential undervaluation), while red indicates it is above the high threshold (potential overvaluation).
- Z-Score Line Color: The color of the Z-Score line shows that the Z-Score is trending up compared to its moving average. This can be used as a validation of the background color.
5. Customization Options
You can customize the Z-Score Indicator in the following ways:
- Adjust Inputs: Modify the number of periods and the Z-Score thresholds.
- Change Line and Background Colors: You can customize the colors of the Z-Score line and background by editing the indicator's script.
6. Troubleshooting
If you encounter any issues while using the Z-Score Indicator, make sure to check the following:
- Ensure that the indicator is applied correctly to your chart.
- Verify that the indicator's inputs match your intended settings.
- Contact me for more support if needed
7. Conclusion
The Z-Score Indicator is a valuable tool for traders and investors to identify potential overbought and oversold conditions in the market. By understanding how the Z-Score works and customizing it to your preferences, you can integrate it into your trading strategy to make informed decisions.
Remember that trading involves risk, and it's essential to combine technical indicators like the Z-Score with other analysis methods and risk management strategies for successful trading.

Momentum ChannelbandsThe "Momentum Channelbands" is indicator that measures and displays an asset's momentum. It includes options to calculate Bollinger Bands and Donchian Channels around the momentum. Users can customize settings for a comprehensive view of momentum-related insights. This tool helps assess trend strength, identify overbought/oversold conditions, and pinpoint highs/lows. It should be used alongside other indicators due to potential lag and false signals.

dharmatech : Standard Deviation ChannelDESCRIPTION
Based on version by leojez.
Adds a 3rd standard deviation level.
Twice as fast as original version.
Refactored and simplified source code.
HOW TO USE
Load your chart
Adjust the timeframe and zoom of the chart so that the trend you're interested in is in view.
Add the indicator
Use the measuring tool to measure the number of bars from the start of the trend to the latest candle.
Open settings for the indicator.
Set the length value to the number of bars that you noted.

Advanced Weighted Residual Arbitrage AnalyzerThe Advanced Weighted Residual Arbitrage Analyzer is a sophisticated tool designed for traders aiming to exploit price deviations between various asset pairs. By examining the differences in normalized price relations and their weighted residuals, this indicator provides insights into potential arbitrage opportunities in the market.
Key Features:
Multiple Relation Analysis: Analyze up to five different asset relations simultaneously, offering a comprehensive view of potential arbitrage setups.
Normalization Functions: Choose from a variety of normalization techniques like SMA, EMA, WMA, and HMA to ensure accurate comparisons between different price series.
Dynamic Weighting: Residuals are weighted based on their correlation, ensuring that stronger correlations have a more pronounced impact on the analysis. Weighting can be adjusted using several functions including square, sigmoid, and logistic.
Regression Flexibility: Incorporate linear, polynomial, or robust regression to calculate residuals, tailoring the analysis to different market conditions.
Customizable Display: Decide which plots to display for clarity and focus, including normalized relations, weighted residuals, and the difference between the screen relation and the average weighted residual.
Usage Guidelines:
Configure the asset pairs you wish to analyze using the Symbol Relations group in the settings.
Adjust the normalization, volatility, regression, and weighting functions based on your preference and the specific characteristics of the asset pairs.
Monitor the weighted residuals for deviations from the mean. Larger deviations suggest stronger arbitrage opportunities.
Use the difference plot (between the screen relation and average weighted residual) as a quick visual cue for potential trade setups. When this plot deviates significantly from zero, it indicates a possible arbitrage opportunity.
Regularly update and adjust the parameters to account for changing market conditions and ensure the most accurate analysis.
In the Advanced Weighted Residual Arbitrage Analyzer , the value set in Alert Threshold plays a crucial role in delineating a normalized band. This band serves as a guide to identify significant deviations and potential trading opportunities.
When we observe the plots of the green line and the purple line, the Alert Threshold provides a boundary for these plots. The following points explain the significance:
Breach of the Band: When either the green or purple line crosses above or below the Alert Threshold , it indicates a significant deviation from the mean. This breach can be interpreted as a potential trading signal, suggesting a possible arbitrage opportunity.
Convergence to the Mean: If the green line converges with the purple line , it denotes that the price relation has reverted to its mean. This convergence typically suggests that the arbitrage opportunity has been exhausted, and the market dynamics are returning to equilibrium.
Trade Execution: A trader can consider entering a trade when the lines breach the Alert Threshold . The return of the green line to align closely with the purple line can be seen as a signal to exit the trade, capitalizing on the reversion to the mean.
By monitoring these plots in conjunction with the Alert Threshold , traders can gain insights into market imbalances and exploit potential arbitrage opportunities. The convergence and divergence of these lines, relative to the normalized band, serve as valuable visual cues for trade initiation and termination.
When you're analyzing relations between two symbols (for instance, BINANCE:SANDUSDT/BINANCE:NEARUSDT ), you're essentially looking at the price relationship between the two underlying assets. This relationship provides insights into potential imbalances between the assets, which arbitrage traders can exploit.
Breach of the Lower Band: If the purple line touches or crosses below the lower Alert Threshold , it indicates that the first symbol (in our example, SANDUSDT ) is undervalued relative to the second symbol ( NEARUSDT ). In practical terms:
Action: You would consider buying the first symbol ( SANDUSDT ) and selling the second symbol ( NEARUSDT ).
Rationale: The expectation is that the price of the first symbol will rise, or the price of the second symbol will fall, or both, thereby converging back to their historical mean relationship.
Breach of the Upper Band: Conversely, if the difference plot touches or crosses above the upper Alert Threshold , it suggests that the first symbol is overvalued compared to the second. This implies:
Action: You'd consider selling the first symbol ( SANDUSDT ) and buying the second symbol ( NEARUSDT ).
Rationale: The anticipation here is that the price of the first symbol will decrease, or the price of the second will increase, or both, bringing the relationship back to its historical average.
Convergence to the Mean: As mentioned earlier, when the green line aligns closely with the purple line, it's an indication that the assets have returned to their typical price relationship. This serves as a signal for traders to consider closing out their positions, locking in the gains from the arbitrage opportunity.
It's important to note that when you're trading based on symbol relations, you're essentially betting on the relative performance of the two assets. This strategy, often referred to as "pairs trading," seeks to capitalize on price imbalances between related financial instruments. By taking opposing positions in the two symbols, traders aim to profit from the eventual reversion of the price difference to the mean.

VolatilityIndicatorsLibrary "VolatilityIndicators"
This is a library of Volatility Indicators .
It aims to facilitate the grouping of this category of indicators, and also offer the customized supply of
the parameters and sources, not being restricted to just the closing price.
@Thanks and credits:
1. Dynamic Zones: Leo Zamansky, Ph.D., and David Stendahl
2. Deviation: Karl Pearson (code by TradingView)
3. Variance: Ronald Fisher (code by TradingView)
4. Z-score: Veronique Valcu (code by HPotter)
5. Standard deviation: Ronald Fisher (code by TradingView)
6. ATR (Average True Range): J. Welles Wilder (code by TradingView)
7. ATRP (Average True Range Percent): millerrh
8. Historical Volatility: HPotter
9. Min-Max Scale Normalization: gorx1
10. Mean Normalization: gorx1
11. Standardization: gorx1
12. Scaling to unit length: gorx1
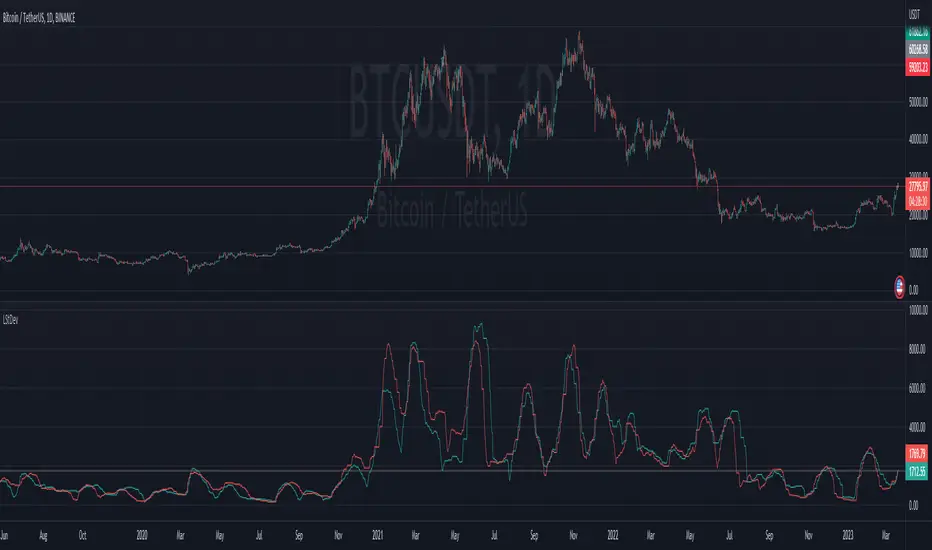
13. LS Volatility Index: Alexandre Wolwacz (Stormer), Fabrício Lorenz, Fábio Figueiredo (Vlad) (code by me)
14. Bollinger Bands: John Bollinger (code by TradingView)
15. Bollinger Bands %: John Bollinger (code by TradingView)
16. Bollinger Bands Width: John Bollinger (code by TradingView)
dev(source, length, anotherSource)
Deviation. Measure the difference between a source in relation to another source
Parameters:
source (float)
length (simple int) : (int) Sequential period to calculate the deviation
anotherSource (float) : (float) Source to compare
Returns: (float) Bollinger Bands Width
variance(src, mean, length, biased, degreesOfFreedom)
Variance. A statistical measurement of the spread between numbers in a data set. More specifically,
variance measures how far each number in the set is from the mean (average), and thus from every other number in the set.
Variance is often depicted by this symbol: σ2. It is used by both analysts and traders to determine volatility and market security.
Parameters:
src (float) : (float) Source to calculate variance
mean (float) : (float) Mean (Moving average)
length (simple int) : (int) The sequential period to calcule the variance (number of values in data set)
biased (simple bool) : (bool) Defines the type of standard deviation. If true, uses biased sample variance (n),
degreesOfFreedom (simple int) : (int) Degrees of freedom. The number of values in the final calculation of a statistic that are free to vary.
Default value is n-1, where n here is length. Only applies when biased parameter is defined as true.
Returns: (float) Standard deviation
stDev(src, length, mean, biased, degreesOfFreedom)
Measure the Standard deviation from a source in relation to it's moving average.
In this implementation, you pass the average as a parameter, allowing a more personalized calculation.
Parameters:
src (float) : (float) Source to calculate standard deviation
length (simple int) : (int) The sequential period to calcule the standard deviation
mean (float) : (float) Moving average.
biased (simple bool) : (bool) Defines the type of standard deviation. If true, uses biased sample variance (n),
else uses unbiased sample variance (n-1 or another value, as long as it is in the range between 1 and n-1), where n=length.
degreesOfFreedom (simple int) : (int) Degrees of freedom. The number of values in the final calculation of a statistic that are free to vary.
Default value is n-1, where n here is length.
Returns: (float) Standard deviation
zscore(src, mean, length, biased, degreesOfFreedom)
Z-Score. A z-score is a statistical measurement that indicates how many standard deviations a data point is from
the mean of a data set. It is also known as a standard score. The formula for calculating a z-score is (x - μ) / σ,
where x is the individual data point, μ is the mean of the data set, and σ is the standard deviation of the data set.
Z-scores are useful in identifying outliers or extreme values in a data set. A positive z-score indicates that the
data point is above the mean, while a negative z-score indicates that the data point is below the mean. A z-score of
0 indicates that the data point is equal to the mean.
Z-scores are often used in hypothesis testing and determining confidence intervals. They can also be used to compare
data sets with different units or scales, as the z-score standardizes the data. Overall, z-scores provide a way to
measure the relative position of a data point in a data
Parameters:
src (float) : (float) Source to calculate z-score
mean (float) : (float) Moving average.
length (simple int) : (int) The sequential period to calcule the standard deviation
biased (simple bool) : (bool) Defines the type of standard deviation. If true, uses biased sample variance (n),
else uses unbiased sample variance (n-1 or another value, as long as it is in the range between 1 and n-1), where n=length.
degreesOfFreedom (simple int) : (int) Degrees of freedom. The number of values in the final calculation of a statistic that are free to vary.
Default value is n-1, where n here is length.
Returns: (float) Z-score
atr(source, length)
ATR: Average True Range. Customized version with source parameter.
Parameters:
source (float) : (float) Source
length (simple int) : (int) Length (number of bars back)
Returns: (float) ATR
atrp(length, sourceP)
ATRP (Average True Range Percent)
Parameters:
length (simple int) : (int) Length (number of bars back) for ATR
sourceP (float) : (float) Source for calculating percentage relativity
Returns: (float) ATRP
atrp(source, length, sourceP)
ATRP (Average True Range Percent). Customized version with source parameter.
Parameters:
source (float) : (float) Source for ATR
length (simple int) : (int) Length (number of bars back) for ATR
sourceP (float) : (float) Source for calculating percentage relativity
Returns: (float) ATRP
historicalVolatility(lengthATR, lengthHist)
Historical Volatility
Parameters:
lengthATR (simple int) : (int) Length (number of bars back) for ATR
lengthHist (simple int) : (int) Length (number of bars back) for Historical Volatility
Returns: (float) Historical Volatility
historicalVolatility(source, lengthATR, lengthHist)
Historical Volatility
Parameters:
source (float) : (float) Source for ATR
lengthATR (simple int) : (int) Length (number of bars back) for ATR
lengthHist (simple int) : (int) Length (number of bars back) for Historical Volatility
Returns: (float) Historical Volatility
minMaxNormalization(src, numbars)
Min-Max Scale Normalization. Maximum and minimum values are taken from the sequential range of
numbars bars back, where numbars is a number defined by the user.
Parameters:
src (float) : (float) Source to normalize
numbars (simple int) : (int) Numbers of sequential bars back to seek for lowest and hightest values.
Returns: (float) Normalized value
minMaxNormalization(src, numbars, minimumLimit, maximumLimit)
Min-Max Scale Normalization. Maximum and minimum values are taken from the sequential range of
numbars bars back, where numbars is a number defined by the user.
In this implementation, the user explicitly provides the desired minimum (min) and maximum (max) values for the scale,
rather than using the minimum and maximum values from the data.
Parameters:
src (float) : (float) Source to normalize
numbars (simple int) : (int) Numbers of sequential bars back to seek for lowest and hightest values.
minimumLimit (simple float) : (float) Minimum value to scale
maximumLimit (simple float) : (float) Maximum value to scale
Returns: (float) Normalized value
meanNormalization(src, numbars, mean)
Mean Normalization
Parameters:
src (float) : (float) Source to normalize
numbars (simple int) : (int) Numbers of sequential bars back to seek for lowest and hightest values.
mean (float) : (float) Mean of source
Returns: (float) Normalized value
standardization(src, mean, stDev)
Standardization (Z-score Normalization). How "outside the mean" values relate to the standard deviation (ratio between first and second)
Parameters:
src (float) : (float) Source to normalize
mean (float) : (float) Mean of source
stDev (float) : (float) Standard Deviation
Returns: (float) Normalized value
scalingToUnitLength(src, numbars)
Scaling to unit length
Parameters:
src (float) : (float) Source to normalize
numbars (simple int) : (int) Numbers of sequential bars back to seek for lowest and hightest values.
Returns: (float) Normalized value
lsVolatilityIndex(movingAverage, sourceHvol, lengthATR, lengthHist, lenNormal, lowerLimit, upperLimit)
LS Volatility Index. Measures the volatility of price in relation to an average.
Parameters:
movingAverage (float) : (float) A moving average
sourceHvol (float) : (float) Source for calculating the historical volatility
lengthATR (simple int) : (float) Length for calculating the ATR (Average True Range)
lengthHist (simple int) : (float) Length for calculating the historical volatility
lenNormal (simple int) : (float) Length for normalization
lowerLimit (simple int)
upperLimit (simple int)
Returns: (float) LS Volatility Index
lsVolatilityIndex(sourcePrice, movingAverage, sourceHvol, lengthATR, lengthHist, lenNormal, lowerLimit, upperLimit)
LS Volatility Index. Measures the volatility of price in relation to an average.
Parameters:
sourcePrice (float) : (float) Source for measure the distance
movingAverage (float) : (float) A moving average
sourceHvol (float) : (float) Source for calculating the historical volatility
lengthATR (simple int) : (float) Length for calculating the ATR (Average True Range)
lengthHist (simple int) : (float) Length for calculating the historical volatility
lenNormal (simple int)
lowerLimit (simple int)
upperLimit (simple int)
Returns: (float) LS Volatility Index
bollingerBands(src, length, mult, basis)
Bollinger Bands. A Bollinger Band is a technical analysis tool defined by a set of lines plotted
two standard deviations (positively and negatively) away from a simple moving average (SMA) of the security's price,
but can be adjusted to user preferences. In this version you can pass a customized basis (moving average), not only SMA.
Parameters:
src (float) : (float) Source to calculate standard deviation used in Bollinger Bands
length (simple int) : (int) The time period to be used in calculating the standard deviation
mult (simple float) : (float) Multiplier used in standard deviation. Basically, the upper/lower bands are standard deviation multiplied by this.
basis (float) : (float) Basis of Bollinger Bands (a moving average)
Returns: (float) A tuple of Bollinger Bands, where index 1=basis; 2=basis+dev; 3=basis-dev; and dev=multiplier*stdev
bollingerBands(src, length, aMult, basis)
Bollinger Bands. A Bollinger Band is a technical analysis tool defined by a set of lines plotted
two standard deviations (positively and negatively) away from a simple moving average (SMA) of the security's price,
but can be adjusted to user preferences. In this version you can pass a customized basis (moving average), not only SMA.
Also, various multipliers can be passed, thus getting more bands (instead of just 2).
Parameters:
src (float) : (float) Source to calculate standard deviation used in Bollinger Bands
length (simple int) : (int) The time period to be used in calculating the standard deviation
aMult (float ) : (float ) An array of multiplies used in standard deviation. Basically, the upper/lower bands are standard deviation multiplied by this.
This array of multipliers permit the use of various bands, not only 2.
basis (float) : (float) Basis of Bollinger Bands (a moving average)
Returns: (float ) An array of Bollinger Bands, where:
index 1=basis; 2=basis+dev1; 3=basis-dev1; 4=basis+dev2, 5=basis-dev2, 6=basis+dev2, 7=basis-dev2, Nup=basis+devN, Nlow=basis-devN
and dev1, dev2, devN are ```multiplier N * stdev```
bollingerBandsB(src, length, mult, basis)
Bollinger Bands %B - or Percent Bandwidth (%B).
Quantify or display where price (or another source) is in relation to the bands.
%B can be useful in identifying trends and trading signals.
Calculation:
%B = (Current Price - Lower Band) / (Upper Band - Lower Band)
Parameters:
src (float) : (float) Source to calculate standard deviation used in Bollinger Bands
length (simple int) : (int) The time period to be used in calculating the standard deviation
mult (simple float) : (float) Multiplier used in standard deviation
basis (float) : (float) Basis of Bollinger Bands (a moving average)
Returns: (float) Bollinger Bands %B
bollingerBandsB(src, length, aMult, basis)
Bollinger Bands %B - or Percent Bandwidth (%B).
Quantify or display where price (or another source) is in relation to the bands.
%B can be useful in identifying trends and trading signals.
Calculation
%B = (Current Price - Lower Band) / (Upper Band - Lower Band)
Parameters:
src (float) : (float) Source to calculate standard deviation used in Bollinger Bands
length (simple int) : (int) The time period to be used in calculating the standard deviation
aMult (float ) : (float ) Array of multiplier used in standard deviation. Basically, the upper/lower bands are standard deviation multiplied by this.
This array of multipliers permit the use of various bands, not only 2.
basis (float) : (float) Basis of Bollinger Bands (a moving average)
Returns: (float ) An array of Bollinger Bands %B. The number of results in this array is equal the numbers of multipliers passed via parameter.
bollingerBandsW(src, length, mult, basis)
Bollinger Bands Width. Serve as a way to quantitatively measure the width between the Upper and Lower Bands
Calculation:
Bollinger Bands Width = (Upper Band - Lower Band) / Middle Band
Parameters:
src (float) : (float) Source to calculate standard deviation used in Bollinger Bands
length (simple int) : (int) Sequential period to calculate the standard deviation
mult (simple float) : (float) Multiplier used in standard deviation
basis (float) : (float) Basis of Bollinger Bands (a moving average)
Returns: (float) Bollinger Bands Width
bollingerBandsW(src, length, aMult, basis)
Bollinger Bands Width. Serve as a way to quantitatively measure the width between the Upper and Lower Bands
Calculation
Bollinger Bands Width = (Upper Band - Lower Band) / Middle Band
Parameters:
src (float) : (float) Source to calculate standard deviation used in Bollinger Bands
length (simple int) : (int) Sequential period to calculate the standard deviation
aMult (float ) : (float ) Array of multiplier used in standard deviation. Basically, the upper/lower bands are standard deviation multiplied by this.
This array of multipliers permit the use of various bands, not only 2.
basis (float) : (float) Basis of Bollinger Bands (a moving average)
Returns: (float ) An array of Bollinger Bands Width. The number of results in this array is equal the numbers of multipliers passed via parameter.
dinamicZone(source, sampleLength, pcntAbove, pcntBelow)
Get Dynamic Zones
Parameters:
source (float) : (float) Source
sampleLength (simple int) : (int) Sample Length
pcntAbove (simple float) : (float) Calculates the top of the dynamic zone, considering that the maximum values are above x% of the sample
pcntBelow (simple float) : (float) Calculates the bottom of the dynamic zone, considering that the minimum values are below x% of the sample
Returns: A tuple with 3 series of values: (1) Upper Line of Dynamic Zone;
(2) Lower Line of Dynamic Zone; (3) Center of Dynamic Zone (x = 50%)
Examples:

Range Projections [TFO]The purpose of this indicator is to see how often price reached certain standard deviations from a selected time range. The inspiration for this was to study ICT (Inner Circle Trader) concepts regarding the Central Bank Dealer’s Range (CBDR), which is 2:00 pm - 8:00 pm New York local time according to ICT Core Content. However, the idea and data collection could certainly be applied to any range of time.
The main settings of this indicator are session time, range type, and the standard deviation filter. The session time is the window of price that will be utilized for range projections. The range type can be either body or wick (on the current timeframe). The standard deviation filter is used to eliminate sessions whose ranges (from high to low) are greater than the desired/input number of standard deviations from all available session ranges.
In this example, the time range is set to 16:00 - 20:00, or the time between the New York session close and the Asia session open. Our standard deviations are set to 1, 2, 2.5, and 4. Now, by taking this session’s price range and extrapolating these extensions from the initial range, we can use these levels to see if and how price interacts with them before the next 16:00 - 20:00 session.
Furthermore, we can enable the Data Table to analyze how often price trades to these levels for the sessions that are deemed valid (determined by the standard deviation filter). This time our standard deviations are set to 1, 2, 3, and 4.
This concept can theoretically be applied to any window of time. ICT has mentioned that, in instances where the CBDR is too large, the Asia range may be used instead. We can observe that the indicator behaves the same way when we change the session to the Asia range, 20:00 - 00:00.

Ladder StDevThis indicator shows the upwards (green) and downward (red) volatility of the market. It is a standard deviation of the price but with a twist! For the upwards volatility , only the green candles are taken into account, and for the downwards only the red candles are.
Compared to my previous "Ladder ATR" indicator this a different approach to measure the the upwards and downwards volatility of the market by utilizing the standard deviation instead of the ATR. When both measure the volatility they have different "dynamics". Standard deviation increases the weight of larger values over smaller values. The ATR indicator is based on the average of absolute changes. So, if we apply the indicators on a daily chart , ATR considers intraday and between-day data, while the standard deviation calculation includes only daily returns (source price).
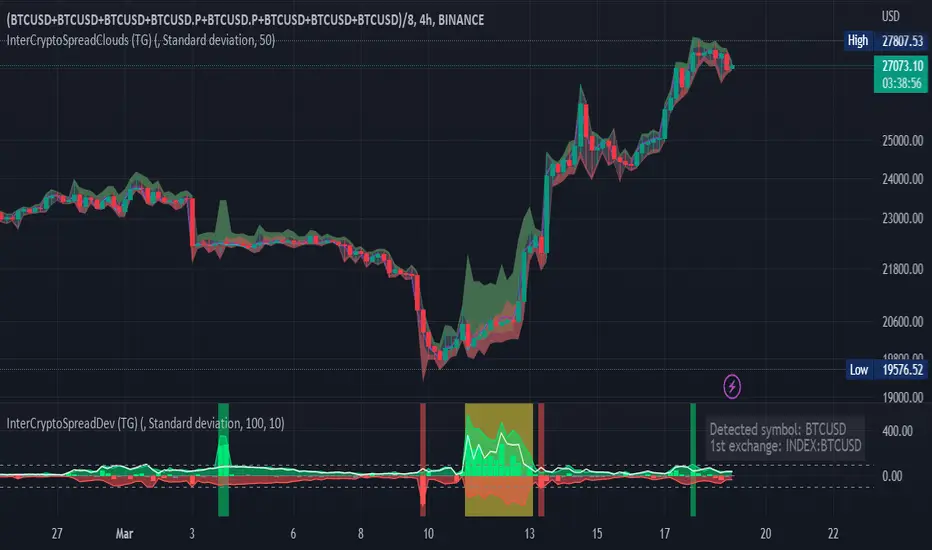
Inter-Exchanges Crypto Price Spread Deviation (Tartigradia)Measures the deviation of price metrics between various exchanges. It's a kind of realized volatility indicator, as the idea is that in times of high volatility (high emotions, fear, uncertainty), it's more likely that market inefficiencies will appear for the same asset between different market makers, ie, the price can temporarily differ a lot. This indicator will catch these instants of high differences between exchanges, even if they lasted only an instant (because we use high and low values).
Both standard deviation and median absolute deviation (more robust to outliers, ie, exchanges with a very different price from others won't influence the median absolute deviation, but the standard deviation yes).
Compared to other inter-exchanges spread indicators, this one offers two major features:
* The symbol automatically adapts to the symbol currently selected in user's chart. Hence, switching between tickers does not require the user to modify any option, everything is dynamically updated behind the scenes.
* It's easy to add more exchanges (requires some code editing because PineScript v5 does not allow dynamical request.security() calls).
Limitations/things to know:
* History is limited to what the ticker itself display. Ie, even if the exchanges specified in this indicator have more data than the ticker currently displayed in the user's chart, the indicator will show only a timeperiod as long as the chart.
* The indicator can manage multiple exchanges of different historical length (ie, some exchanges having more data going way earlier in the past than others), in which case they will simply be ignored from calculations when far back in the past. Hence, you should be aware that the further you go in the past, the less exchanges will have such data, and hence the less accurate the measures will be (because the deviation will be calculated from less sources than more recent bars). This is thanks to how the array.* math functions behave in case of na values, they simply skip them from calculations, contrary to math.* functions.
Fibonacci Volatility BandsFibonacci Volatility Bands are just an alternative that allows for more margin than regular Bollinger Bands. They are created based on an average of moving averages that use the Fibonacci sequence as lookback periods.
The use of the Fibonacci Volatility Bands is exactly the same as the Bollinger Bands.

TheATR™: Volatility Extremes (VolEx)Volatility is a crucial aspect of financial markets that is closely monitored by traders and investors alike. The traditional Average True Range (ATR) oscillator is a widely used technical indicator for measuring volatility in financial markets. However, there are limitations to the ATR oscillator, as it does not account for changing market conditions and may not adequately reflect extreme price movements. To address these limitations, TheATR has developed the VolEx indicator, which aims to identify extremes in the ATR oscillator by building dynamic thresholds using either a 'percentage' or 'standard deviation' based comparison with the value of the ATR.
The VolEx indicator utilizes a dynamic approach to measure volatility by considering the current level of the ATR oscillator relative to the dynamically generated thresholds. The dynamic thresholds are calculated based on the current ATR value and the chosen method of comparison (either 'percentage' or 'standard deviation'). If the ATR value exceeds the upper dynamic threshold, the market is experiencing high volatility, while a value below the lower dynamic threshold indicates low volatility.
The VolEx indicator offers several advantages over traditional volatility indicators, such as the ATR oscillator. First, it takes into account the changing market conditions and adjusts the thresholds accordingly. Second, it offers flexibility in the choice of the comparison method, allowing traders to tailor the indicator to their specific trading strategies. Finally, it provides clear signals for identifying extremes in volatility, which can be used to inform trading decisions.
In summary, the VolEx indicator developed by TheATR is a dynamic and flexible technical indicator that offers a robust approach to measuring volatility in financial markets. By utilizing dynamic thresholds and allowing for different comparison methods, the VolEx indicator provides a valuable tool for traders and investors seeking to identify extremes in market volatility..
NOTE: It is important to note that volatility, as measured by the VolEx indicator, does not provide any directional bias for the market movement. Rather, it simply indicates the degree to which the market is moving, regardless of direction. Traders and investors must use other technical or fundamental analysis tools to determine the direction of the market and make informed trading decisions based on their individual strategies and risk tolerance.

Rekt Edge Reversion BandRekt Edge Reversion band is a technical indicator that utilizes a combination of moving averages and standard deviations to determine optimal entry and exit points in the market. By comparing the current price to its moving average, the indicator identifies potential trends and determines how you can position around them by plotting buy/sell signals and two channels based on user input parameters. The user can choose between Simple Moving Average ( SMA ) or Exponential Moving Average ( EMA ) and select the moving average period, the unit of separation, the multiples of the unit, and other important parameters. The indicator's inputs can be adjusted to suit different trading styles, and it can be used on any time frame. The indicator can be used to identify potential trend reversals or breakouts (or breakdowns) when the price moves outside of the channels. The indicators potential use cases include identifying overbought or oversold conditions. With its ability to provide a clear signal on when to enter and exit a trade, this indicator is a popular tool among traders looking to make more informed and profitable trading decisions. This indicator can also be used in conjunction with other technical analysis tools to confirm or invalidate trading signals.

Click VWAP Anchored with Standard Devation BandsSimply use it by clicking on your chart on the places you find important to determine whether you entries or exits look strong or weak.

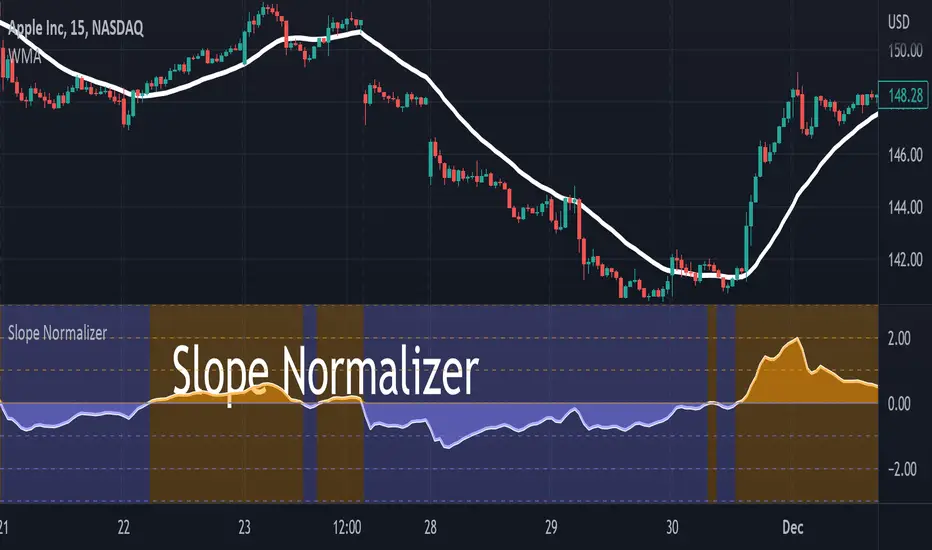
Slope NormalizerBrief:
This oscillator style indicator takes another indicator as its source and measures the change over time (the slope). It then isolates the positive slope values from the negative slope values to determine a 'normal' slope value for each.
** A 'normal' value of 1.0 is determined by the average slope plus the standard deviation of that slope.
The Scale
This indicator is not perfectly linear. The values are interpolated differently from 0.0 - 1.0 than values greater than 1.0.
From values 0.0 to 1.0 (positive or negative): it means that the value of the slope is less than 'normal' **.
Any value above 1.0 means the current slope is greater than 'normal' **.
A value of 2.0 means the value is the average plus 2x the standard deviation.
A value of 3.0 means the value is the average plus 3x the standard deviation.
A value greater than 4.0 means the value is greater than the average plus 4x the standard deviation.
Because the slope value is normalized, the meaning of these values can remain generally the same for different symbols.
Potential Usage Examples/b]
Using this in conjunction with an SMA or WMA may indicate a change in trend, or a change in trend-strength.
Any values greater than 4 indicate a very strong (and unusual) trend that may not likely be sustainable.
Any values cycling between +1.0 and -1.0 may mean indecision.
A value that is decreasing below 0.5 may predict a change in trend (slope may soon invert).
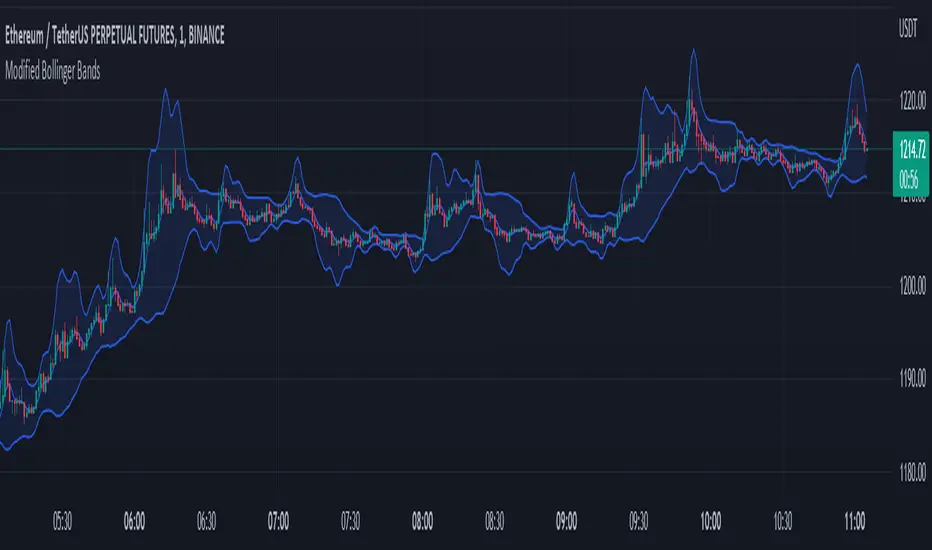
Modified Bollinger BandsThis script has been distributed for learning purposes.
A particular kind of price envelope is "Bollinger Bands" indicator. Upper and lower price range levels are determined by price envelopes. By default, Bollinger Bands are plotted in Tradingview as envelopes at a standard deviation level above and below the price's simple moving average (SMA). I attempted to modify the indicator in this version by adding several kinds of moving averages first. The key feature is that standard deviation should be modified. in Tradingview, SMA calculates the standard deviation. The allocated moving average should be used to calculate the std function when the base line is changed.
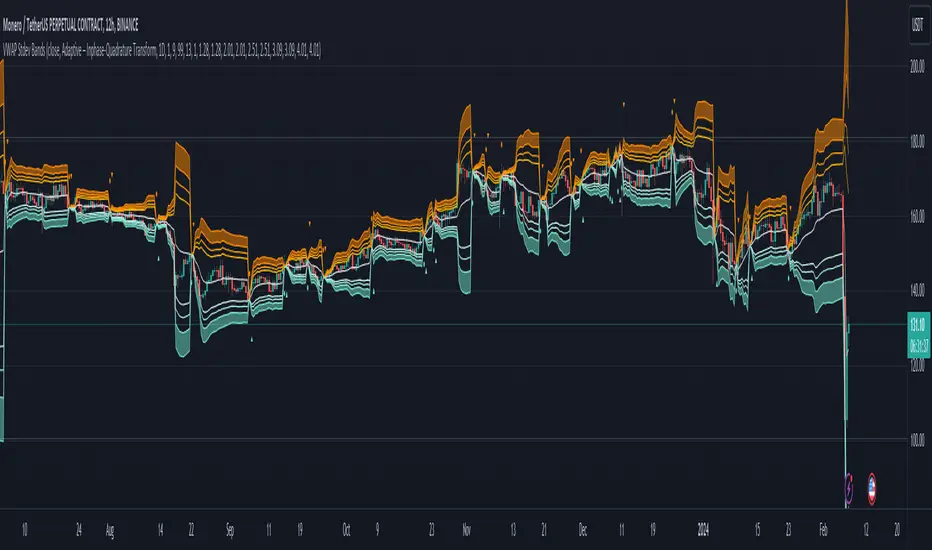
Adaptive VWAP Stdev BandsIntroduction
Heyo, here are some adaptive VWAP Standard Deviation Bands with nice colors.
I used Ehlers dominant cycle theories and ZLSMA smoothing to create this indicator.
You can choose between different algorithms to determine the dominant cycle and this will be used as reset period.
Everytime bar_index can be divided through the dominant cycle length and the result is zero VWAP resets if have chosen an adaptive mode in the settings.
The other reset event you can use is just a simple time-based event, e.g. reset every day.
Usage
I think people buy/sell when it reaches extreme zones.
Enjoy!
---
Credits to:
@SandroTurriate - VWAP Stdev Bands
@blackcat1402 - Dominant Cycle Analysis
@DasanC - Dominant Cycle Analysis
@veryfid - ZLSMA
(Sry, too lazy for linking)
I took parts of their code. Ty guys for your work! Just awesome.
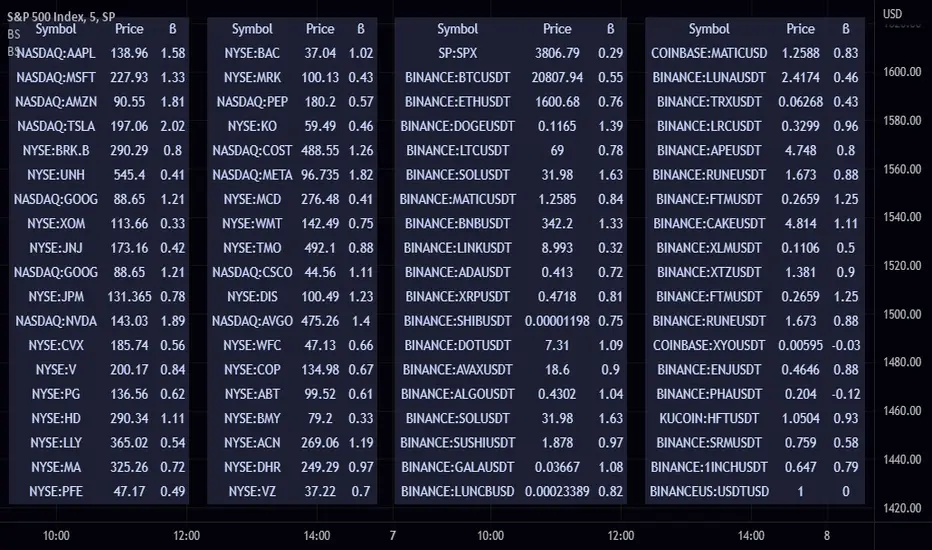
Beta ScreenerThis script allows you to screen up to 38 symbols for their beta. It also allows you to compare the list to not only SPY but also CRYPTO10! Features include custom time frame and custom colors.
Here is a refresher on what beta is:
Beta (β) is a measure of the volatility—or systematic risk—of a security or portfolio compared to the market as a whole (usually the S&P 500 ). Stocks with betas higher than 1.0 can be interpreted as more volatile than the S&P 500 .
Beta is used in the capital asset pricing model (CAPM), which describes the relationship between systematic risk and expected return for assets (usually stocks). CAPM is widely used as a method for pricing risky securities and for generating estimates of the expected returns of assets, considering both the risk of those assets and the cost of capital.
How Beta Works
A beta coefficient can measure the volatility of an individual stock compared to the systematic risk of the entire market. In statistical terms, beta represents the slope of the line through a regression of data points. In finance, each of these data points represents an individual stock's returns against those of the market as a whole.
Beta effectively describes the activity of a security's returns as it responds to swings in the market. A security's beta is calculated by dividing the product of the covariance of the security's returns and the market's returns by the variance of the market's returns over a specified period.
cov (a,b)/var(b)
Variety N-Tuple Moving Averages w/ Variety Stepping [Loxx]Variety N-Tuple Moving Averages w/ Variety Stepping is a moving average indicator that allows you to create 1- 30 tuple moving average types; i.e., Double-MA, Triple-MA, Quadruple-MA, Quintuple-MA, ... N-tuple-MA. This version contains 2 different moving average types. For example, using "50" as the depth will give you Quinquagintuple Moving Average. If you'd like to find the name of the moving average type you create with the depth input with this indicator, you can find a list of tuples here: Tuples extrapolated
Due to the coding required to adapt a moving average to fit into this indicator, additional moving average types will be added as they are created to fit into this unique use case. Since this is a work in process, there will be many future updates of this indicator. For now, you can choose from either EMA or RMA.
This indicator is also considered one of the top 10 forex indicators. See details here: forex-station.com
Additionally, this indicator is a computationally faster, more streamlined version of the following indicators with the addition of 6 stepping functions and 6 different bands/channels types.
STD-Stepped, Variety N-Tuple Moving Averages
STD-Stepped, Variety N-Tuple Moving Averages is the standard deviation stepped/filtered indicator of the following indicator
Last but not least, a big shoutout to @lejmer for his help in formulating a looping solution for this streamlined version. this indicator is speedy even at 50 orders deep. You can find his scripts here: www.tradingview.com
How this works
Step 1: Run factorial calculation on the depth value,
Step 2: Calculate weights of nested moving averages
factorial(depth) / (factorial(depth - k) * factorial(k); where depth is the depth and k is the weight position
Examples of coefficient outputs:
6 Depth: 6 15 20 15 6
7 Depth: 7 21 35 35 21 7
8 Depth: 8 28 56 70 56 28 8
9 Depth: 9 36 34 84 126 126 84 36 9
10 Depth: 10 45 120 210 252 210 120 45 10
11 Depth: 11 55 165 330 462 462 330 165 55 11
12 Depth: 12 66 220 495 792 924 792 495 220 66 12
13 Depth: 13 78 286 715 1287 1716 1716 1287 715 286 78 13
Step 3: Apply coefficient to each moving average
For QEMA, which is 5 depth EMA , the calculation is as follows
ema1 = ta. ema ( src , length)
ema2 = ta. ema (ema1, length)
ema3 = ta. ema (ema2, length)
ema4 = ta. ema (ema3, length)
ema5 = ta. ema (ema4, length)
In this new streamlined version, these MA calculations are packed into an array inside loop so Pine doesn't have to keep all possible series information in memory. This is handled with the following code:
temp = array.get(workarr, k + 1) + alpha * (array.get(workarr, k) - array.get(workarr, k + 1))
array.set(workarr, k + 1, temp)
After we pack the array, we apply the coefficients to derive the NTMA:
qema = 5 * ema1 - 10 * ema2 + 10 * ema3 - 5 * ema4 + ema5
Stepping calculations
First off, you can filter by both price and/or MA output. Both price and MA output can be filtered/stepped in their own way. You'll see two selectors in the input settings. Default is ATR ATR. Here's how stepping works in simple terms: if the price/MA output doesn't move by X deviations, then revert to the price/MA output one bar back.
ATR
The average true range (ATR) is a technical analysis indicator, introduced by market technician J. Welles Wilder Jr. in his book New Concepts in Technical Trading Systems, that measures market volatility by decomposing the entire range of an asset price for that period.
Standard Deviation
Standard deviation is a statistic that measures the dispersion of a dataset relative to its mean and is calculated as the square root of the variance. The standard deviation is calculated as the square root of variance by determining each data point's deviation relative to the mean. If the data points are further from the mean, there is a higher deviation within the data set; thus, the more spread out the data, the higher the standard deviation.
Adaptive Deviation
By definition, the Standard Deviation (STD, also represented by the Greek letter sigma σ or the Latin letter s) is a measure that is used to quantify the amount of variation or dispersion of a set of data values. In technical analysis we usually use it to measure the level of current volatility .
Standard Deviation is based on Simple Moving Average calculation for mean value. This version of standard deviation uses the properties of EMA to calculate what can be called a new type of deviation, and since it is based on EMA , we can call it EMA deviation. And added to that, Perry Kaufman's efficiency ratio is used to make it adaptive (since all EMA type calculations are nearly perfect for adapting).
The difference when compared to standard is significant--not just because of EMA usage, but the efficiency ratio makes it a "bit more logical" in very volatile market conditions.
See how this compares to Standard Devaition here:
Adaptive Deviation
Median Absolute Deviation
The median absolute deviation is a measure of statistical dispersion. Moreover, the MAD is a robust statistic, being more resilient to outliers in a data set than the standard deviation. In the standard deviation, the distances from the mean are squared, so large deviations are weighted more heavily, and thus outliers can heavily influence it. In the MAD, the deviations of a small number of outliers are irrelevant.
Because the MAD is a more robust estimator of scale than the sample variance or standard deviation, it works better with distributions without a mean or variance, such as the Cauchy distribution.
For this indicator, I used a manual recreation of the quantile function in Pine Script. This is so users have a full inside view into how this is calculated.
Efficiency-Ratio Adaptive ATR
Average True Range (ATR) is widely used indicator in many occasions for technical analysis . It is calculated as the RMA of true range. This version adds a "twist": it uses Perry Kaufman's Efficiency Ratio to calculate adaptive true range
See how this compares to ATR here:
ER-Adaptive ATR
Mean Absolute Deviation
The mean absolute deviation (MAD) is a measure of variability that indicates the average distance between observations and their mean. MAD uses the original units of the data, which simplifies interpretation. Larger values signify that the data points spread out further from the average. Conversely, lower values correspond to data points bunching closer to it. The mean absolute deviation is also known as the mean deviation and average absolute deviation.
This definition of the mean absolute deviation sounds similar to the standard deviation (SD). While both measure variability, they have different calculations. In recent years, some proponents of MAD have suggested that it replace the SD as the primary measure because it is a simpler concept that better fits real life.
For Pine Coders, this is equivalent of using ta.dev()
Bands/Channels
See the information above for how bands/channels are calculated. After the one of the above deviations is calculated, the channels are calculated as output +/- deviation * multiplier
Signals
Green is uptrend, red is downtrend, yellow "L" signal is Long, fuchsia "S" signal is short.
Included:
Alerts
Loxx's Expanded Source Types
Bar coloring
Signals
6 bands/channels types
6 stepping types
Related indicators
3-Pole Super Smoother w/ EMA-Deviation-Corrected Stepping
STD-Stepped Fast Cosine Transform Moving Average
ATR-Stepped PDF MA

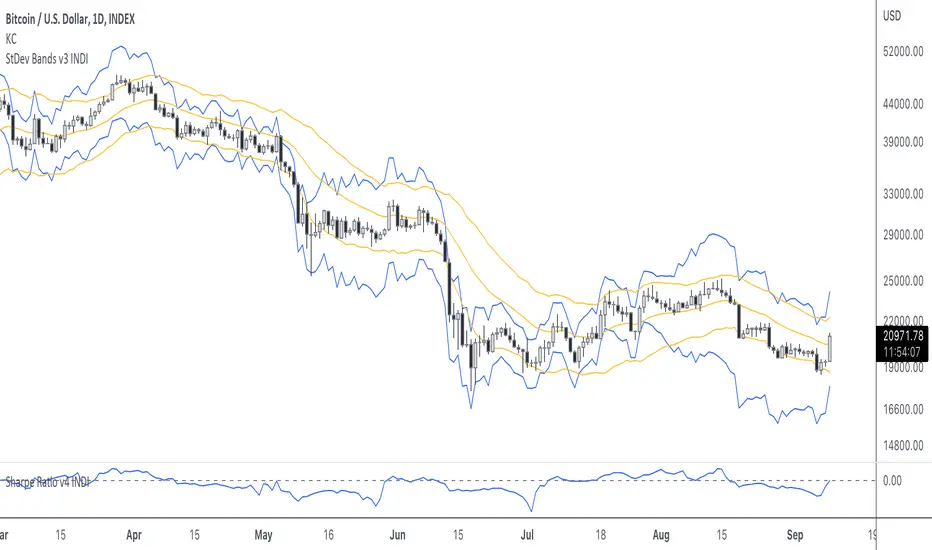
StDev BandsThis is a "bands"-type indicator. It was developed out of my Sharpe Ratio indicator . It uses the standard deviation of returns as basis for drawing the bands. I'm going to update this indicator as the other indicator evolves. Please be sure you know how to calculate Sharpe Ratio and check out the Sharpe Ratio indicator as well. This will help you understand the purpose of this indicator a bit more.
As a very short introduction. Many investors use the standard deviation of returns as risk measurement . I admit the defaults of this indicator aren't perfect. Normally investors use the standard deviation over a 1 year period. Traditional finance uses 265 days, and because crypto never sleeps, we could use 365. I defaulted it to 20.
ER-Adaptive ATR, STD-Adaptive Damiani Volatmeter [Loxx]ER-Adaptive ATR, STD-Adaptive Damiani Volatmeter is a Damiani Volatmeter with both Efficiency-Ratio Adaptive ATR, used in place of ATR, and Adaptive Deviation, used in place of Standard Deviation.
What is Adaptive Deviation?
By definition, the Standard Deviation (STD, also represented by the Greek letter sigma σ or the Latin letter s) is a measure that is used to quantify the amount of variation or dispersion of a set of data values. In technical analysis we usually use it to measure the level of current volatility .
Standard Deviation is based on Simple Moving Average calculation for mean value. This version of standard deviation uses the properties of EMA to calculate what can be called a new type of deviation, and since it is based on EMA , we can call it EMA deviation. And added to that, Perry Kaufman's efficiency ratio is used to make it adaptive (since all EMA type calculations are nearly perfect for adapting).
The difference when compared to standard is significant--not just because of EMA usage, but the efficiency ratio makes it a "bit more logical" in very volatile market conditions.
The green line is the Adaptive Deviation, the white line is regular Standard Deviation. This concept will be used in future indicators to further reduce noise and adapt to price volatility .
See here for a comparison between Adaptive Deviation and Standard Deviation
What is Efficiency Ratio Adaptive ATR?
Average True Range (ATR) is widely used indicator in many occasions for technical analysis . It is calculated as the RMA of true range. This version adds a "twist": it uses Perry Kaufman's Efficiency Ratio to calculate adaptive true range
See here for a comparison between Efficiency-Ratio Adaptive ATR, and ATR.
What is the Damiani Volatmeter?
Damiani Volatmeter uses ATR and Standard deviation to tease out ticker volatility so you can better understand when it's the ideal time to trade. The idea here is that you only take trades when volatility is high so this indicator is to be coupled with various other indicators to validate the other indicator's signals. This is also useful for detecting crabbing and chopping markets.
Shoutout to user @xinolia for the DV function used here.
Anything red means that volatility is low. Remember volatility doesn't have a direction. Anything green means volatility high despite the direction of price. The core signal line here is the green and red line that dips below two while threshold lines to "recharge". Maximum recharge happen when the core signal line shows a yellow ping. Soon after one or many yellow pings you should expect a massive upthrust of volatility . The idea here is you don't trade unless volatility is rising or green. This means that the Volatmeter has to dip into the recharge zone, recharge and then spike upward. You can also attempt to buy or sell reversals with confluence indicators when volatility is in the recharge zone, but I wouldn't recommend this. However, if you so choose to do this, then use the following indicator for confluence.
And last reminder, volatility doesn't have a direction! Red doesn't mean short, and green doesn't mean long, Red means don't trade period regardless of direction long/short, and green means trade no matter the direction long/short. This means you'll have to add an indicator that does show direction such as a mean reversion indicator like Fisher Transform or a Gaussian Filter. You can search my public scripts for various Fisher Transform and Gaussian Filter indicators.
Price-Filtered Spearman Rank Correl. w/ Floating Levels is considered the Mercedes Benz of reversal indicators
Comparison between this indicator, ER-Adaptive ATR, STD-Adaptive Damiani Volatmeter , and the regular Damiani Volatmeter . Notice that the adaptive version catches more volatility than the regular version.
How signals work
RV = Rising Volatility
VD = Volatility Dump
Plots
White line is signal
Thick red/green line is the Volatmeter line
The dotted lower lines are the zero line and minimum recharging line
Included
Bar coloring
Alerts
Signals
Related indicators
Variety Moving Average Waddah Attar Explosion (WAE)
Damiani Volatmeter
