Stochastic Momentum Index (SMI) Refurbished▮Introduction
Stochastic Momentum Index (SMI) Indicator is a technical indicator used in technical analysis of stocks and other financial instruments.
It was developed by William Blau in 1993 and is considered to be a momentum indicator that can help identify trend reversal points.
Basically, it's a combination of the True Strength Index with a signal line to help identify turning points in the market.
SMI uses the stochastic formula to compare the current closing price of an asset with the maximum and minimum price range over a specific period.
He then compares this ratio to a short-term moving average to create an indicator that oscillates between -100 and +100.
When the SMI is above 0, it is considered positive, indicating that the current price is above the short-term moving average.
When it is below 0, it is considered negative, indicating that the current price is below the short-term moving average.
Traders use the SMI to identify potential trend reversal points.
When the indicator reaches an extreme level above +40 or below -40, a trend reversal is possible.
Furthermore, traders also watch for divergences between the SMI and the asset price to identify potential trading opportunities.
It is important to remember that the SMI is a technical indicator and as such should be used in conjunction with other technical analysis tools to get a complete picture of the market situation.
▮ Improvements
The following features were added:
1. 7 color themes, for TSI, Signal and Histogram.
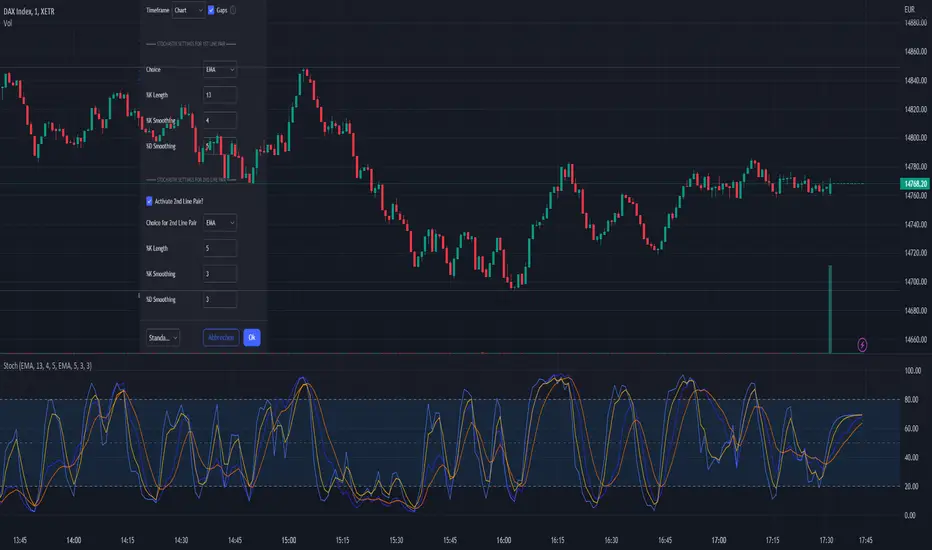
2. Possibility to customize moving average type for TSI/Signal.
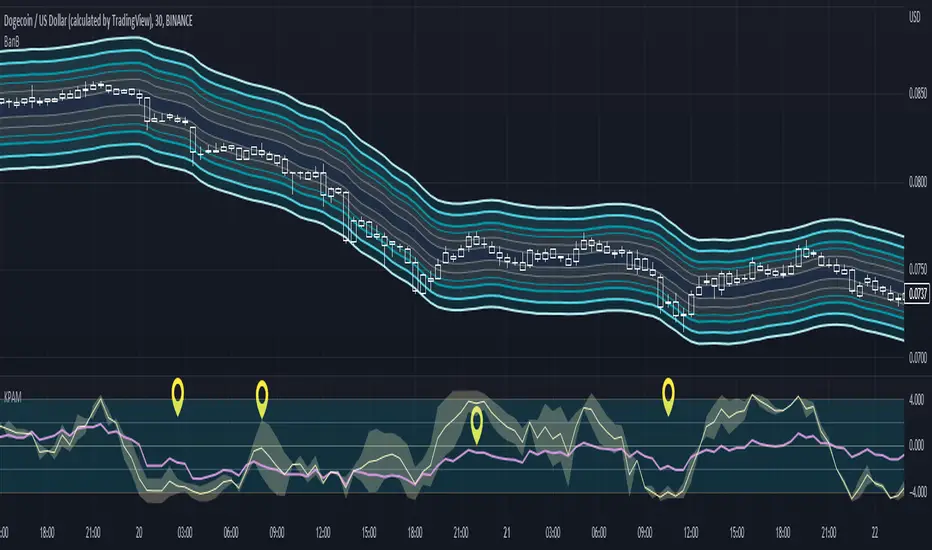
3. Dynamic Zones.
4. Crossing Alerts.
5. Alert points on specific ranges.
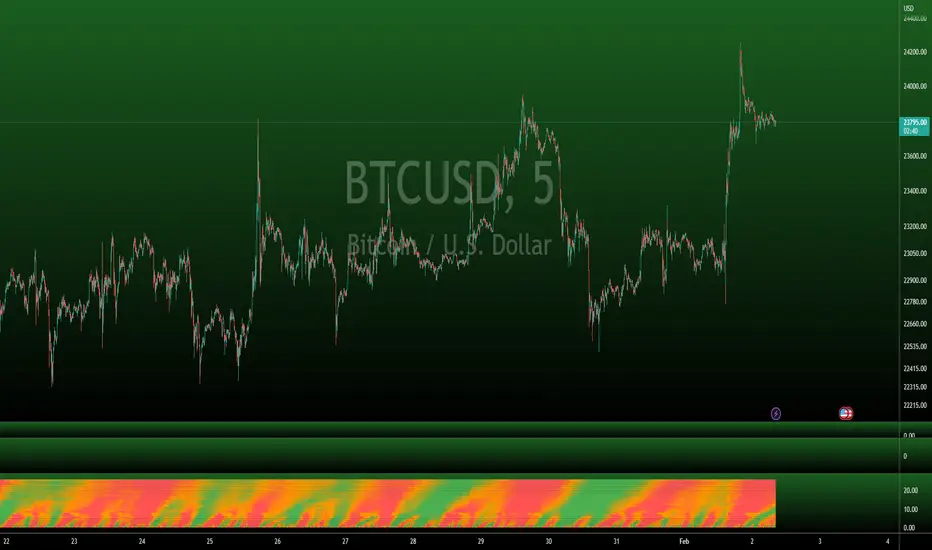
5. Coloring of bars according to TSI/Signal/Histogram.
▮ Themes
Examples:
▮ About Dynamic Zones
'Most indicators use a fixed zone for buy and sell signals.
Here's a concept based on zones that are responsive to the past levels of the indicator.'
The concept of Dynamic Zones was described by Leo Zamansky ( Ph .D.) and David Stendahl, in the magazine of Stocks & Commodities V15:7 (306-310).
Basically, a statistical calculation is made to define the extreme levels, delimiting a possible overbought/oversold region.
Given user-defined probabilities, the percentile is calculated using the method of Nearest Rank.
It is calculated by taking the difference between the data point and the number of data points below it, then dividing by the total number of data points in the set.
The result is expressed as a percentage.
This provides a measure of how a particular value compares to other values in a data set, identifying outliers or values that are significantly higher or lower than the rest of the data.
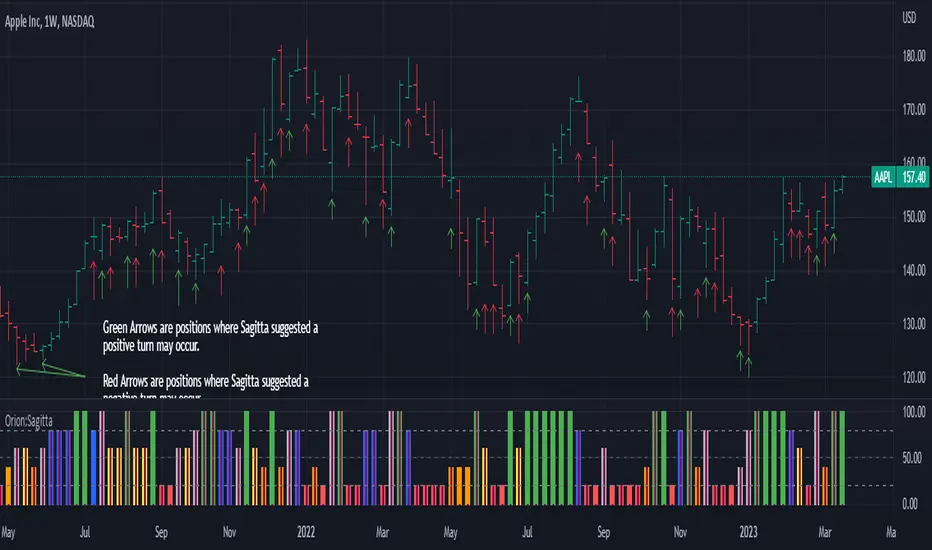
▮ What to look for
1. Divergences/weakening of a trend/reversal:
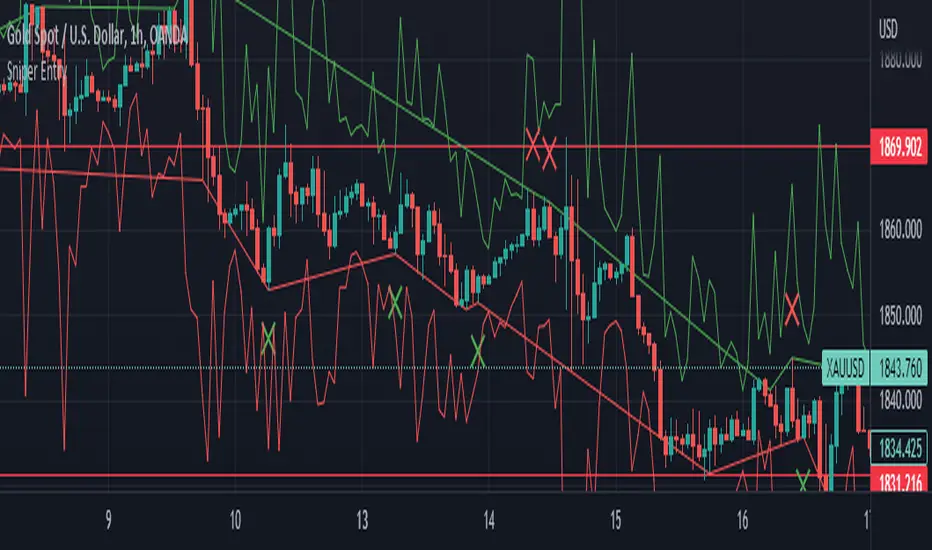
2. Supports, resistances, pullbacks:
3. Overbought/Oversold Points:
▮ Thanks and Credits
- TradingView and PineCoders: for SMI and Moving Averages
- allanster: for Dynamic Zones
مؤشر Pine Script®