Strategy Execution Template - Master PatternThis script is a template to execute your strategy with Stop Loss and Take Profit and showing Trades.
Then, you can write your strategy without taking care of Stop Loss and Take Profit method.
3x Fixed Percent Stop Loss, Trailing Percent Stop Loss, Trailing ATR Stop Loss, Tailing HHLL Stop Loss
3x Fixed Percent, Take Profit
Stoploss

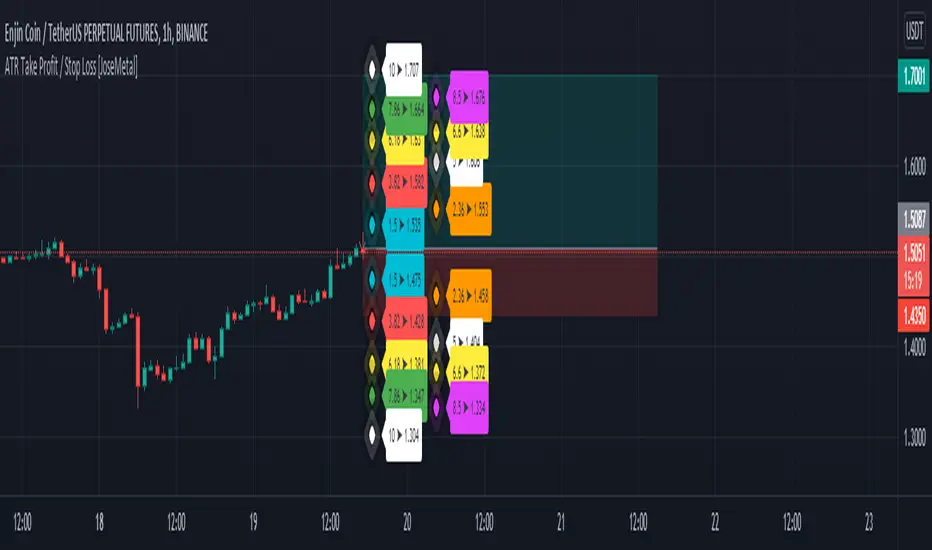
ATR Take Profit / Stop Loss [JoseMetal]============
ENGLISH
============
- Description:
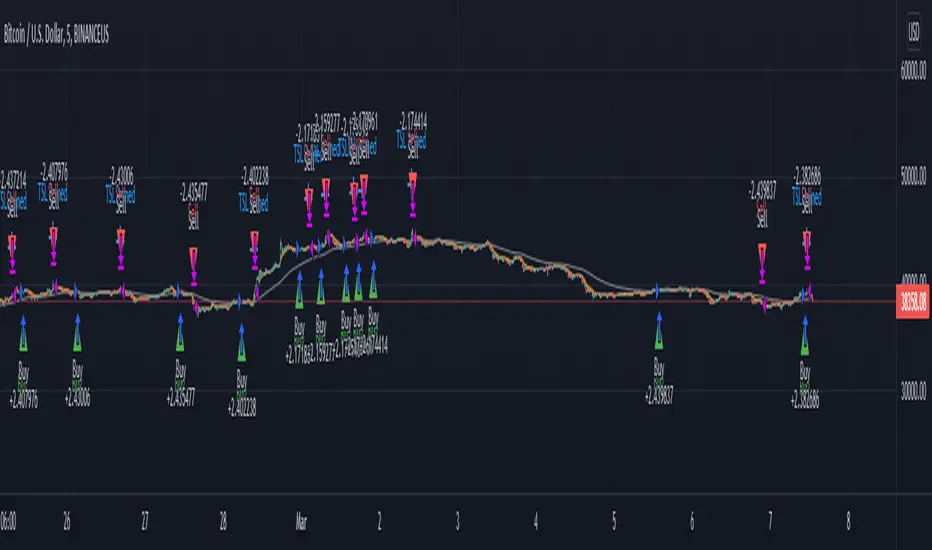
This indicator is based on ATR to print current ATR multiple values for Take Profits or Stop Loss levels, it's real time, so you can use the replay feature to test it or calculate these levels anytime on any candle.
Therefore, levels are calculated by multiplying the ATR by the level multiplier.
- Visual:
Both a "diamond" and label with the ATR multiplier and price value are printed for each level.
Each level has a color for both, diamond and label to make it easier to read.
The levels are split in 2 columns for better visualization.
- Usage and recommendations:
Fibonacci's levels are used for default, but you can customize them as you like.
I usually take 3.82 level (red by default) as stop loss, and I take profit every 2 levels depending on the timeframe, is good to let a small part run until break even or ATR 10 (last level).
- Customization:
Custom ATR period, 10 is default.
Each level has custom multiplier and level.
Customizable offset for diamonds and labels.
Custom precision for prices (because it greatly depends on the asset you're working with).
============
ESPAÑOL
============
- Descripción:
Este indicador se basa en el ATR para mostrar múltiples niveles de Take Profits o Stop Loss, es en tiempo real, por lo que se puede utilizar la función de repetición para probarlo o calcular estos niveles en cualquier momento y en cualquier vela.
Por lo tanto, los niveles se calculan multiplicando el ATR por el multiplicador del nivel.
- Visual:
Tanto un "diamante" como una etiqueta con el multiplicador ATR y el valor del precio se imprimen para cada nivel.
Cada nivel tiene un color tanto para el diamante como para la etiqueta para facilitar su lectura.
Los niveles están divididos en 2 columnas para una mejor visualización.
- Uso y recomendaciones:
Se usan los niveles de Fibonacci defecto, pero puedes personalizarlos como quieras.
Yo suelo usar el nivel 3.82 (rojo por defecto) como stop loss, y tomo beneficios cada 2 niveles dependiendo de la temporalidad, es bueno dejar correr una pequeña parte hasta el break even o ATR 10 (último nivel).
- Personalización:
Periodo ATR personalizable, 10 es el predeterminado.
Cada nivel tiene multiplicador y nivel personalizables.
Desplazamiento (offset) personalizable para los diamantes y las etiquetas.
Precisión para decimales personalizada (porque depende mucho del activo con el que se trabaje).
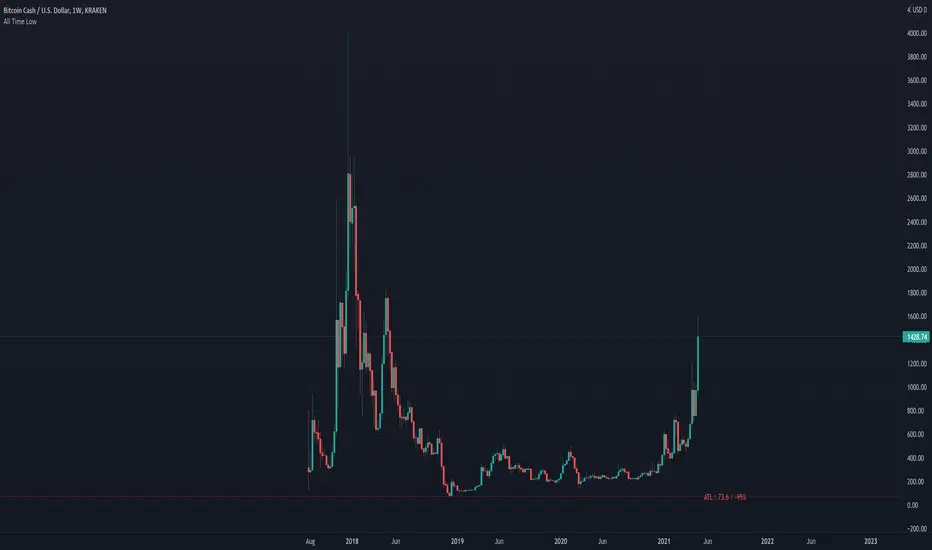
All Time LowThis script is to remind you of how much you would lose if the price went down to the all time low.
This will make you think twice about your purchases!
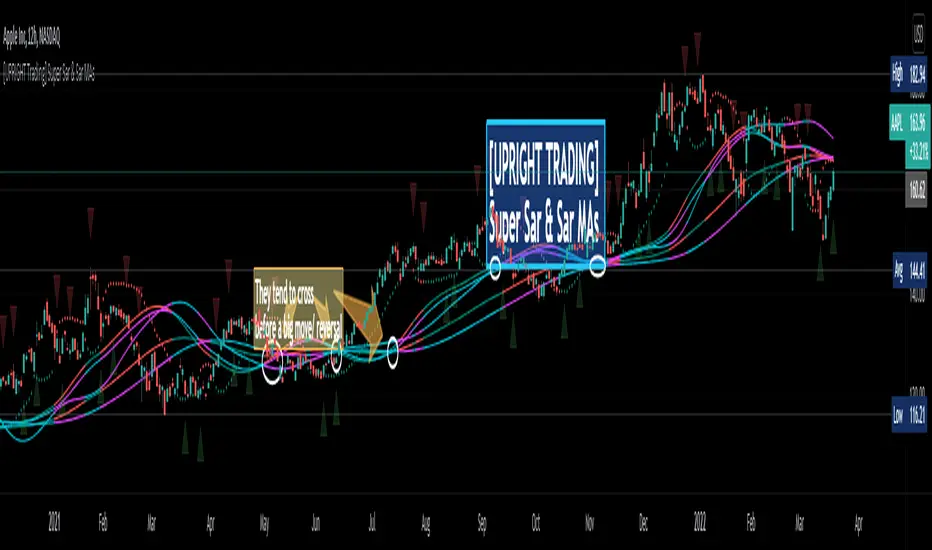
[UPRIGHT Trading] Super Sar & (New) Sar Moving Averages (cc)Hello Traders,
(This is an original creation and a proof of concept.)
As most of you know the PSAR, parabolic SAR indicator, was developed by J. Welles Wilder Jr. and used to determine trend direction and potential reversals in price. This technical indicator uses a trailing stop and reverse method, 'SAR,' or "stop and reverse," to find potential exit and entry points.
My question was: Is it possible to create meaningful Moving Averages by using PSAR?
Turns out, the answer is yes.
As you can see on the above chart, not only is it possible, it does work.
Features:
I've created buy/sell signals, which act as early indication of a potential reversal.
5 original MAs.
My Super Sar
Customizability: For now, the ability to adjust the length and turn on/off the MAs (maybe more features to come).
Enjoy!
As always, please: Like, Follow, Support, etc...
Cheers,
Mike
(UPRIGHT Trading)
ATRStopLossFinderLibrary "ATRStopLossFinder"
Average True Range Stop Loss Finder
credits to www.tradingview.com for the initial version
stopLossFinder(length, smoothing, multiplier, refHigh, refLow, refClose) Returns the stop losses for an entry on this candle, depending on the ATR
Parameters:
length : simple int optional to select the lookback amount of candles
smoothing : string optional to select the averaging method, options=
multiplier : simple float optional if you want to tweak the speed the trend changes.
refHigh : series float optional if you want to use another timeframe or symbol, pass it's 'high' series here
refLow : series float optional if you want to use another timeframe or symbol, pass it's 'low' series here
refClose : series float optional if you want to use another timeframe or symbol, pass it's 'close' series here
Returns: series float stopLossLong, series float stopLossShort, series float atr

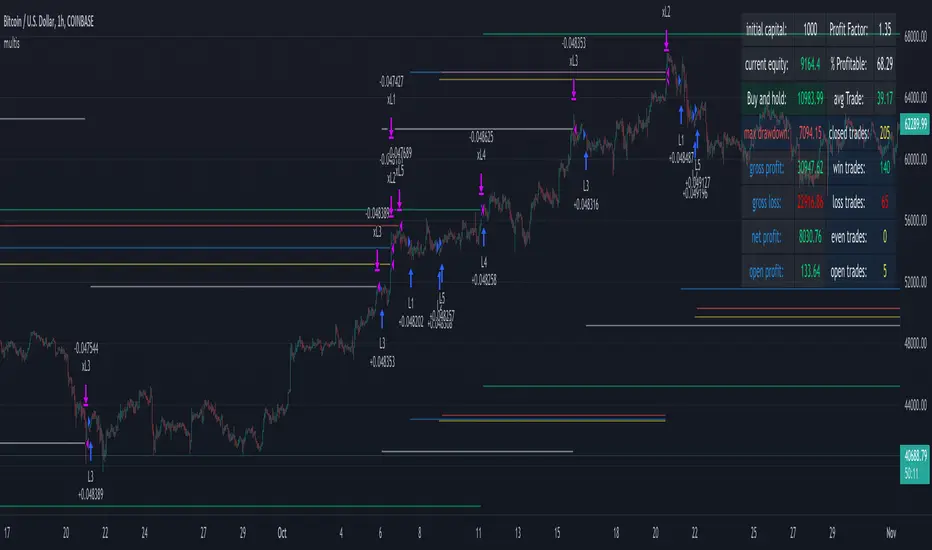
multiple orders - strategy - educationalHi,
Here is a 'template', using array's, for multiple orders and different SL/TP levels per trade (This is an example with max 5 open trades)
The 'switch' makes sure that the first available position will be used,
for example, when 'L1' is closed in the past, and a buy condition is triggered, position 'L1' will be filled,
should it be that 'L1', 'L2', 'L3' are already filled, then position 'L4' will be filled, ...
An extra table is added with data of the trades
Be aware, the 'Buy and Hold' resembles the profit when 100% of the available equity has been bought at the time of the very first trade and sold now. On the other hand, the positions work with a % of equity, 20% per trade (5 x 20 = 100%)
You can see that every trade exits on its own terms, without interference of other trades
Important, this technique only works if in the strategy() function:
- close_entries_rule -> set at 'ANY'
- pyramiding is set at max amount of trades or higher (in this case 5 or higher)
Cheers!
SuperTrend Multiple Risk Management SystemThis is an improved SuperTrend strategy that makes use of multiple types of risk management options.
We have for example :
1. Take profit and stop loss levels based on support and resistence created with RSI and Pivot Lines(dynamic)
For example, if we have an oversold level and a pivot low , we can take that low point for support.(or resistence for short)
If instead we have an overbought level and a pivot high, we can take that high point for resistence.(orsupport for short)
2. Take profit and stop loss levels based on swing low and swing high points calculated with highest high and lowest low function(dynamic)
For example we take the lowest point in the last 100 candles. We calculate the distance from the current point to that one, and we apply this value as a take profit point. Same for stop loss
3. Take profit and stop loss levels based on % movements(fixed)
For example we have a tp or sl of 10%. If either of them make a movement of 10% from the entry point, they will get triggered.
4. Break even stop loss once the asset moves certain % in our direction.
For example we have a long breakeven of 5%. If the asset moves 5% in our direction, we move the stop loss on the entry point so if the trade pullback and crosses with this point it will exit from the trade.
Notes:
All the exits from the strategy are happening at the end of the candle close, since we are checking if inside the current candle we cross with either high or low of the candles parts the set prices from any of the above options.
At the same time we can combine multiple of them into one, and we can either exit based on which one was hit first, or use a quantity reduction of the trade and exit multiple times when we hit any of the levels.
This tool is for educational purpose only.
Its main purpose is to show the difference between having a risk management or without.
For example on this scenario of BTC USD 4h, I found out that the drawdawn was reduced by more than half when using different type of risk management, compared to not use one at all, while at the same time increasing the profits by a huge margin.

PCT Trailing Stoploss-Strategy
I am not a financial advisor and this is not financial advice. This is provided for illustration only for a Percent based Trailing Stoploss.
I have been looking for a Percent based Trailing Stoploss and have not been able to find one that would work for me so I wrote my own. This works in both a Strategies and Indicators I put comments inline of where to add or remove comments// depending on which one you are aiming for. The simple EMA crossovers are there just to give the strategy something to do. To use, copy the Stoploss section, the inputs at the top, and the reset under the sell section to your own script. When I first started out I found the code for removing the redundant signals and then used it in most of my scripts. For the life of me I do not remember where I got it - either in a comment in Tradingview or on a reddit post, so if you wrote that part, thank you.
About me:
I have only been working with PineScript since January 2022 and have never been much of a coder from a professional standpoint but decided to jump in and learn Pine mainly because I am a crap, emotional trader and this way I can remove that aspect of it and lose my money programmatically as opposed to making it a conscious decision :)
[BA] ATR Stop LineThis indicator helps you to set your stoploss levels by using ATR. Traders often use atr values in order to calculate their stoploss levels.
This indicator does the calculation for you and draw two tiny lines without messing up the chart so that you can easily see your stoploss levels and get an idea about the volatility and risk amount as well.
One line is below the last candle as a long trade stop loss level and the other one is above the last candle as a short trade stop loss level.
Calculation is simple:
For short trades, 2 times ATR added to last price;
For long trades, 2 times ATR subtracted from last price.
You can change ATR length, ATR multiplier and the line length.
Good luck.

Position Size Calc. (Risk Management Tool)Programmed this tool to help prevent overtrading.
Example of application:
Suppose you want to trade ETHUSDT on a 1 minute chart and you are only willing to risk $10 in one single trade. This way, if you get stopped out, then you will only lose $10. Say you are using ATR based stop loss at 2x current ATR to set the initial stop. All these variables are now fixed, so you must make an adjustment to the size of your position.
Quick illustration: Tolerable loss per trade is $10 , the current ATR of ETHUSDT is $4.06, the size of your stop is $8.12 (4.06*2), then your position size should be 1.2 ETH ($10/$8.12).
This script will constantly monitor the current ATR and display the optimal position size on chart. Tolerable loss (aka "Risk amount") is defined by user in settings. Lines showing the size of SL and TPs on chart are optional, it was added to the script to help users draw the long/short position measuring tools built into TradingView.
Other notes: Always consider market liquidity, size of bid-ask spreads, and the possibilities of gap ups/downs. It can never be guaranteed that stop market/limit orders will get filled at desirable prices. Actual stop losses might differ.

Buy Monday, Exit Tuesday with Stop Loss and Take ProfitStrategy to go long at end of Monday before market closes and exit before Tuesday close, or at stop loss or take profit percentages
This runs strategy on entering by weekday name and also by session time.
Implemented are also Take Profit and Stop Loss to exit position using custom inputs.
Added stoploss and take profit plot lines

Anna-LysaEspecially useful when using it for stocks in intraday screening for daytrading.
This gives you quick information about the volatility at the moment when you look at the stock.
The current range of the last candles (adjustable) is calculated so that you can stop based on the Vola.
In addition, the daily volume and daily range are calculated in the table and what is left of the average.
So that you can adjust your ideas for the movement in order to take profit. No matter what the timeframe, you can see how the volume compares to that of the previous few candles and thus anticipate the most likely breakout.
Then the most relevant day trading levels ( Premarkets, Lastday high/lows and some Ma´s ) are shown so that you can get a very fast overview of the stock at the moment.
All levels and labels and colors are adjustable or hidden in the settings.

MACD Cross [Momentum & Trend Filter]This is MTF MACD crossover and crossunder, with EMA trend filter and MTF RSI overbought/oversold filter.
Guidelines:
- User can set stop loss, take profit target and risk to reward ratio in setting
- ATR Stop and ATR Multiplier are use to set stop loss and take profit levels, setting are varies depend on what you are trading, play around and find appropriate number
- Don't trade if range between stop loss and target profit are too small or if there are too many small range try to increase multiplier
- If MACD Zero Line Filter enable, detect MACD crossover only under zero line for LONG, and detect MACD crossunder only above zero line for SHORT
- If EMA Trend Filter enable, detect MACD crossover which price above EMA for LONG, and detect MACD crossunder which price below EMA for SHORT
- RSI timeframe 1-3 should not lower than chart timeframe to display Overbought and Oversold correctly
- Enable MTF Overbought and Oversold just to display red background for Overbought, and green background for Oversold
There are 3 alert options:
(For those free user which can get only 1 alert, please choose "MACD crossover & crossunder" if you want to get alert for both long and short directions)
Have fun :)

action zone - ATR stop reverse order strategy v0.1 by 9nckACTION ZONE-ATR MOD v0.1 DOCUMENTATION
Overview
This tradingview pine script strategy is mainly created to enrich my coding skill. It is a combination of “CDC-ACTIONZONE” and my personal studies of trading techniques in various sources e.g.book, course or blog. This strategy purposefully built to connect with my automatic trading bot. However, It will be very useful to aid your trading routine by diminishing mental distraction which possibly leads to bad trades.
How does it work?
This strategy will do a basic simple thing that most traders do by creating entry signals on both sides long/short and also set the stop loss. Furthermore, It will also reverse the order (from long to short and vice versa (if long/short conditions are met). Finally, it will recalculate the stop loss/take profit price in every complete bar to increase the chance of winning and limit our loss.
Entry rules(Long/Short)
If you have no open order, an order will be created when a fast EMA crosses(up(long)/down(short) the slow EMA(It’s as simple as that).
If you have an open order, the current order will be (sold if long, covered if short) and the opposite side order will be created.
Exit and Reverse rules(Long/Short)
If fast EMA cross (DOWN(long), UP(short)), the current order will be closed, THE OPPOSITE SIDE ORDER WILL ALSO BE CREATED.
Risk management
FLEX STOP PRICE : initial value will be set at the bar which order created. It is a fast ema (+/-) MIDDLE ATR value.
If MIDDLE ATR value rises, it will be our new stop price.
If MIDDLE ATR value falls, stop price unchanged
If Price OVERBOUGHT(long)/SOLD(short), LOW of that bar will be a new stop price.
Minimum position hold period
In order to eliminate risk of repeatedly open, close orders in sideway trends. Minimum hold period must be passed to start exit our position. However, It always respects stop loss prices. The value refers to the number of bars.
MUST READ!!!
This strategy uses only MARKET ORDER. If you trade with a bot, make sure you choose only enormous market cap tokens.
This strategy is bi-direction strategy. It will work best in the DERIVATIVE market.
It was initially designed to compete in the cryptocurrency market which has very high volume and volatility.
I only use this strategy in 1HR (acceptable change rate, optimum trade frequency)
How (should) we use it?
Choose crypto future pairs (recommend only top 10-15 market volume pairs in Binance, let’s say 1000M+ trade value)
Choose your time frame (1H is strongly recommended)
Setup your portfolio profile (Setting->Properties) such as Initial cap, order size, commission. DO NOT USE CAL ON EVERY TICK IT WILL CAUSE REPAINTING AND YOUR CAPITAL IS BLEEDING !!!
BACKTEST FIRST!! Back test is a combination of art, math and statis(and a bit of luck). You can apply to train and test methods or whatever you are familiar with. In my opinion, your test period should include UPTREND, SIDEWAY, DOWNTREND. Fine tune fast, slow ema first(my best ema length of 1H timeframe around 7-10, 17-22). Try to eliminate fault breakout trade and use other options only necessary. Hopefully we can use automatic optimization on Pine Script soon.
Don’t forget to turn off using a specific backtest date option to start your strategy.A
THIS IS NOT A PERFECT (OR EVEN PROFITABLE) STRATEGY. USE AT YOUR OWN RISK AND TRADE RESPONSIBLY. DYOR DUDE.

SignalsThis script allows you to calculate position size, and future profit, loses.
- You can add 3 target values and 1 stop loss
- Optionally you can display table, position it as you like, and see risk ratio
Plans:
- add profit loss to the labels

Kzx PT mod v1.0 by RX-RAYKzx Position tracker mod v1.0 by RX-RAY
Original script by K-zax
The modification was made for the USDRUB ticker (the number of digits in the values of price, interest, lot volume and profit loss for other tickers may affect the positioning of the inscription, but it is fully operative and it may be used with other tickers )
Typical label view:
74.30 - ENTRY PRICE
+/-0.16% - % of price chang ( range +/-9.99)
20 - position value (range 0-99)
(S) - position type (L) - long (S) - short
+/-0017 - actual profit/loss in cash (range +/- 9999)
(All range value for correct label position,
but script mod can be used out off range)
List of additions and changes:
1. Added display of position value, short / long position type and profit / loss value (including broker commission).
2. Positive interest change now corresponds to profit, negative change in interest to loss in accordance with the type of position ( short/long )
3. The position of the inscription and the digits of the values are fixed and now insignificantly depends on the change in the time interval and the change in the scale of the graph and the change in data values and their signs.
4. Added changing the color of the inscription in the situation positive price change, but profit < commission fee. (critical gain).

Heikin Ashi Trailing Stoploss ActivationThe Basics
This indicator should be used on regular candle sticks. It is possible to trigger an alert, when the block flips from red to green bar. Or vice versa.
Red block represents a red Heikin Ashi candle.
Green block for green Heikin Ashi candle.
It can be used as a trailing stoploss for (DCA/ TV) bots, when riding trends.
What Makes It Different
The user can preset the price (of the asset e.g. BTC), where it will start looking for Heikin Ashi flips. Every Heikin Ashi flip before this preset price will be ignored. Preset prices could be chosen tactically at resistance levels.
Different time frames of Heikin Ashi flips can be used together. E.g. 10 min, 3 hour or 2 Day time frames. If this is possible within your Tradingview subscription.
Example
The user has a long position (bought at the green arrow.) The user wants to start trailing at price 88 USDT (blue line).
The indicator will only trigger when the following conditions are met:
Cross of red block on the indicator (representing red Heikin Ashi candle)
Price has crossed 88 USDT
If the candlestick turns from a green to a red block, before crossing 88 USDT. It will NOT trigger the alert. Visible as the orange down arrows. In the indicator below it is displayed as a red block.The alert will go off at the red down arrow on 10th Nov (if chosen for Once per bar close). The price condition of 88 USDT was already met at 7th Nov.
Final Words
Disclaimer: Please use it with care and at own risk. The owner of this indicator is not liable for any financial losses.
Past performance is no guarantee of future returns.

Trailing Stop AlertsThis script is designed as an ATR-based trailing stop tool to assist in managing open positions.
Once you're involved in a profitable trade, if you add this script to your chart you'll be prompted to select a bar to begin trailing from.
You can then adjust the candle lookback distance for swing high/lows (7 by default), the ATR multiplier (1.0 by default), and the direction to trail (Long/Short).
You can also adjust the ATR period in the settings menu if you want to (14 period by default).
Once the script is added to your chart, it will begin drawing your trailing stop and you can then set up alerts.
Alert Options:
Any alert() function call : Will trigger an alert for both conditions (trailing stop updated, trailing stop hit)
Alert Conditions : Trailing Stop Update will trigger whenever the stop is updated, Trailing Stop Hit will trigger whenever the stop is hit.
Note: the alerts will only fire once per bar close and the trailing stop will not update on realtime bars.

Trailing Stoploss Bottom ActivationThe Basics
The indicator is visible on the chart as circles above and below the bar.
It will trigger an alert when the current price goes below, the low of the previous candle.
Or an alert when current price goes above, the high of the previous candle.
The indicator can be used as a trailing stoploss for (DCA/ TV) bots.
The distance between the circles and candlesticks can be adjusted. If the user prefers to set an alert e.g. a few ticks lower than the candle bottom.
What Makes It Different
The user can preset the price (of the asset e.g. BTC), where it will start looking for the condition: current price is below previous candle low (when in long position). Current price is above previous candle high (when short).
Example
In the chart above MATIC/BUSD the user has drawn a blue line at 1.70. Since there is where he expects resistance.
The user has a long position (bought at the green arrow.) The user wants to start trailing at price 1.70.
The alert will only trigger when the following conditions are met:
Condition 1 - Crossed 1.70
Condition 2 - Current candle price is below previous candle low.
In the chart above price crossed above 1.70 on 26th Oct. Current candle price (at that moment) went below previous candle low on 27th Oct, indicated with a red arrow. Here the alert will go off at 1.659 BUSD (indicated in pink).
It ignores the other two lows, indicated with orange arrows. Because condition 1 is not met.
It is possible to use multiple time frames at the same time. Some time frames might not be available depending on your Tradingview subscription.
Final Words
Disclaimer: Please use it with care and at own risk. The owner of this indicator is not liable for any financial losses.
Past performance is no guarantee of future returns.

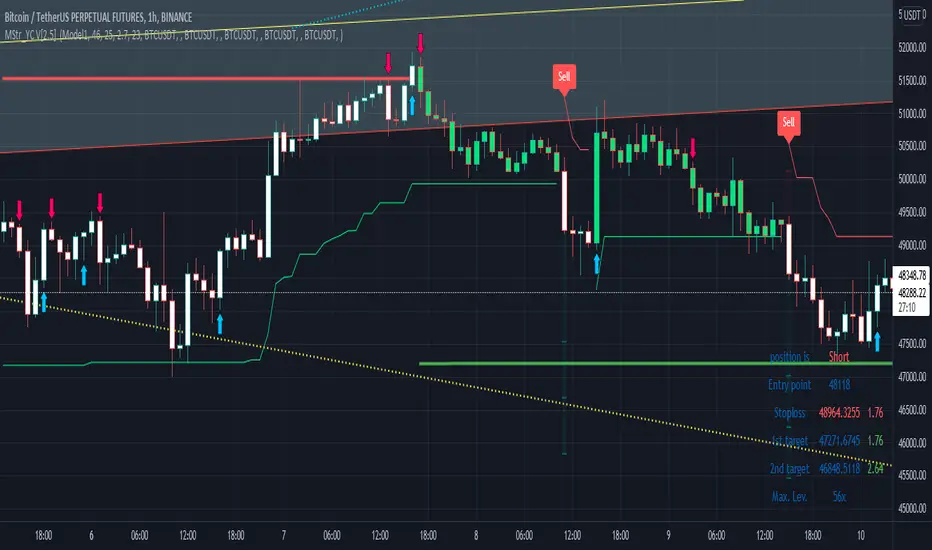
Buy and Sell with Master_in_chart-ind. [V1]This script indicates the Buy and Sell positions on your chart. In addition, it shows entry price , stop loss and possible targets on the chart. The same information are shown in a table where you can find the position type (long/short) in green and red color, entry point, stop-loss (always in red) and targets.
The targets are defined by Risk to Reward ratios 1:1, 1:1.5 and 1:2.
the labels appears when the all conditions are satisfied.
Interesting part of the script is the alert function. Here one can set the script for different
securities and activate alert in TV.
In summary, one can change and tune the setting of the indicator easily by clicking on the gear icon. In the setting, there are four sections. First section sets the slop-loss. Second section activates and shows the super trend indicator. Third section is designed to tune the signals. Finally, you can apply the script on five different symbols at different time-frames. Here you can set alarm to alert you the signals.
I hope you enjoy it!
Trailing StopMost of the trailing stops on TradingView are made of using the lowest lows and the highest highs. Not many are based around what I called the volatile trailing stop.
This is where the trailing stop will move around according to a set percentage difference from the previous closing value. This allows you to say "If the current bar moves x percent, then stop". The script I've made here is a simple version of that with a few options for smoothing and setting the percent change.
Disclaimer: This is not financial advice, please do your own research before making any decisions.

GEMA-Indicador por Neil-------------------
DESCRIPTION
GEMA-INDICATOR is a indicator based on SMA, EMA, WMA, RMA that considers elements such as ADX, DMI, RSI, stochastic, Stoploss, Takeprofit, angles and values at present point.
HOW DOES IT WORK
The component works as an assistant to which you configure the previous elements and you see the performance that it offers you, in such a way that you pass that configuration to GEMA-INDICATOR so that you can receive alerts and do visual trading with notifications or automated trading by sending messages to platforms like 3Commas.
WHY USE IT
The resource operates with one of the most important strategies in the market, which is the price tracking line, which means that if prices go up, we follow it, if prices go down, we follow it; in this way you do not need to make large investments as is often the case with pure BOTs, which require large reserves for security orders.
HOW TO USE IT
Press the "Indicators" option, go to the "Public Library" segment, write the name "GEMA-Indicador por Neil", double click on the record in question and you will have it added in your work panel, now, it only remains to use it and configure its parameters.
-------------------
DESCRIPCIÓN
GEMA-INDICADOR en un indicador basado en SMA, EMA, WMA, RMA que considera elementos como ADX, DMI, RSI, Estocastico, Stoploss, Takeprofit, ángulos y valores a punto presente.
COMO FUNCIONA
El componente funciona como un asistente al que vas configurando lo elementos anteriores y vas viendo el rendimiento que te ofrece, de manera tal, que pases esa configuración a GEMA-INDICADOR para que puedas recibir alertas y hagas trading visual con notificaciones o trading automatizado enviando mensajes a plataformas como 3Commas.
POR QUÉ USARLO
El recurso opera con una de las estrategias mas importantes del mercado, que es la linea de seguimiento de precio, lo que significa que si los precios suben, lo seguimos, si los precios bajan, lo seguimos; de esta manera no necesita realizar grandes inversiones como suele ocurrir con los BOT puros, que exigen grandes reservas para las ordenes de seguridad.
COMO USARLO
Presione la opción "Indicadores", ubíquese en el segmento "Libreria Publica", escriba el nombre "GEMA-Indicador por Neil", haga doble clic sobre el registro en cuestión y lo tendrá agregado en su panel de trabajo, ahora, solo resta usarlo y configurar sus paramertos.

GEMA-Estrategia por neil-------------------
DESCRIPTION
GEMA-STRATEGY is a strategy generator based on SMA, EMA, WMA, RMA that considers elements such as ADX, DMI, RSI, stochastic, Stoploss, Takeprofit, angles and values at present point.
HOW DOES IT WORK
The component works as an assistant to which you configure the previous elements and you see the performance that it offers you, in such a way that you pass that configuration to GEMA-INDICATOR so that you can receive alerts and do visual trading with notifications or automated trading by sending messages to platforms like 3Commas.
WHY USE IT
The resource operates with one of the most important strategies in the market, which is the price tracking line, which means that if prices go up, we follow it, if prices go down, we follow it; in this way you do not need to make large investments as is often the case with pure BOTs, which require large reserves for security orders.
HOW TO USE IT
Press the "Indicators" option, go to the "Public Library" segment, write the name "GEMA-Estategia por Neil", double click on the record in question and you will have it added in your work panel, now, it only remains to use it and configure its parameters.
-------------------
DESCRIPCIÓN
GEMA-ESTRATEGIA en un generador de estrategias basado en SMA, EMA, WMA, RMA que considera elementos como ADX, DMI, RSI, Estocastico, Stoploss, Takeprofit, ángulos y valores a punto presente.
COMO FUNCIONA
El componente funciona como un asistente al que vas configurando lo elementos anteriores y vas viendo el rendimiento que te ofrece, de manera tal, que pases esa configuración a GEMA-INDICADOR para que puedas recibir alertas y hagas trading visual con notificaciones o trading automatizado enviando mensajes a plataformas como 3Commas.
POR QUÉ USARLO
El recurso opera con una de las estrategias mas importantes del mercado, que es la linea de seguimiento de precio, lo que significa que si los precios suben, lo seguimos, si los precios bajan, lo seguimos; de esta manera no necesita realizar grandes inversiones como suele ocurrir con los BOT puros, que exigen grandes reservas para las ordenes de seguridad.
COMO USARLO
Presione la opción "Indicadores", ubíquese en el segmento "Libreria Publica", escriba el nombre "GEMA-Estrategia por Neil", haga doble clic sobre el registro en cuestión y lo tendrá agregado en su panel de trabajo, ahora, solo resta usarlo y configurar sus paramertos.
