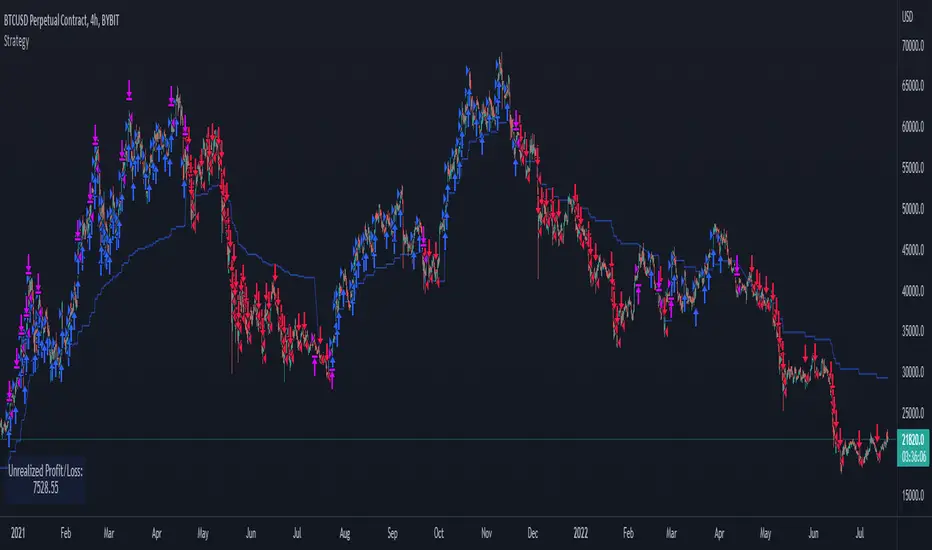
Strategy - Profit Maximizer by PMaxIt is a small modification to the "Profit Maximizer Max" script to make it a strategy by date range.
Strategy

Momentum Strategy (BTC/USDT; 30m) - STOCH RSI (with source code)Here's a strategy for low time frames (30min suggested) for BTC , based on momentum Analysis using Stochastic RSI
By default the strategy will use the 50% of the specified capital for each trade; if "Gamble Sizing" is enabled, it will add the specified amount of capital (25% by default, until reaching the 100% limit or lower) for the next trade after having detected a loss in the previous trade; if the next trade is successful, the size for the next trade comes back to 50%
• Trend Filter LONG: If the fast exponential moving average is UNDER the slow exponential moving average , it won't open LONG positions
• Trend Filter SHORT: If the fast exponential moving average is ABOVE the slow exponential moving average , it won't open SHORT positions
• Bars delay: the strategy will wait the specified amount of bars before closing the current position; the counter is triggered as soon as the closing trade condition is verified
BY MAKING USE OF THIS STRATEGY, YOU ACKNOWLEDGE AND AGREE THAT: (1) YOU ARE AWARE OF THE RISKS ASSOCIATED WITH TRANSACTIONS OF DIGITAL CURRENCIES AND THEIR DERIVATIVES; (2) YOU SHALL ASSUME ALL RISKS RELATED TO THE USE OF THIS STRATEGY AND TRANSACTIONS OF DIGITAL CURRENCIES AND THEIR DERIVATIVES; AND (3) I SHALL NOT BE LIABLE FOR ANY SUCH RISKS OR ADVERSE OUTCOMES.
SOURCE CODE BELOW

Strategy Template[Benson]A strategy template with following user inputs:
1. backtest start date
2. tp% and stop loss%
3. trail stop price and trail stop offset
The long and short condition is ma crossover and corssunder by default.
You can change the logic with your own.

MrBS:Directional Movement Index [Trend Friend Strategy]This goes with my MrBS:DMI+ indicator. I originally combined them into one, but then you cannot set alerts based on what the ADX and DMI is doing, only strategy alerts, so separate ones have more flexibility and uses.
Indicator Version is found under "MrBS:Directional Movement Index " ()
//// THE IDEA
The majority of profits made in the market come from trending markets. Of course there are strategies that would say otherwise but for the majority of people, THE TREND IS YOUR FRIEND (until the end). The idea is to follow the trend, entering once it has established its self and exiting positions when the trend weakens. This strategy gives a rough idea of the returns produced from following purely the ADX signals. At first Heikin Ashi values were used for the calculation but the results show it's not that effective. The functionality to switch between calculation types has been left in, so we can uses HA candle data to generate signals from while looking at an OHLC chart, if we want to experiment. Due to the way strategies work, we are unable to get reliable results when running the strategy on the HA chart even if we are calculating the signals from the real OHLC values. It is best to always run strategies on standard charts.
When using this strategy, I look for confirmation of the signal based on stochastic (14:3:6) direction, reversal level of stochastic, and divergance, to add confidence and adjust position size accordingly. I am going to try and code some version of that in future updates, if anyone can help or has suggestions please drop me a message.
//// INDICATOR DETAILS
- The default settings are for optimized Daily charts, for 4 hour I would suggest a smoothing of 2.
- The default values used for calculation are the Real OHLC, we can change this to Heikin Ashi in the menu.
- The strategy enters a position when ADX crosses the threshold level, and closes the position when ADX starts to fall.
- There is a signal filter in the form of a 377 period Hull Moving Average, which the price must be above or bellow for long and short positions respectively.
- The strategy closes the position when a cross-under of the ADX and its 4 period EMA. This is an attempt to stay into positions longer as sometimes the ADX will fall for 1 bar and then keep rising, while the overall trend is strong. The downside to this is that we exit trades later and this affects our max drawdown.

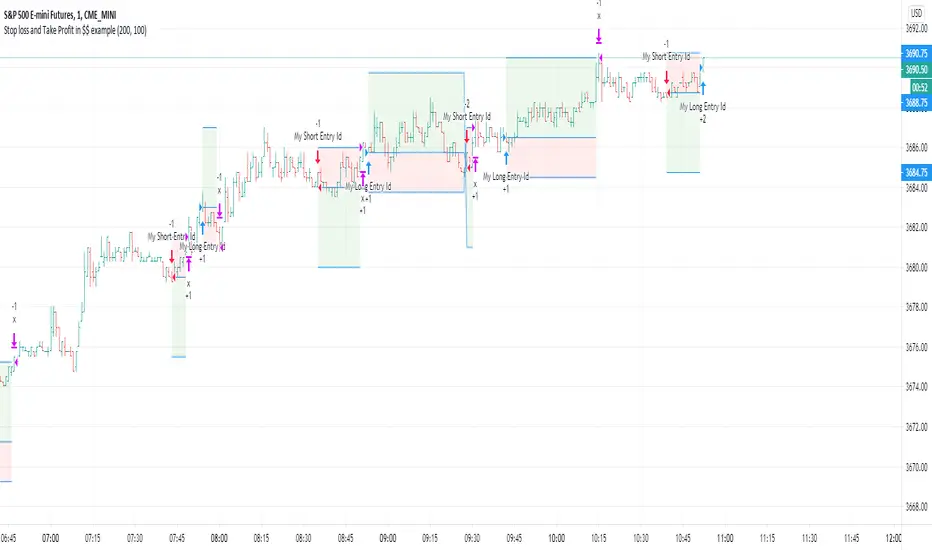
Stop loss and Take Profit in $$ exampleThis is a simple exit example in $$ (symbol's currency) for educational purpose .
BB+K strategyApplying Bollinger Bands and K-bar strategies
Suitable for long time periods
Suitable for forex trading, when the forex deviation is too large, the Fed will intervene and thus correct
Strategy: Enter when the price hits the upper or lower BB track and there is a reversal of the strong signal, and exit when it hits the other track and there is a reversal signal.

Escaping of Rate from Avarage By Mustafa OZVER StrategyI simulated the EoRfA indicator with the gold price
For details about the indicator, visit my profile on tradingview
For Simulation, with default settings, we order
if Eorfa > 1 and change(eorfa) < 0
sell
if Eorfa < -1 and change(eorfa) > 0
buy
And we got
- 2.49 % profit
- 74 % profittable order from all
But only this value can not guarantee good results for trading. BE CAREFUL

Vegas Tunnel strategyApply Vegas Tunnel,
Use EMA144 169 as medium-term trend support
Also use EMA 576 676 and 4 multiples of 144 and 169 as long-term support and trend direction
Also increase EMA 36 43 as a short-term trend support
Suitable for stocks, indices, commodities
The applicable time scale can back-test the usability of the strategy by itself, and select the most applicable target
Introduction to current trading strategy:
According to the trend, the price will enter the market when it touches the support of each stage. When it touches the bollinger bands, it is Squeeze. Hold until it leaves the bollinger bands
But the trading strategy can be more optimized, see the code for details

MACD 50x Leveraged Short Strategy with Real Equity
Hello there ,
Short version of the Macd Long strategy.
MACD Long strategy:
Adding margin: Forbidden or not specified. (Add Margin : No)
Position size: (for each trade) 1%
Stop-Loss: (2% Above Entry Level)
Long: macd crossunder
Exit: macd crossover
Or ofc touching the stop-Loss value as predicted.
These strategies are just examples.
The goal is to observe true equity and equity change.
Warning: This strategy simulation is for Short direction only.
Regards.

MACD Strategy with trailing ATR stopThis is a trend based strategy that uses EMA and SMA intersection for determining the direction of the trend and MACD for the entry signal. At the same time, the strategy uses ATR, which is working as a trailing stop.
The strategy entry will work when the Trend ribbon will turn green and MACD line will crossover the signal line. This strategy also takes into account the pyramiding and allows to enter the second time if the signal will repeat itself.
There are 3 exit points. The first 10% of the position will be closed when the price will increase by 1%. The second portion of 50% will be closed when the price reaches 5% Take profit target. The remaining 40 % of the position will wait for the exit signal which will occur when the price closes below the ATR line.
The strategy is using a fixed amount in dollars, each time the entry occurs the strategy will enter with 100$ in the order.
The strategy can be applied to other crypto assets. However, they will require input changes.
Best of luck with your trading.

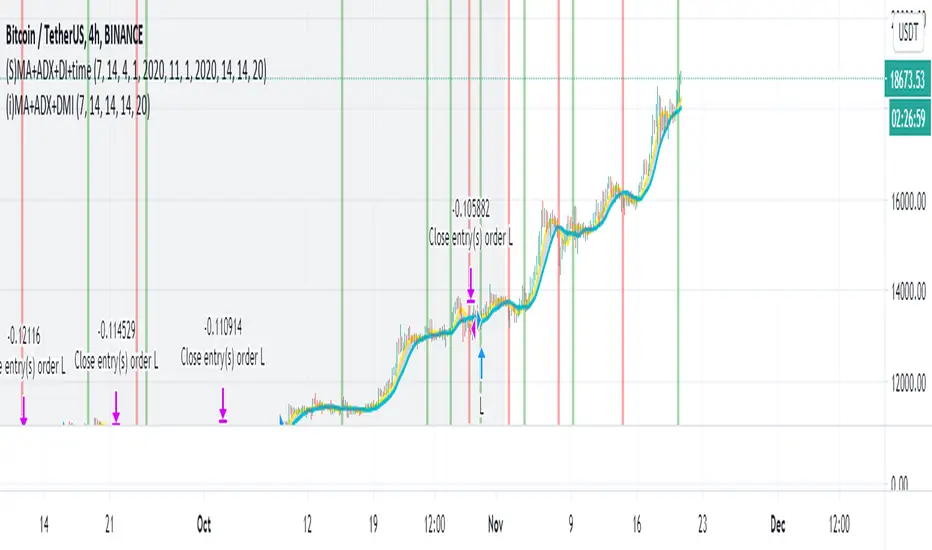
Simple Moving Average + ADX + DMI + Time Range Test
Use long and short moving average to look for a potential price in/out. (default as 14 and 7, bases on the history experience)
ADX and DMI to prevent the small volatility and tangling MA.
This script allows you to set the beginning & end time to test the bullish & bearish market.
If you want an indicator version, here is it.
Thanks.
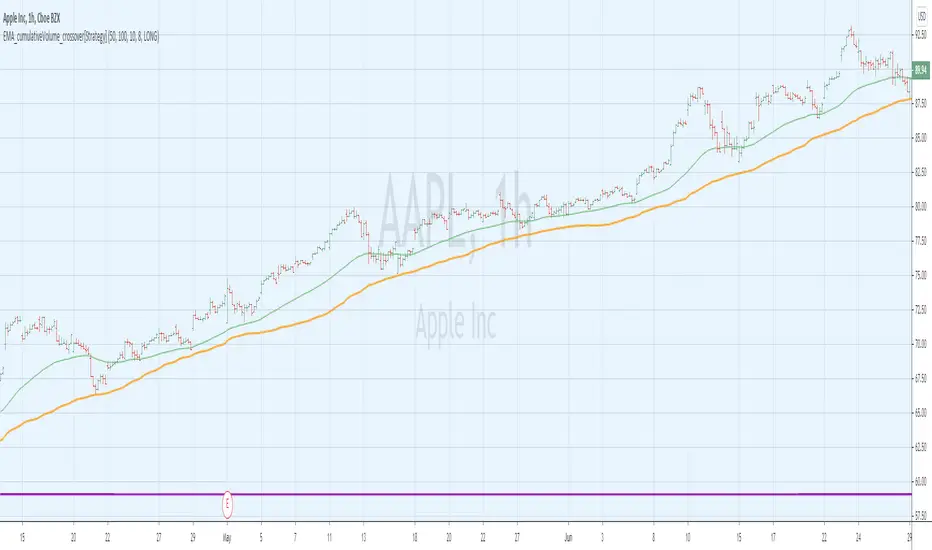
EMA_cumulativeVolume_crossover[Strategy]This strategy is back test for EMA_cumulativeVolume_crossover
BUY
When ema50 crossover cumulative volume of 100 period
Exit
When ema50 cross down cumulative volume of 100 period
Partial Exit
for the partial profit I have used stopLoss value , but up side. When price is above partial profit and crossing down EMA 50 , exit 1/3 position
Please note when you select this setting, you see spike number of trades, that is because you closing partial number of trades. which increases the winning rate but reduces the total net profit.
Stop Loss
Defaulted to 8%
Added parameter to take LONG or SHORT trades ... on SHORT side not very good results ... you can review it and provide feedback how to improve the performance.
Short Selling
Reverse above BUY conditions
I have tested LONG trades on SPY , QQQ and AAPL on 1 Hour and 30 mins timeframes. for AAPL on DAY timeframe it shows crazy results :-)
Note
For the use of educational purposes only.
Stepped trailing strategy exampleThis is a stepped trailing exit example for educational purpose .
Short brief.
There are 1 stop loss and 3 profit levels.
When first tp is reached we move stop loss to break-even.
When second tp is reached we move stop loss to first tp.
When third tp is reached we exit by profit.

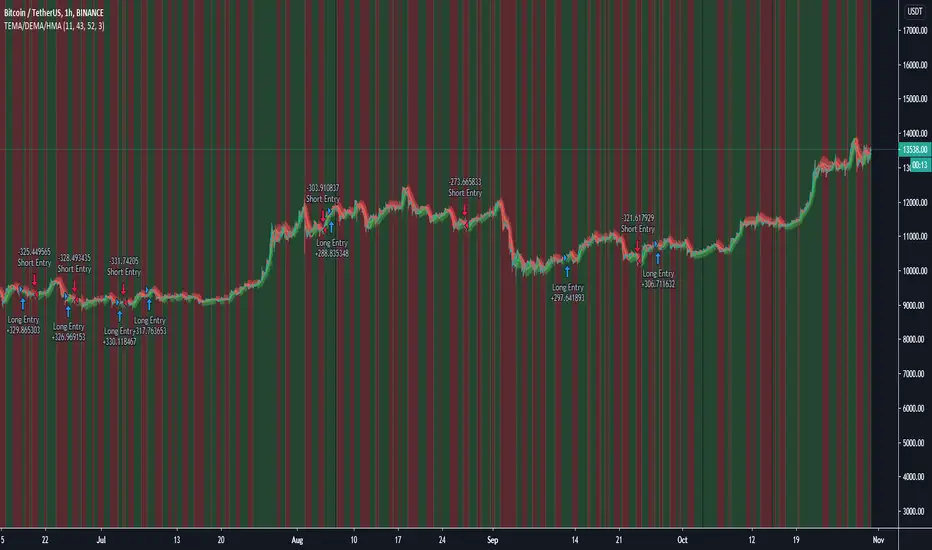
TEMA/DEMA/HMA StrategyThe TEMA/DEMA/HMA strategy is a basic trend follower looking for when the TEMA crosses above the DEMA as a buy signal and the opposite for the sell.
The HMA is used as a longer more Dynamic MA to confirm the wider trend to filter out bad trades.
This is a basic idea that can be expanded on using different indicator types to either add signals or filter out more bad signals!
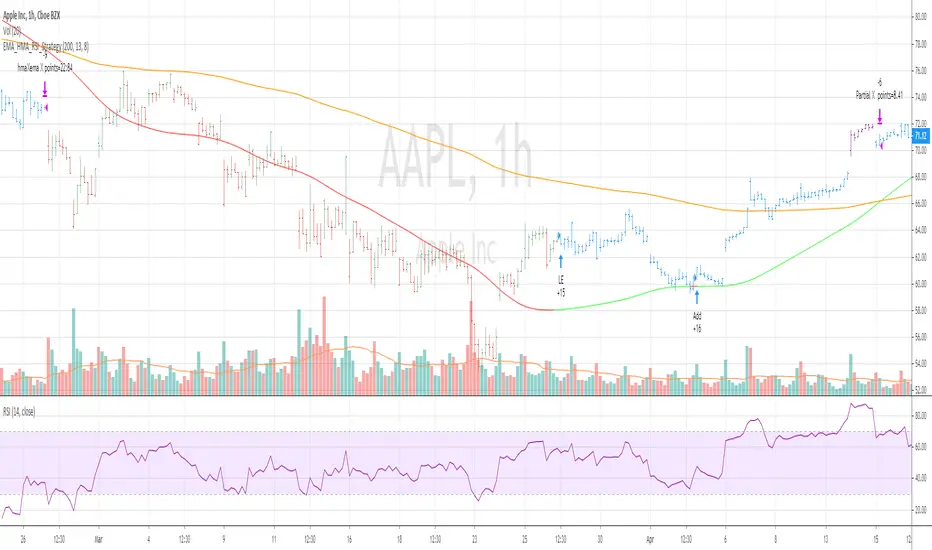
EMA_HMA_RSI_StrategyThis strategy BUYS when HMA is below EMA (default setting is 200) and HMA turning to green and RSI 13 is below 70
Adds to existing position when current price is below BUY price and RSI crossing above 30 or 40
Exits the long position when HMA crosses down EMA
when you select Take Profit setting , partial profits are taken when current price > BUY price and RSI 13 crossing down 80
Bar color changes to purple when RSI13 is above 80 (if only in Long position exists)
Tested for SPY QQQ AAPL on hourly and 30 mins chart
Warning : For educational purposes only
VWAP + Fibo Dev Extensions StrategyBased on my VWAP + Fibo deviations indicator, I tested some strategies to see if the indicator can be profitable; and I got it !
This strategy uses:
H1 timeframe
Weekly VWAP
+1.618 / +2.618 / -1.618 / -2.618 Deviations Extensions to create 2 bands
The value of the deviation
First, the 2 bands are plotted : +1.618/+2.618 painted in red and -1.618/-2.618 painted in lime.
Then, we wait for the deviation value to reach at least 150 (see thumbnail) to avoid littles moves when the gaps between bands are too short.
Entry long position :
first candle must crossunder the -1.618 level and low have to stay over the -2.618
low of the second one must stay in the lime band
enter the third one if the deviation value is over limit (150)
Exit long position :
TP : when a high crossover VWAP
SL : when a low crossunder -2.618
Entry short position :
first candle must crossover the +1.618 level and high have to stay under the +2.618
high of the second one must stay in the red band
enter the third one if the deviation value is over limit (150)
Exit short position :
TP : when a low crossunder VWAP
SL : when a high crossover +2.618
Notes :
this strategy uses pyramiding (5), be careful and calculate your risk management
the comission value is set to 0.08% to include slippages when entering a trade because of market orders
This strategy is not an advice to invest, make your own decisions.

Inferential Statistics And Quick Metrics For Strategy Analysis.Part of this script is used to calculate inferential statistics and metrics not available through the built in variables in the strategy tester.
A label will be created on the last bar displaying important strategy results, so you can test and analyze strategies quicker.
The built in strategy itself is just an example. You can copy and paste the metrics into any existing version 4 strategy and instantly use it**
**Just be sure all the variable names are unique in your target script.
I am looking for critique and would appreciate input on the statistical functions. I am aware that some of these functions are based on the assumption that the data is normally distributed. It's not meant to be perfect, but it is meant to be helpful. So if you think I can add or improve something to make it more helpful, let me know.
Cycles StrategyThis is back-testable strategy is a modified version of the Stochastic strategy. It is meant to accompany the modified Stochastic indicator: "Cycles".
Modifications to the Stochastic strategy include;
1. Programmable settings for the Stochastic Periods (%K, %D and Smooth %K).
2. Programmable settings for the MACD Periods (Fast, Slow, Smoothing)
3. Programmable thresholds for %K, to qualify a potential entry strategy.
4. Programmable thresholds for %D, to qualify a potential exit strategy.
5. Buttons to choose which components to use in the trading algorithm.
6. Choose the month and year to back test.
The trading algorithm:
1. When %K exceeds the upper/lower threshold and then hooks down/up, in the direction of the Moving Average (MA). This is the minimum entry qualification.
2. When %D exceeds the lower/upper threshold and angled in the direction of the trade, is the exit qualification.
3. Additional entry filters include the direction of MACD, Signal and %D. Also, the "cliff", being a long entry is a higher high or a short entry is a lower low.
4. Strategy can only go "Long" or "Short" depending on the selected setting.
5. By matching the settings in the "Cycles" indicator, you can (almost) see what the strategy is doing.
6. Be sure to select the "Recalculate" buttons, to recalculate on every new Tick, for best results.
Please click the Like button and leave a comment if you appreciate this script. Improvements will be implemented as time goes on.
I am not a licensed trade advisor. This strategy is for entertainment only. Use at your own risk!

RSI on VWAP Upgraded strategyFirst of all, the idea of apply RSI to VWAP was inspired by XaviZ; at least, that where I first saw that.
I simply applied the idea and searched for apply this on lower timeframe (M15) to increase the number of positions and improve the profit factor.
The conditions to enter are the same :
long : enter on RSI crossover oversold level
short : enter on RSI crossunder oversell level
To close position, I found a little change to apply :
long : close position when RSI(VWAP) went in overbought zone and crossunder the overbought level OR after being at least x bars in the overbought zone (parameter is 28 by default) => when the first condition happens
short : close position when RSI(VWAP) went in oversold zone and crossover the oversold level OR after being at least x bars in the oversell zone (parameter is 28 by default) => when the first condition happens
With this change, I got better results specially on BTCUSDTPERP (M15) where I reach a 6.8 profit factor with 119 trades closed. Not BAD !
The defaults parameters are the best found for BTCUSDTPERP (M15), but the strategy works fine for other pairs if you take time to find the rights combinations.
In this strategy you can change (with defaults in () ):
RSI length (28)
RSI overbought level (85)
RSI oversell level (30)
Number of bars before leaving as explain above (28)
The choice to take longs only, shorts only or both
The number of coin/token by position
The start date for backtesting
Please note that the script use a pyramiding parameter of 3 (can be changed in the first line of the script); that means that you can take up to 3 positions before closing. It lets you improve average enter price but increase the risk. 3 is the best I found to improve profit factor without expose myself too much.
This script would be better if automated because of the conditions of buy and sell.
It's only for educative purpose, not an advice to invest.
All my free scripts here : fr.tradingview.com
Leave a message and don't forget to follow me ;) !

Lagged Donchian Channel + EMAThis strategy is based on a lagged 24 periods Donchian Channel and a 200 periods EMA .
The enter positions are calculated this way :
Bull entry
1. we wait for the close of a candle below the channel and it must be below the 200 EMA
2. the following candle must be a green one and close in the lagged channel
3. we put a long order at the close of the second candle, a stop loss at the low of last 3 candles and a x3 take profit
Bear entry
1. we wait for the close of a candle above the channel and it must be above the 200 EMA
2. the following candle must be a red one and close in the lagged channel
3. we put a short order at the close of the second candle, a stop loss at the high of last 3 candles and a x3 take profit
For both long or short positions :
If the order is not filled, it's cancelled if the price reach 50% of the TP or if the price reach the stop loss level
The position is closed if a new bear/bull condition appears in the other side of the position (if a bear appears when you're long and inversement)
Features :
Position calculator's included with leverage option
Labels of position can be plotted or not
Bull/Bear channels can be plotted with red and green filled
All parameters can be changed for backtesting
Better results have been got with defaults parameters on LTCUSDTPERP in H1 timeframe => profit factor of 2.84 with almost 100 positions.
Hope this strategy will be useful and it would be cool if I could get feedback, comments or better combinations of parameters !!
Don't hesitate to like and leave a comment ;)
@Mysteriown

Super Guppy StrategyCM Super Guppy with Long/Short signals, backtesting, and additional options. Updated for PineScript v4.
COINBASE:BTCUSD
Features 2 primary modes, depending on your risk profile. These options are available in the settings:
"Early Signals" ON (default):
Prints a "long" on grey to green transitions AND red to gray transitions.
Prints a "short" on green to grey transitions AND gray to red transitions.
Will not print back-to-back repeated positions (i.e. green → grey → red will only print the first green → gray "short" signal and not print "short" twice).
Rotates long and short positions with no delay.
"Early Signals" OFF
Will close trades, but never open new ones, when guppy transitions to from any color to gray.
Open long: guppy transitions gray to green.
Close long: guppy transitions green to gray.
Open short: guppy transitions gray to red.
Close short: guppy transitions red to gray.
Does not rotate long and short positions back to back.
Additionally:
Can toggle on/off the 200EMA. Default is off.
Can toggle on/off short positions. Default is on.
In development: alerts

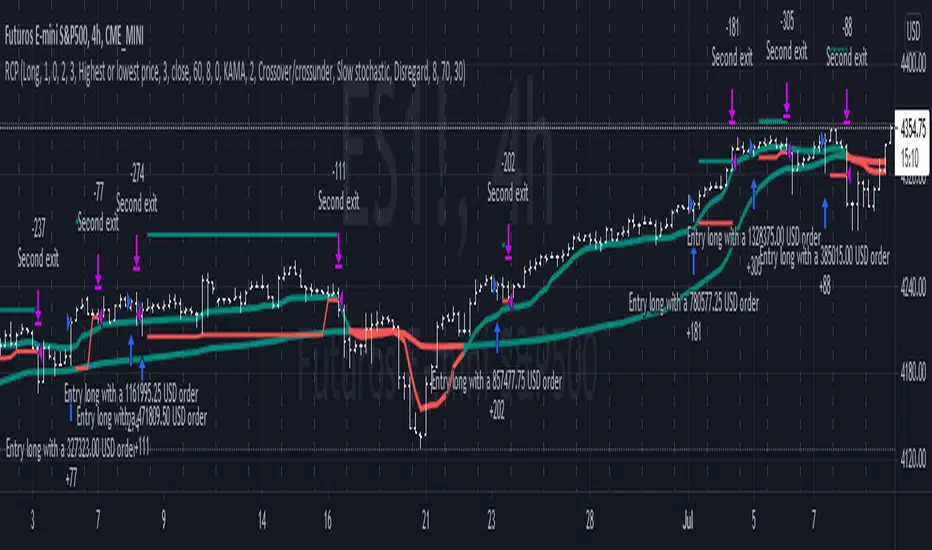
Reversal closing priceThe reversal closing price (RCP) is a candlestick pattern which follows two simples rules:
the low price of current candle needs to be lower than the low price of the last 2 candles
the closing price of current candle needes to be higher than the closing price of the last candle
This generates a signal for a long position. For a short position, the conditions are inverted:
the high price of current candle needs to be higher than the high price of the last 2 candles
the closing price of current candle needes to be lower than the closing price of the last candle
Since RCP is a trend follower indicator, the strategy is programmed in such a way that long positions are only placed if the short period EMA is above the long period EMA, and short positions are only placed if the short EMA is bellow the long EMA. Both periods are configurable, and should be ajusted for each asset.
This strategy uses a fixed stop loss and take profit, and the it's ratio is configurable. The stop price is one tick lower than the lowest price of X candles prior to the order execution for long positions, while in short positions it's one tick higher than the higher price. The amount of candles to lookback (X) is configurable. Both stop and take profit prices are displayed, the first as a red line, and the second as a green line.
This is the setting that I've found to work best with TVC:SPX , but you may find a better setting. While the RCP is universal, it's placement depends on the trend and it's strenght, something that is very heterogeneous among assets.
I really wish that I was able to place images, but I don't have PRO, so text will have to do.
This strategy was designed by Alexandre Wolwacz, a.k.a. Stormer.
The Strategy - Ichimoku Kinko Hyo and moreThe purpose of this strategy is to make the signals from my scripts available for verification by backtests. Different signal and filter combinations can be created and specific manual parameter optimization can be carried out.
In detail, this strategy includes:
23 entry signals
two entry filters with each 9 filters
two exit filters with each 9 filters
take profit and stop loss
time period for backtesting