AI Trading Alerts v6 — SL/TP + Confidence + Panel (Fixed)Overview
This Pine Script is designed to identify high-probability trading opportunities in Forex, commodities, and crypto markets. It combines EMA trend filters, RSI, and Stochastic RSI, with automatic stop-loss (SL) & take-profit (TP) suggestions, and provides a confidence panel to quickly assess the trade setup strength.
It also includes TradingView alert conditions so you can set up notifications for Long/Short setups and EMA crosses.
⚙️ Features
EMA Trend Filter
Uses EMA 50, 100, 200 for trend confirmation.
Bull trend = EMA50 > EMA100 > EMA200
Bear trend = EMA50 < EMA100 < EMA200
RSI Filter
Bullish trades require RSI > 50
Bearish trades require RSI < 50
Stochastic RSI Filter
Prevents entries during overbought/oversold extremes.
Bullish entry only if %K and %D < 80
Bearish entry only if %K and %D > 20
EMA Proximity Check
Price must be near EMA50 (within ATR × adjustable multiplier).
Signals
Continuation Signals:
Long if all bullish conditions align.
Short if all bearish conditions align.
Cross Events:
Long Cross when price crosses above EMA50 in bull trend.
Short Cross when price crosses below EMA50 in bear trend.
Automatic SL/TP Suggestions
SL size adjusts depending on asset:
Gold/Silver (XAU/XAG): 5 pts
Bitcoin/Ethereum: 100 pts
FX pairs (default): 20 pts
TP = SL × Risk:Reward ratio (default 1:2).
Confidence Score (0–4)
Based on conditions met (trend, RSI, Stoch, EMA proximity).
Labels:
Strongest (4/4)
Strong (3/4)
Medium (2/4)
Low (1/4)
Visual Panel on Chart
Shows ✅/❌ for each condition (trend, RSI, Stoch, EMA proximity, signal now).
Confidence row with color-coded strength.
Alerts
Long Setup
Short Setup
Long Cross
Short Cross
🖥️ How to Use
1. Add the Script
Open TradingView → Pine Editor.
Paste the full script.
Click Add to chart.
Save as "AI Trading Alerts v6 — SL/TP + Confidence + Panel".
2. Configure Inputs
EMA Lengths: Default 50/100/200 (works well for swing trading).
RSI Length: 14 (standard).
Stochastic Length/K/D: Default 14/3/3.
Risk:Reward Ratio: Default 2.0 (can change to 1.5, 3.0, etc.).
EMA Proximity Threshold: Default 0.20 × ATR (adjust to be stricter/looser).
3. Read the Panel
Top-right of chart, you’ll see ✅ or ❌ for:
Trend → Are EMAs aligned?
RSI → Above 50 (bull) or below 50 (bear)?
Stoch OK → Not extreme?
Near EMA50 → Close enough to EMA50?
Above/Below OK → Price position vs. EMA50 matches trend?
Signal Now → Entry triggered?
Confidence row:
🟢 Green = Strongest
🟩 Light green = Strong
🟧 Orange = Medium
🟨 Yellow = Low
⬜ Gray = None
4. Alerts Setup
Go to TradingView Alerts (⏰ icon).
Choose the script under “Condition”.
Select alert type:
Long Setup
Short Setup
Long Cross
Short Cross
Set notification method (popup, sound, email, mobile).
Click Create.
Now TradingView will notify you automatically when signals appear.
5. Example Workflow
Wait for Confidence = Strong/Strongest.
Check if market session supports volatility (e.g., XAU in London/NY).
Review SL/TP suggestions:
Long → Entry: current price, SL: close - risk_pts, TP: close + risk_pts × RR.
Short → Entry: current price, SL: close + risk_pts, TP: close - risk_pts × RR.
Adjust based on your own price action analysis.
📊 Best Practices
Use on H1 + D1 combo → align higher timeframe bias with intraday entries.
Risk only 1–2% of account per trade (position sizing required).
Filter with market sessions (Asia, Europe, US).
Strongest signals work best with trending pairs (e.g., XAUUSD, USDJPY, BTCUSD).
Swingsignals

Parsifal.Swing.CompositeThe Parsifal.Swing.Composite indicator is a module within the Parsifal Swing Suite, which includes a set of swing indicators such as:
• Parsifal Swing TrendScore
• Parsifal Swing Composite
• Parsifal Swing RSI
• Parsifal Swing Flow
Each module serves as an indicator facilitating judgment of the current swing state in the underlying market.
________________________________________
Background
Market movements typically follow a time-varying trend channel within which prices oscillate. These oscillations—or swings—within the trend are inherently tradable.
They can be approached:
• One-sidedly, aligning with the trend (generally safer), or
• Two-sidedly, aiming to profit from mean reversions as well.
Note: Mean reversions in strong trends often manifest as sideways consolidations, making one-sided trades more stable.
________________________________________
The Parsifal Swing Suite
The modules aim to provide additional insights into the swing state within a trend and offer various trigger points to assist with entry decisions.
All modules in the suite act as weak oscillators, meaning they fluctuate within a range but are not bounded like true oscillators (e.g., RSI, which is constrained between 0% and 100%).
________________________________________
The Parsifal.Swing.Composite – Specifics
This module consolidates multiple insights into price swing behavior, synthesizing them into an indicator reflecting the current swing state.
It employs layered bagging and smoothing operations based on standard price inputs (OHLC) and classical technical indicators. The module integrates several slightly different sub-modules.
Process overview:
1. Per candle/bin, sub-modules collect directional signals (up/down), with each signal casting a vote.
2. These votes are aggregated via majority counting (bagging) into a single bin vote.
3. Bin votes are then smoothed, typically with short-term EMAs, to create a sub-module vote.
4. These sub-module votes are aggregated and smoothed again to generate the final module vote.
The final vote is a score indicating the module’s assessment of the current swing state. While it fluctuates in a range, it's not a true oscillator, as most inputs are normalized via Z-scores (value divided by standard deviation over a period).
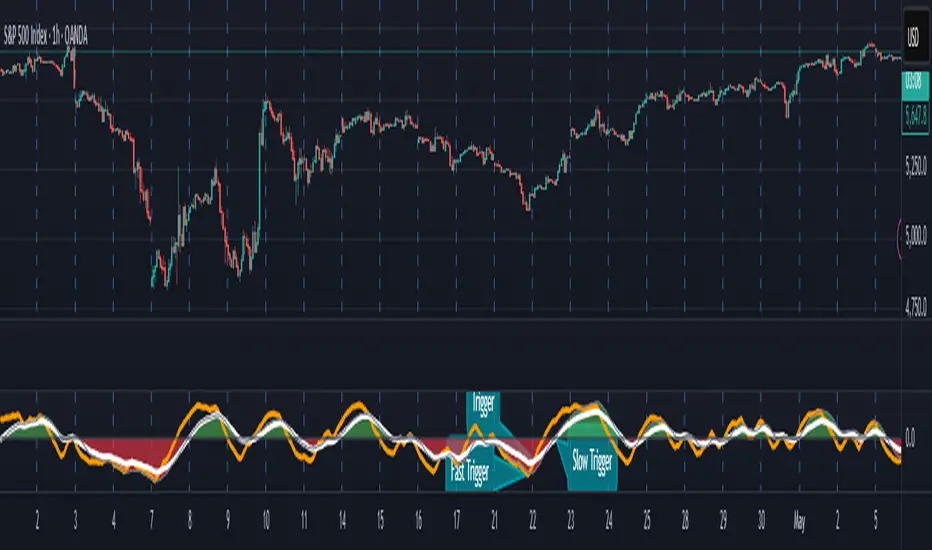
• Historically high or low values correspond to high or low quantiles, suggesting potential overbought or oversold conditions.
• The chart displays a fast (orange) and slow (white) curve against a solid background state.
• Extreme values followed by curve reversals may signal upcoming mean-reversions.
Background Value:
• Value > 0: shaded green → bullish mode
• Value < 0: shaded red → bearish mode
• The absolute value indicates confidence in the mode.
________________________________________
How to Use the Parsifal.Swing.Composite
Several change points in the indicator serve as potential entry triggers:
• Fast Trigger: change in slope of the fast curve
• Trigger: fast line crossing the slow line or change in the slow curve’s slope
• Slow Trigger: change in sign of the background value
These are illustrated in the introductory chart.
Additionally, market highs and lows aligned with swing values may act as pivot points, support, or resistance levels for evolving price processes.
________________________________________
As always, supplement this indicator with other tools and market information. While it provides valuable insights and potential entry points, it does not predict future prices. It reflects recent tendencies and should be used judiciously.
________________________________________
Extensions
All modules in the Parsifal Swing Suite are simple yet adaptable, whether used individually or in combination.
Customization options:
• Weights in EMAs for smoothing are adjustable
• Bin vote aggregation (currently via sum-of-experts) can be modified
• Alternative weighting schemes can be tested
Advanced options:
• Bagging weights may be historical, informational, or relevance-based
• Selection algorithms (e.g., ID3, C4.5, CAT) could replace the current bagging approach
• EMAs may be generalized into expectations relative to relevance-based probability
• Negative weights (akin to wavelet transforms) can be incorporated