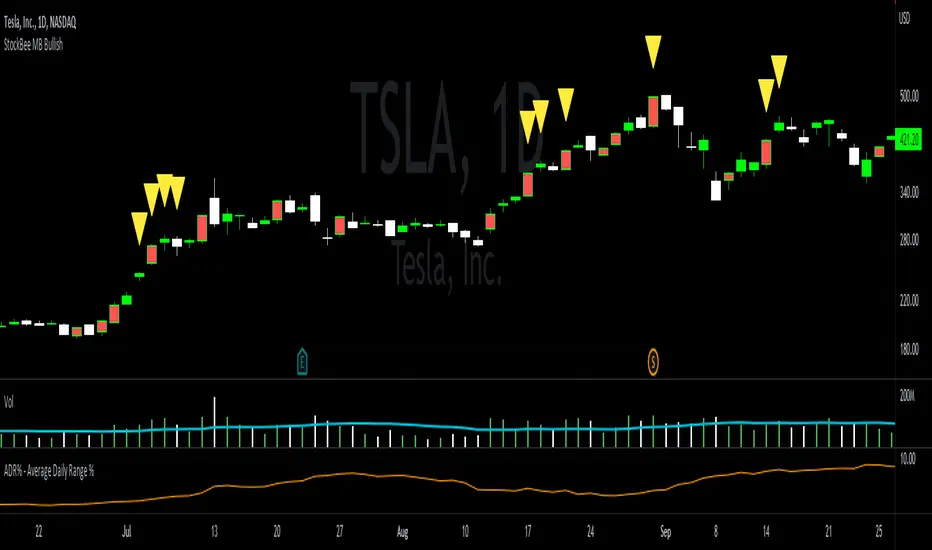
StockBee MB BullishStockBee Bullish Momentum Burst & 20% Plus Study Tool
The Stockbee bullish momentum burst study tool is helpful for practitioners of the momentum burst method who want to easily find historical momentum bursts and/or 20% plus gainers using Trading View. This script finds three specific breakouts that meet the below criteria:
4% Breakouts (Colors Candle Body)
1. Volume of the candle is greater than the previous candle volume.
2. The percent change of candle's price is greater than 4% from the previous candle close.
3. Current candle close is less than 30% from candle's high.
**Users can toggle 4% Breakouts on/off and also change candle body color in settings**
Dollar Breakouts (Colors Candle Body)
1. The change of candle's price is greater than $0.90 from the previous candle close.
2. Current candle close is less than 30% from candle's high.
** Dollar Breakout does not take volume into consideration **
**Users can toggle Dollar Breakouts on/off and also change candle body color in settings**
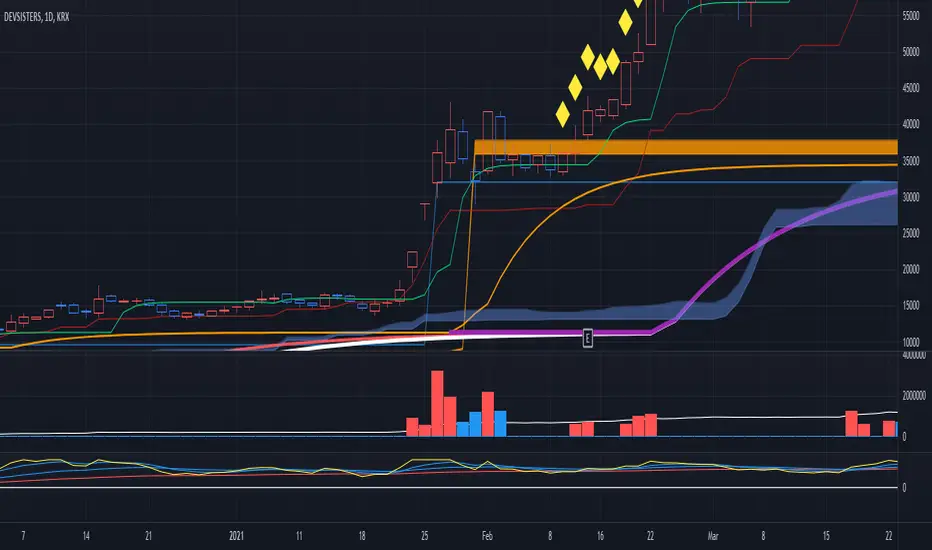
20% Plus Gainers (Displays Yellow Triangle Icon)
1. The change over five candles is greater than 20%.
**Users can toggle 20% plus label on/off, cannot change the label color**
This script also filters out any candle that gaps up and breaks down with a close above 4% the previous candle (Eliminates gap-ups that fade). This tool is meant to find and filter possible candidates. Not every marked candle is a great momentum burst trade. Users can look at 4% Breakouts, Dollar Breakouts, 20% Plus Gainers individually or any combination of the three.
This is helpful for Trading View users trading this specific setup.
مؤشر Pine Script®