Delta Volume Signals by Claudio [hapharmonic]Modifications:
Percentages without decimals.
I replaced the 'Current Volume' row with two boxes: "Δ Vol" and its value, which changes color depending on the direction of the bearish/bullish candle.
Signals can change color in the settings.
Box spacing so the table doesn't constantly change size.
To be modified:
The Net Volume sign shouldn't change to negative when the candle is red.
If anyone does this, let me know...
claudio.ventola@hotmail.com
Best regards!
Tendencia

3EMA + Boullinger + PIVOTTRES EMAS + BANDAS DE BOLLINGER + PIVOTE
INDICADOR 1: TRES EMAS (MEDIA MOVIL EXPONENCIAL)
Con este indicador puede visualizar el promedio de precios con mayor peso a los datos mas recientes.
Se calculan y dibujan tres medias móviles exponenciales: 8, 20 y 200 últimas velas.
-Rápida EMA1 = 8
-Media EMA2 = 20
-Lenta EMA 3 = 200
INDICADOR 2: BANDAS DE BOLLINGER
Con este indicador podrá ver la fuerza y la tendencia del mercado, es decir la mide la volatilidad del precio del activo.
Si el precio sobrepasa la banda superior, el activo está sobrecomprado.
Si el precio sobrepasa la banda inferior, el activo está sobrevendido.
Longitud tendencia - BASE = 20, paso = 1
Desviación Estándar - Multiplicador = 2, paso = 0.2
INDICADOR 3: PIVOTE
Este indicador etiqueta los puntos donde el precio es mínimo y máximo, en un rango de velas determinado en el parámetro "Distancia para el Pivote".
Estos 3 indicadores sirven para todo tipo de activos: FOREX, CRIPTO, CFD´s, ETC.
------------------------------------------------------------------------------------------------------------------
THREE EMAS + BOLLINGER BANDS + PIVOT
INDICATOR 1: THREE EMAS ( EXPONENTIAL MOVING AVERAGE )
With this indicator you can visualize the average of prices with greater weight to the most recent data.
Three exponential moving averages are calculated and drawn: 4, 20 and 200 last candles.
-Fast EMA1 = 8
-Average EMA2 = 20
-Slow EMA 3 = 200
INDICATOR 2: BOLLINGER BANDS
With this indicator you can see the strength and trend of the market, that is, it is measured by the volatility of the asset price.
If the price goes above the upper band, the asset is overbought.
If the price goes above the lower band, the asset is oversold.
Trend length - BASE = 20, step = 1
Standard Deviation - Multiplier = 2, step = 0.2
INDICATOR 3: PIVOT
This indicator labels the points where the price is minimum and maximum, in a range of candles determined in the parameter "Distance to Pivot".
These 3 indicators are used for all types of assets: FOREX, CRYPT, CFD's, ETC.

Bollinger and Tendencies (Bollinger e Tendências )The strategy consists of buying when the price breaks up (crossover) the bottom line of the Bollinger and selling when the price breaks down (crossunder) to your top line.
The chart still shows trends clearly, with the fill between the exponential average and the closing value of the canlestick, green at high, red at low (this part of the script is based on the code: "Pivot Daily Price Color" by Rimko).
It also places notes on the high and low candlesticks (based on the code: "Candlesticks Pattern Identified" by Repo32).
It is recommended to use it in conjunction with the "IFR and Storage" script (also available to me), and some volume script.
A estratégia consiste em comprar quando o preço rompe para cima (crossover) a linha inferior do Bollinger e vender quando o preço rompe para baixo (crossunder) a sua linha superior.
O gráfico ainda mostra as tendências de forma clara, com o preenchimento entre a média exponencial e o valor de fechamento do canlestick, verde em alta, vermelho em baixa (essa parte do script é baseada no código: "Pivot Daily Price Color" do usuário: Rimko).
Também, coloca apontamentos nos candlesticks de alta e de baixa (baseado no código: "Candlesticks Pattern Identified" do usuário Repo32).
Recomenda-se a utilização em conjunto com o script "IFR e Estocagem" (também por mim disponibilizado), e algum script de volume.

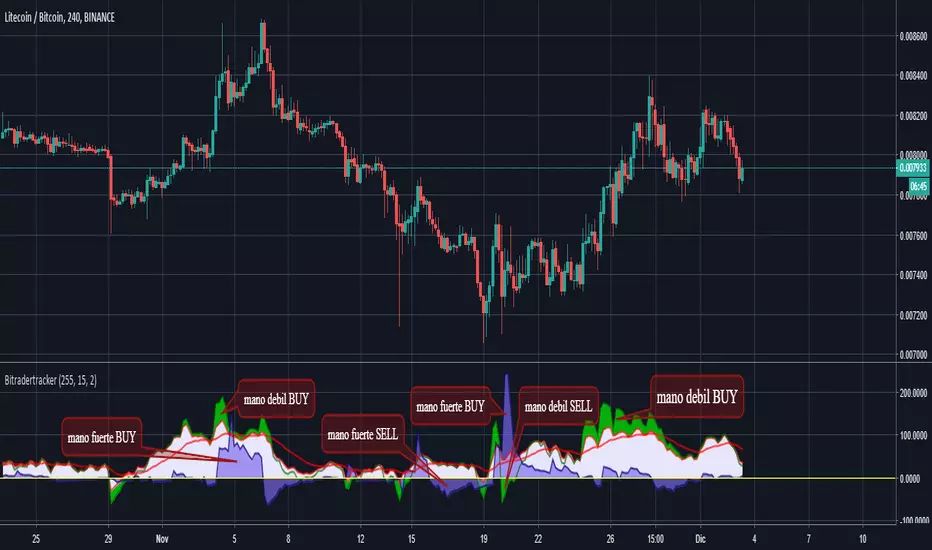
BitradertrackerEste Indicador ya no consiste en líneas móviles que se cruzan para dar señales de entrada o salida, si no que va más allá e interpreta gráficamente lo que está sucediendo con el valor.
Es un algoritmo potente, que incluye 4 indicadores de tendencia y 2 indicadores de volumen.
Con este indicador podemos movernos con las "manos fuertes" del mercado, rastrear sus intenciones y tomar decisiones de compra y venta.
Diseñado para operar en criptomonedas.
En cuanto a qué temporalidad usar, cuanto más grande mejor, ya que al final lo que estamos haciendo es el análisis de datos y, por lo tanto, cuanto más datos, mejor. Personalmente recomiendo usarlo en velas de 30 minutos, 1 hora y 4 horas.
Recuerde, ningún indicador es 100% efectivo.
Este indicador nos muestra en las áreas de color púrpura (manos fuertes) y en las áreas de color verde (manos débiles) y al mostrármelo gráficamente ya el indicador vale la pena.
El mercado está impulsado por dos tipos de inversores, que se denominan manos fuertes o ballenas (agencias, fondos, empresas, bancos, etc.) y manos débiles o peces pequeños (es decir, nosotros).
No tenemos la capacidad de manipular un valor, ya que nuestra cartera es limitada, pero podemos ingresar y salir de los valores fácilmente ya que no tenemos mucho dinero.
Las ballenas pueden manipular un valor ya que tienen muchos bitcoins y / o dinero, sin embargo, no pueden moverse fácilmente.
Entonces, ¿como pueden comprar o vender sus monedas las ballenas? Bueno, ellos hacen su juego: Tratan de hacernos creer que la moneda esta barata cuando nos quieren vender sus monedas o hacernos creer que la moneda es cara cuando quieren comprar nuestras monedas. Esta manipulación se realiza de muchas maneras, la mayoría por noticias.
Nosotros, los pequeños peces, no podemos competir contra las ballenas, pero podemos descubrir qué están haciendo (recuerde, son lentas, mueven sus monstruosas cantidades de dinero) debemos movernos con ellas e imitarlas. Mejor estar bajo la ballena que delante de ella.
Con este indicador puedes ver cuando las ballenas están operando y reaccionar ; porque el enfoque matemático que los sustenta ha demostrado ser bastante exitoso.
Cuando las manos fuertes están por debajo de cero, se dice que están comprando. Lo mismo ocurre con las manos débiles. Generalmente, si las manos fuertes están comprando o vendiendo, el precio está lateralizado. El movimiento del precio está asociado con las compras y ventas realizadas por la mano débil.
Espero que les sea de mucha utilidad.
Bitrader4.0
This indicator no longer consists of mobile lines that intersect to give input or output signals, but it goes further and graphically interprets what is happening with the value.
It is a powerful algorithm, which includes 4 trend indicators and 2 volume indicators.
With this indicator we can move with the "strong hands" of the market, track their intentions and make buying and selling decisions.
Designed to operate in cryptocurrencies.
As for what temporality to use, the bigger the better, since in the end what we are doing is the analysis of data and, therefore, the more data, the better. Personally I recommend using it in candles of 30 minutes, 1 hour and 4 hours.
Remember, no indicator is 100% effective.
This indicator shows us in the areas of color purple (strong hands) and in the areas of color green (weak hands) and by showing it graphically and the indicator is worth it.
The market is driven by two types of investors, which are called strong hands or whales (agencies, funds, companies, banks, etc.) and weak hands or small fish (that is, us).
We do not have the ability to manipulate a value, since our portfolio is limited, but we can enter and exit the securities easily since we do not have much money.
Whales can manipulate a value since they have many bitcoins and / or money, however, they can not move easily.
So, how can whales buy or sell their coins? Well, they make their game: They try to make us believe that the currency is cheap when they want to sell their coins or make us believe that the currency is expensive when they want to buy our coins. This manipulation is done in many ways, most by news.
We, small fish, can not compete against whales, but we can find out what they are doing (remember, they are slow, move their monstrous amounts of money) we must move with them and imitate them. Better to be under the whale than in front of her.
With this indicator you can see when the whales are operating and reacting; because the mathematical approach that sustains them has proven to be quite successful.
When strong hands are below zero, they say they are buying. The same goes for weak hands. Generally, if strong hands are buying or selling, the price is lateralized. The movement of the price is associated with the purchases and sales made by the weak hand.
I hope you find it very useful.
Bitrader4.0