Ichimoku Bounce on Tenkan-Sen by YellowKumaIchimoku Bounce (Long/Short) on Tenkan-Sen by YellowKuma
Pure bounce signals off the Tenkan-sen • No MTF • No noise
🌊 What It Does
This indicator spots high-probability reversal zones where price reacts off the Tenkan-sen (9-period conversion line) — the fastest Ichimoku component acting as dynamic support/resistance.
✅ Long signal → Price bounces up from Tenkan-sen while trading above the cloud
✅ Short signal → Price rejects down from Tenkan-sen while trading below the cloud
✅ Kijun-sen is used only as a trend filter (Tenkan > Kijun for longs / Tenkan < Kijun for shorts) — never as a bounce level
✅ Zero MTF complexity — runs purely on your chart's native timeframe, no repainting
Signals appear as:
🟢 "L" label below the bar → Bullish Tenkan bounce
🔴 "S" label above the bar → Bearish Tenkan bounce
⏱️ Timeframe Matters — A Lot
This strategy shines on higher timeframes and struggles on low ones. Why?
📈 H4 / Daily / Weekly
→ Tenkan-sen aligns with real institutional pivot zones
→ Cloud represents weeks of consensus value — strong trend filter
→ Bounces carry momentum → larger winners, fewer whipsaws
📉 M5 / M15 / M30
→ Tenkan-sen reacts to micro-noise, not structure
→ Cloud too thin — price slices through easily
→ False bounces dominate → shallow moves, poor R:R
💡 Rule of thumb:
• Use H4 for swing entries
• Use Daily for core trend trades
• Keep a Weekly chart open to confirm macro trend (only trade bounces with the Weekly cloud)
• Avoid M15/M30 entirely — signal quality degrades sharply
⚙️ Settings (Simple & Clean)
• Tenkan-sen Period → 9 (standard) — shorter = more sensitive, longer = smoother
• Kijun-sen Period → 26 (standard) — trend filter only
• Senkou Span B Period → 52 (standard) — defines cloud thickness
• Show Long Bounces → Toggle ON/OFF
• Show Short Bounces → Toggle ON/OFF
Cloud colors:
🟢 Green fill → Bullish cloud (Senkou Span A > B)
🔴 Red fill → Bearish cloud (Senkou Span A < B)
🎯 How to Trade the Signals
1️⃣ Wait for confirmation
→ Never enter mid-bar. Wait for candle close beyond the Tenkan-sen.
2️⃣ Check cloud alignment
→ Longs only when price > cloud top
→ Shorts only when price < cloud bottom
3️⃣ Add price action confirmation (optional but recommended)
→ Bullish engulfing / hammer at Tenkan → stronger long signal
→ Bearish engulfing / shooting star at Tenkan → stronger short signal
4️⃣ Risk management
→ Stop-loss: 1–2 pips beyond bounce bar extreme OR 2×ATR(14)
→ Take-profit: Target Kijun-sen (near-term) or opposite cloud boundary (swing)
→ Minimum reward:risk = 1:3
5️⃣ Avoid these situations
→ Choppy markets (Tenkan/Kijun flat, cloud thin)
→ Major news events (FOMC, NFP) — volatility distorts Tenkan touches
→ Bounces within 15 pips of strong horizontal resistance/support against your direction
🔔 Alerts
Built-in alert conditions:
• "Long Bounce" → triggers when green "L" appears
• "Short Bounce" → triggers when red "S" appears
→ Right-click indicator → Add Alert → choose condition
💡 Pro Tips for TradingView Users
✨ Session timing: Avoid first 60 mins of London/NY open — volatility creates false Tenkan touches
✨ Combine with Weekly trend: Disable short signals when price > Weekly cloud (and vice versa)
✨ Less is more: Expect 2–5 high-quality signals per week on H4 — that's normal. Quality > quantity.
⚠️ Important
This is a price-structure tool, not a magic bullet.
Always:
• Respect the trend (trade bounces with the cloud, not against it)
• Use proper position sizing (0.5–1% risk per trade)
• Keep a trading journal — track which bounces worked and why
✨ Bottom Line
Pure. Simple. Effective.
By focusing only on Tenkan-sen bounces — and enforcing strict cloud alignment — this indicator cuts through noise and delivers clean reversal zones where institutions actually place orders.
Works best on H4 and higher.
Add it. Switch to H4. Trade the bounce. 🚀 @YellowKumo
Tenkan

NICHI (NuwenPham's Ichimoku)NICHI (NuwenPham’s Ichimoku)
NICHI is a dual-engine Ichimoku indicator designed for modern, high-volatility markets.
It preserves a faithful traditional Ichimoku while introducing an advanced, filter-driven Ichimoku framework for research, visualization, and discretionary trading.
The goal of NICHI is not to replace Ichimoku — but to extend it.
Overview
NICHI includes two independent Ichimoku systems that can be enabled separately or together.
1. Standard Ichimoku
A clean, traditional Hosoda Ichimoku using Donchian midpoints:
Tenkan-sen (short period)
Kijun-sen (medium period)
Senkou Span A & B (forward displaced)
Chikou Span (lagging)
Design choice:
The Standard Ichimoku is intentionally plotted in a separate pane to avoid cluttering the price chart.
It serves as a reference / regime baseline, not a visual overlay.
2. Advanced Ichimoku
The Advanced system keeps the Ichimoku structure intact but replaces the Donchian calculations with selectable smoothing filters.
Each Ichimoku component (Tenkan, Kijun, Senkou B, Chikou) can be calculated using modern filters designed to handle volatility, noise, and regime shifts.
Supported filters include:
McGinley Dynamic (MD)
VWMA (exchange or tick-derived volume)
EMA / DEMA / SMA / SMMA / WMA
ALMA / LSMA / Hull MA
COVWMA / FRAMA / KAMA
50th Percentile
Moving Median
This allows Ichimoku to behave as:
A smoother trend system
A volatility-adaptive framework
A momentum-responsive overlay
Enhanced Cloud (Kumo) Modeling
Advanced Kumo logic includes:
Independent forward offsets for Span A and Span B
Bull / bear regime classification aligned with how the cloud is actually drawn
Adaptive cloud coloring
Neutral cloud state when spans disagree
This avoids misleading regime signals when different offsets are used.
Directional Persistence Tracking
NICHI tracks directional streaks for key components:
Tenkan direction
Kijun direction
Span A direction
Span B direction
These persistence counters stabilize coloring, reduce flicker, and improve visual clarity during transitions.
Bar Coloring Modes (Advanced)
Three bar-coloring frameworks are included.
Kumo-Based
Above cloud → bullish
Below cloud → bearish
Inside cloud → neutral
Tenkan / Kijun-Based
Above both → bullish
Below both → bearish
Chikou-Based
Chikou above past price → bullish
Chikou below past price → bearish
Each mode is intentionally distinct and serves a different trading style.
Moving Average Overlays
NICHI includes four optional moving average overlays (MA1–MA4):
Configurable type, length, width, and source
Intended for bias, confluence, or higher-timeframe context
Controlled as code-level constants by design
What Changed Since BETA
This release promotes NICHI from beta to stable with the following key improvements:
Chikou regime logic fixed:
Chikou comparisons now reference historical price only, eliminating any future lookahead behavior.
Kumo bull/bear alignment clarified:
Cloud regime classification now matches how the cloud is visually drawn when Span A and Span B use different forward offsets.
Kijun direction tracking corrected:
Kijun coloring now reflects Kijun movement, not Tenkan movement.
Bar coloring gated:
Bar coloring is applied only when Advanced Ichimoku is enabled, preventing unintended behavior when using Standard mode alone.
General stability and cleanup:
Minor bug fixes, consistency improvements, and documentation clarity.
Notes
Advanced Ichimoku is intended for research and visualization, not as a turnkey strategy.
Standard Ichimoku remains a faithful baseline.
If reporting issues, please include symbol, timeframe, and a screenshot.

NICHI Beta (NuwenPham's Ichimoku)# **NuwenPham’s Ichimoku (NICHI)**
**Version BETA.251123a.3.1.2 – Pine Script v6**
**Author:** NuwenPham
**Forked from:** Donovan Wall
**Contributors:** Claude (Anthropic)
**License:** MPL 2.0
---
# **Overview**
**NICHI (Nuwen’s Ichimoku)** is a next-generation Ichimoku system that merges the classical Hosoda Ichimoku with a modular adaptive-smoothing engine, enhanced Kumo logic, directional trend counters, and multi-mode bar coloring.
The indicator includes **two completely separate Ichimoku engines**:
* **Standard Ichimoku** – Traditional Donchian-based Tenkan, Kijun, Senkou A/B, and Chikou
* **Advanced Ichimoku** – Fully customizable Ichimoku using 15+ moving-average filters and enhanced logic
NICHI is designed for modern markets—especially **futures and volatile instruments** (NG, CL, ES, NQ, crypto).
---
# **Key Features**
## **1. Dual Ichimoku Systems**
* **Standard Mode:**
Classic Donchian Ichimoku with Tenkan, Kijun, Senkou A/B, and Chikou.
Clean, faithful implementation.
* **Advanced Mode:**
Every Ichimoku line uses a **selected smoothing filter** (EMA, KAMA, FRAMA, Hull, McGinley, etc.).
Includes directional persistence tracking, enhanced cloud logic, and adaptive bar coloring.
---
## **2. Advanced Filter Engine (15+ Smooth Types)**
Use any of the following for Tenkan, Kijun, Senkou B, or Chikou:
* EMA
* DEMA
* SMA
* SMMA (RMA)
* WMA
* VWMA
* Hull MA
* ALMA
* LSMA (Linear Regression)
* McGinley Dynamic
* KAMA
* FRAMA
* COVWMA
* Moving Median
* 50th Percentile (Nearest Rank)
This transforms Ichimoku into an **adaptive trend system**.
---
## **3. Enhanced Cloud (Kumo) Modeling**
* Independent forward offsets for Span A & Span B
* Cloud colors adapt based on strength, direction, and filter behavior
* Cloud thickness reflects volatility
* Neutral cloud state available when spans disagree
---
## **4. Directional Persistence Counters**
NICHI tracks the **trend streak** of each main component:
* Tenkan rising/falling
* Kijun rising/falling
* Span A rising/falling
* Span B rising/falling
These counters make cloud and line colors more accurate and stable.
---
## **5. Regime-Based Bar Coloring (3 Modes)**
NICHI includes three built-in trading frameworks:
### **Mode 1: Kumo-Based**
Bar color reflects price relative to the cloud:
* Green = Above Kumo
* Red = Below Kumo
* Orange = Inside Kumo
Ideal for **trend-following** and **market regime detection**.
---
### **Mode 2: Tenkan/Kijun-Based**
Bar color reflects momentum structure:
* Green = Price above both Tenkan & Kijun
* Red = Price below both
Designed for **momentum entries and TK breakouts**.
---
### **Mode 3: Chikou-Based**
Bars reflect historical confirmation:
* Green = Chikou > price (offset period)
* Red = Chikou < price
Excellent for **confirmation-first strategies** where accuracy matters most.
---
## **6. Multi-MA Overlay System**
Up to **four optional moving averages**:
* SMA, EMA, SMMA, WMA, HMA, VWMA
* Independent lengths, widths, colors
* Useful for bias, confluence, trend filters
Default: **SMA 200** enabled.
---
## **7. TK Cross Signals**
Both systems show TK crosses:
* Standard TK Cross (classic)
* Advanced TK Cross (filtered version)
Crosses appear with clear markers for entry/exit logic.
---
# **How to Use NICHI**
## **1. Choose Your Engine**
* **Standard:** Clean, classic Ichimoku
* **Advanced:** Adaptive, filter-driven Ichimoku
* **Both:** Comparative analysis
---
## **2. Select Your Filter Type (Advanced Mode)**
Suggested filters:
| Market | Filter Type | Notes |
| ---------------- | ---------------- | -------------------------- |
| Natural Gas (NG) | KAMA or FRAMA | Handles extreme volatility |
| Crude Oil (CL) | McGinley Dynamic | Smooths spikes |
| ES / NQ | SMMA or WMA | Balanced response |
| Crypto | Hull or ALMA | Handles momentum bursts |
| FX | EMA or SMMA | Classic, stable |
---
## **3. Choose a Bar-Color Strategy**
* **Kumo-Based:** Trend following
* **TK-Based:** Momentum and breakouts
* **Chikou-Based:** Highest confirmation/accuracy
Each strategy is valid and intentionally distinct.
---
## **4. Reading the Cloud**
* **Bullish Cloud:** Span A > Span B
* **Bearish Cloud:** Span A < Span B
* **Neutral Cloud:** Disagreement between spans
* **Thick Cloud:** High volatility / stronger structure
* **Thin Cloud:** Weak trend / potential twist
---
## **5. Entry & Exit Concepts**
### **Entries**
* **Momentum Entry:** TK cross with price above the cloud
* **Reversal Entry:** TK cross before a cloud twist
* **Confirmation Entry:** Chikou breaks cleanly above/below past price
### **Exits**
* Price falling through Kijun
* Re-entering the cloud
* Opposite TK cross
* Cloud flipping against position
---
# **Recommended Trading Approaches**
## **Kumo-Based Trend Strategy**
* Long above cloud, short below
* Avoid signals inside cloud
Best for swing/position trading.
---
## **TK-Based Momentum Strategy**
* Enter on Tenkan/Kijun breakout
* Bar color confirms momentum
* Cloud filter optional but helps
Great for high-velocity markets.
---
## **Chikou-Based Confirmation Strategy**
* Enter only when Chikou confirms structure
* Highest accuracy, fewest trades
* Ideal for volatile markets (NG, CL)
---
# **Closing Notes**
NICHI is a **research-grade Ichimoku framework** designed to handle modern volatility where traditional Ichimoku often fails.
It supports scalpers, swing traders, and system developers alike.
Experiment with:
* Filter types
* Cloud offsets
* Bar-color modes
* MA overlays
to match your strategy and market.

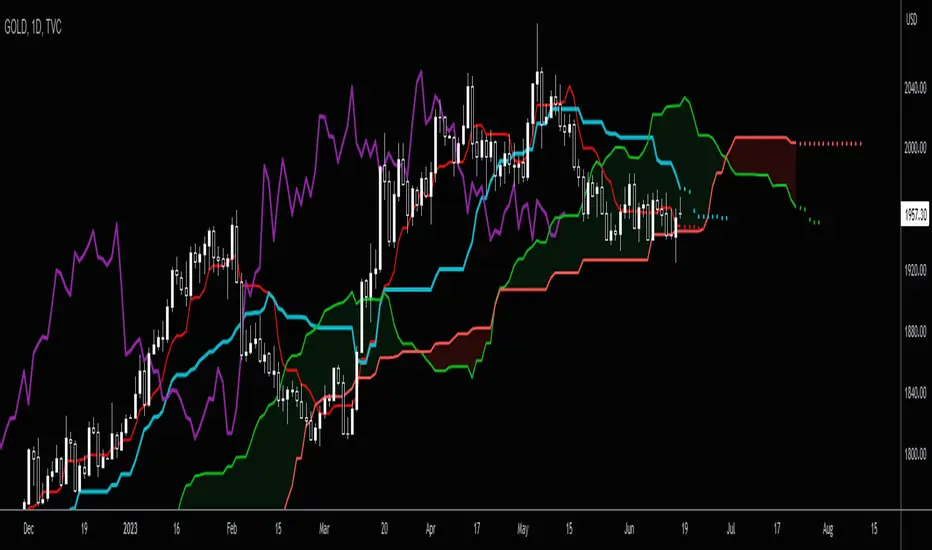
Simple Ichimoku Kinko Hyo Cloud█ OVERVIEW
This indicator as an educational and showcase the usage of user-defined types or objects (UDT) for Ichimoku Kinko Hyo or Ichimoku Cloud.
█ CREDITS
TradingView

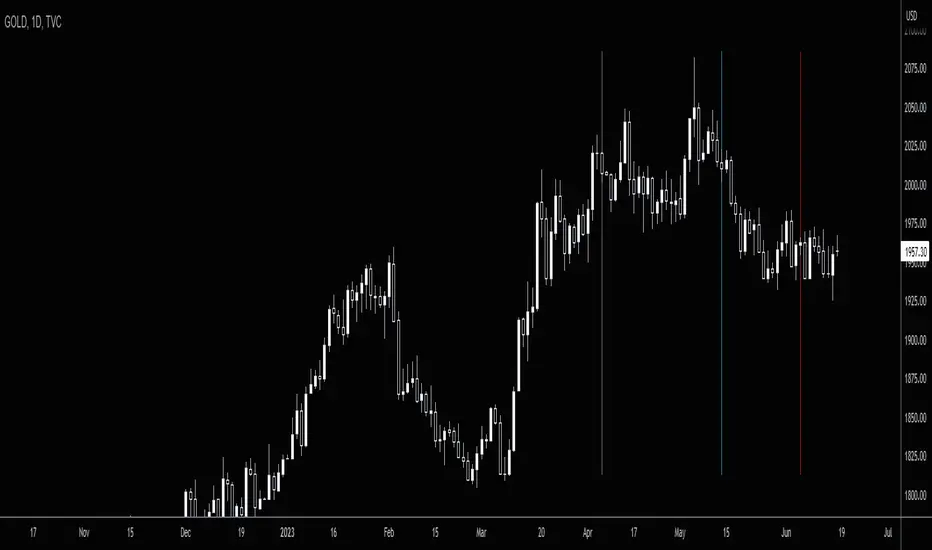
Ichimoku Buy/Sell Signals of manual MTF Tenkan crossing KijunIchimoku Buy/Sell Signals based on fast, small time frame Tenkans crossing longer timeframes Kijuns - Manual MTF Analysis
This code marks the potential change of direction based on the input of one timeframe's Ichimoku Tenkan (conversion) line crossing over a higher, longer timeframe's Ichimoku Kijun (base) line.
Feel free to change the inputs if need be and to hide the yellow box. Use Ichimoku rules of Tenkan, Kijun, Lagging Span, and Cloud for Take profit/Stop Losses. It is best to wait 3-5 minutes after the signal to enter to confirm the trend and to confirm if the Lagging Span has broken key levels. I refer to the book Trading with Ichimoku - A Practical Guide to Low-Risk Ichimoku Strategies by Karen Peloille as the Ichimoku rulebook. Good luck.
For day trading/scalping/intraday - 1min/3min/5min
Tenkan Line Timeframe = 1min
Kijun Line Timeframe = 5min
For swing trading - multiple days/weeks - 4HR/Daily/Weekly Charts
Tenkan Line Timeframe = day
Kijun Line Timeframe = week

SuperIchi [LuxAlgo]Using one indicator as the core for another one to improve certain aspects while offering an alternative user interaction can be very interesting in technical analysis.
This indicator is a modification of the popular Ichimoku indicator using the equally popular Supertrend indicator as its core, thus no longer entirely relying on calculations done over a fixed window size but instead relying on the average true range and the trend detection method offered by the Supertrend.
Settings
Tenkan: Atr length (left) and factor (right) used for the Supertrend involved in the calculations of the Tenkan Ichimoku component
Kijun: Atr length (left) and factor (right) used for the Supertrend involved in the calculations of the Kijun Ichimoku component
Senkou Span B: Atr length (left) and factor (right) used for the Supertrend involved in the calculations of the second Senkou Span Ichimoku component
Displacement: Bar offset of the cloud (positive offset) and Chikou (negative offset)
Usage
The SuperIchi indicator can be interpreted similarly to a regular Ichimoku as it retains the components and aspects from this one. Users can make use of the Supertrend Factor to detect shorter or longer-term trends.
Unlike the regular components of the Ichimoku based on rolling maximums/minimums, using the Supertrend here allows smoother components and makes it less prone to whipsaw signals.
Note that the Chikou is disabled by default in the style settings
Details
The original Ichimoku indicator is constructed from the average between the rolling maximum high and minimum low values. The Supertrend indicator also relies on one upper/lower extremity but using the average of these extremities for the modification of the Ichimoku indicator might not provide easy to use results due to the nature of these extremities.
Instead, we compute the average between the Supertrend and trailing maximums/minimums with a value reset when a new trend is detected by the Supertrend. This allows obtaining a result that is closer to the original average used by Ichimoku.

Tenkan Higher Time Frame by TheSocialCryptoClubName: Tenkan HTF
Category: Indicator.
Timeframe: Any Timeframe
Description: Tenkan Higher Timeframe allows to visualise the Tenkan for the Current timeframe and one at a higher timeframe.
Suggested usage: Use on Daily to evaluate the Weekly Tenkan.
Technical Details: When the Tenkan changes direction, it is evaluated if the change is due to the creation of new highs or new lows - so what happened in the last candle, a symptom of strength or weakness - or if the change is due to the fact that the "outgoing" candle had lows or highs that were no longer present in the Tenkan period.
This indicator can also be used - by setting the appropriate period length - for the Kijun.
Credits:
- Technique has been explained by Corrado Rondelli.

T/K CROSSSimple crossing of the Tenkan & Kijun Sen indicated by a "Cross". Surfed Tradingview for it, but did not find it, so decided to make one. Does NOT include the Ichimoku Cloud & the Chikou

Ichimoku+Based on the ichimoku cloud system, this indicator gives two presets: Standard (9/26/52/26) and Crypto (20/60/120/30).
This also shows on a chart where Tenkan-Kijun cross happens and when a Kumo Twist happens.

TK Cross and Kumo Twist AlertBased on the ichimoku cloud system, this shows on a chart where Tenkan-Kijun cross happens and when a Kumo Twist happens.

Future Ichimoku LinesFuture Ichimoku Lines Plot: Tenkan-sen next 5 days, Kijun-sen next 10 days, Kumo A next 5 days and Kumo B next 14 days will be display
This will help you forecast the future of price and increase winning probability!
Always remember, risk management is the key of a successful trader
Have a nice trade! :D
Ichimoku Line CounterThis simple script will help you seen the range of Kijun-sen, Tenkan-sen and Senkou span B. You can use it to analyze the direction of Ichimoku components. Very useful for Ichimoku trader!
Example: how many days Kijun, Kumo, ... still flat or become flat?
We use the default number: 9, 26 and 52. You absolutely can modify it if your system use different numbers :P
Have a nice trade! :D
Kijun-Price DistanceThis script shows optional:
- distance between close price and Kijun-Sen
- distance btween Tenkan-Sen and Kijun-Sen
- Background color of current time frame
- Background color of the next higher time frame
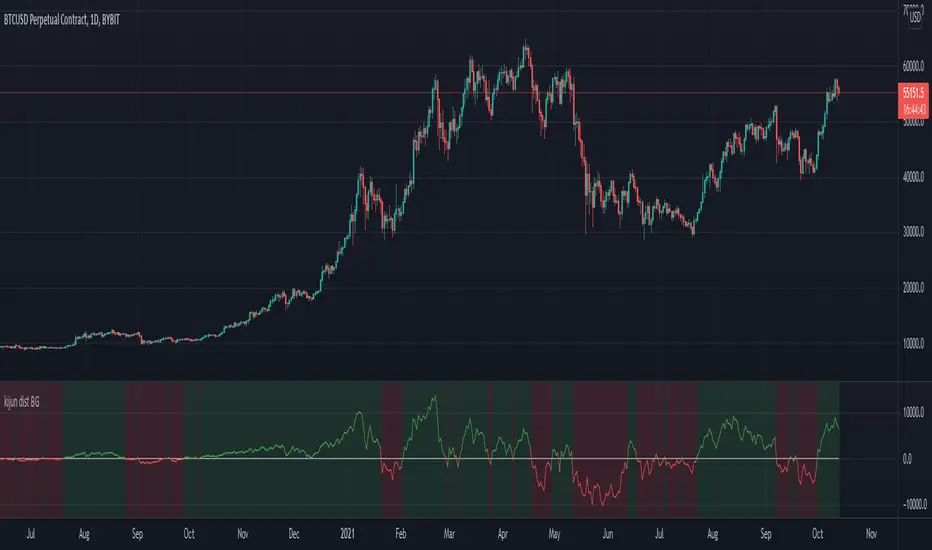
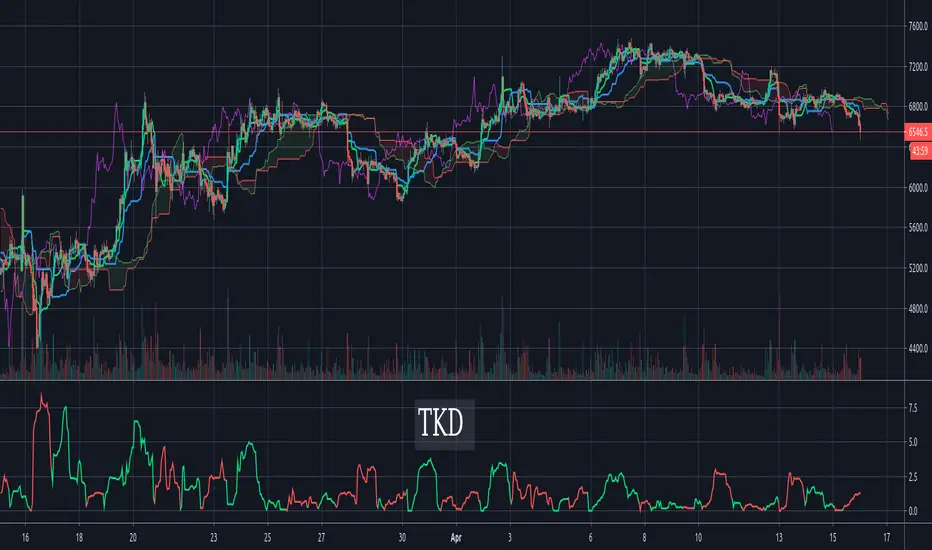
Tenkan-Sen Kijun-Sen Distance (TKD) Oscillator - IchimokuThe TKD is the distance between the Tenkan-Sen and the Kijun-Sen, expressed in percentage of current price. The further apart the tenken-sen and kijun-sen are, the more they want to snap back together. This makes for a decent oscillator. When the Tenkan-Sen is above the Kijun-Sen, the TKD is green. When it is below, the TKD is red. At the crossing points, it turns blue.
For those more familiar with Ichimoku Cloud techniques, one might also think of this indicator as a C-Clamp indicator. Bar coloring is supported and enabled by default. There's also an option to flip/invert the green/red colors in case you want to use it to judge pending cycles rather than current ones.
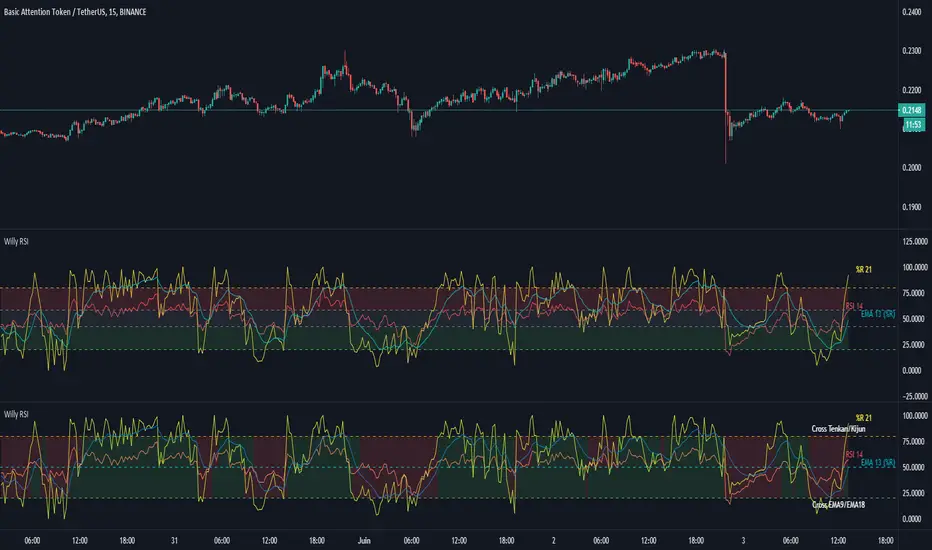
Williams %R + RSI + EMA - [Silver-Wong]
Williams %R + EMA + RSI
Un seul indicateur avec :
- William %R
- RSI
- EMA
- Une ligne médiane
- Les étiquettes des indicateurs
My Ichimoku indicator & Strategyhello I'm a beginner in trading, but I try to learn how to code strategies.
I recoded the Ichimoku indicator, and created my personnal strategy based on it.
The backtesting is done from 1/1/2017 to today in 45 min Time Unit for candles, with a 1 000 € equity.
The trades are all Long Entries and Exits with no pyramiding, no short trades at all.
/!\ Exchanges commission fees are not calculated and can in reality easily divide by 2 the total profit (am I right guys?) /!\
A buy signal is triggered upon these conditions:
- close is above the Kuma (cloud)
AND
- close crosses over Kijunsen AND Kijunsen is not flat (calculated with rising and falling with input "Kijunsen Lag")
OR
- Close crosses over ChikouSpan AND there was a sell signal in the last 8 candles
Sell signal is the same but reversed.
I appreciate your feedback ! Maybe I will update this later if I get better results.
