VIX Term Structure Pro [v7.0 Enhanced]# VIX Term Structure Pro v7.0
[! (img.shields.io)](www.tradingview.com)
[! (img.shields.io)](www.tradingview.com)
[! (img.shields.io)](LICENSE)
**Professional VIX-based Market Sentiment & Timing Indicator**
专业的 VIX 市场情绪与择时指标
---
## 🌟 Overview / 概述
VIX Term Structure Pro is an advanced multi-factor market timing indicator that analyzes the VIX futures term structure, volatility regime, and market breadth to generate actionable buy/sell signals.
VIX Term Structure Pro 是一款高级多因子市场择时指标,通过分析 VIX 期货期限结构、波动率区间及市场广度,生成可操作的买卖信号。
---
## 🚀 Key Features / 核心功能
### 📊 Multi-Factor Scoring System / 多因子评分系统
- **Term Structure Z-Score**: Measures deviation from historical mean / 期限结构 Z 分数:衡量与历史均值的偏离
- **VIX/VX1 Basis**: Spot premium detection for panic signals / VIX 现货溢价:恐慌信号检测
- **Contango Analysis**: Futures curve shape insights / 期货升水分析
- **SKEW Integration**: Options skew for tail risk / SKEW 整合:尾部风险监测
- **Put/Call Ratio**: Sentiment extremes / 看跌/看涨比率:情绪极端
- **VVIX Support**: Volatility of volatility (optional) / VVIX 支持:波动率的波动率
### 🎯 Three-Tier Signal System / 三级信号系统
| Signal | Score | Description |
|--------|-------|-------------|
| 🚨 **CRASH BUY** | ≥ 6 | Extreme panic, rare opportunity / 极端恐慌,罕见机会 |
| 🟢 **STRONG BUY** | ≥ 5 | Multi-factor confluence / 多因子共振 |
| 🟡 **BUY DIP** | ≥ 4 | Accumulate on weakness / 逢低吸纳 |
| 🟠 **SELL/HEDGE** | ≤ -2 | Consider reducing risk / 考虑减仓对冲 |
| 🔴 **STRONG SELL** | ≤ -5 | Strong bearish signals / 强烈看跌信号 |
| 🔥 **EUPHORIA SELL** | ≤ -6 | Extreme greed, sell signal / 极度贪婪,卖出信号 |
### 📈 Dashboard Indicators / 仪表盘指标解读
| Indicator | Bullish 🟢 | Bearish 🔴 |
|-----------|------------|------------|
| Overall Bias | STRONG BUY / BUY DIP | STRONG SELL / SELL/HEDGE |
| AI Score | ≥ 5 (Extreme Fear) | ≤ -5 (Extreme Greed) |
| Market Trend | 🟢SPX 🟢NDX (Above MA200) | 🔴SPX 🔴NDX (Below MA200) |
| VIX Regime | LOW VOL (<15) | HIGH VOL (>25) |
| Term Struct Z | < -2.0 (Panic) | > 2.0 (Complacency) |
---
## ⚙️ Configuration / 配置选项
### 📡 Data Sources / 数据源
- **VIX Symbol**: Default `CBOE:VIX` (Alternative: `TVC:VIX`)
- **Put/Call Ratio**: Default `INDEX:CPCI` (Index P/C)
- **Timeframe**: Daily (stable) or Chart (real-time)
### ⚠️ Strategy Mode / 策略模式
- **High (Scalping)**: Sensitive, for short-term trades / 高敏感,短线
- **Normal (Swing)**: Balanced approach / 平衡模式
- **Low (Trend/Safe)**: Conservative, trend-following / 保守,趋势跟踪
### 🔬 Backtest Mode / 回测模式
- **OFF (Real-time)**: Shows current day data, suitable for live monitoring / 显示当日数据,适合实盘监控
- **ON (Historical)**: Uses only confirmed data, avoids look-ahead bias / 仅使用已确认数据,避免未来函数
---
## 📖 Usage Guide / 使用指南
### Best Practices / 最佳实践
1. **Apply to SPX/SPY/QQQ daily charts** for optimal signal accuracy
在 SPX/SPY/QQQ 日线图上使用,信号准确度最佳
2. **Wait for next trading day** to execute signals (signals trigger on daily close)
信号触发后在下一交易日执行(信号基于日线收盘)
3. **Use in conjunction with price action** for confirmation
结合价格走势确认信号
4. **Enable Market Trend Filter** (MA200) for safer entries in uncertain markets
开启趋势过滤(MA200)以在不确定市场中更安全入场
### Signal Interpretation / 信号解读
```
🚨 CRASH BUY (Score ≥ 6)
→ Rare extreme panic event
→ Historical average return: significant positive over 2 months
→ Consider aggressive positioning
🟢 STRONG BUY (Score ≥ 5)
→ Multiple indicators align
→ Historical average return: positive over 1 month
→ Consider building positions
🟡 BUY DIP (Score ≥ 4)
→ Moderate fear detected
→ Suitable for adding to existing positions
→ Filtered out in bear markets if Trend Filter is ON
```
---
## 📊 Historical Statistics / 历史统计
The indicator tracks signal frequency and average subsequent returns:
- **CRASH BUY**: 40-day return period (~2 months)
- **STRONG BUY**: 20-day return period (~1 month)
- **BUY DIP**: 10-day return period (~2 weeks)
指标追踪信号频率和后续平均收益,可在仪表盘中查看历史统计。
---
## 🔔 Alerts / 警报
Built-in alert conditions with cooldown mechanism to prevent spam:
| Alert | Condition |
|-------|-----------|
| Crash Buy Alert | Score ≥ 6, extreme panic |
| Strong Buy Alert | Score ≥ 5, multi-factor confluence |
| Buy Dip Alert | Score ≥ threshold |
| Euphoria Sell Alert | Score ≤ -6, extreme greed |
| Strong Sell Alert | Score ≤ -5 |
| VIX Basis Panic | VIX spot premium spike |
---
## 📋 Changelog / 更新日志
### v7.0 (Current)
- ✨ Three-tier buy/sell signal system
- 📊 Signal statistics with average return tracking
- 🔬 Backtest Mode toggle for historical testing
- 🎨 Configurable ±1 Z-Score reference lines
- ⚡ Modular scoring functions
- 🛡️ Dual index trend display (SPX + NDX)
- 📱 Compact & Full dashboard modes
---
## ⚠️ Disclaimer / 免责声明
**English:**
This indicator is for educational and informational purposes only. It does not constitute financial advice. Past performance does not guarantee future results. Always do your own research and consider your risk tolerance before trading.
**中文:**
本指标仅供教育和信息参考,不构成投资建议。过往表现不代表未来收益。交易前请自行研究并评估风险承受能力。
---
## 📄 License / 许可证
MIT License - Feel free to use, modify, and share.
---
## 🤝 Contributing / 贡献
Issues and pull requests are welcome!
欢迎提交问题和贡献代码!
---
**Made with ❤️ for the trading community**
**为交易社区用心打造**
Termstructure

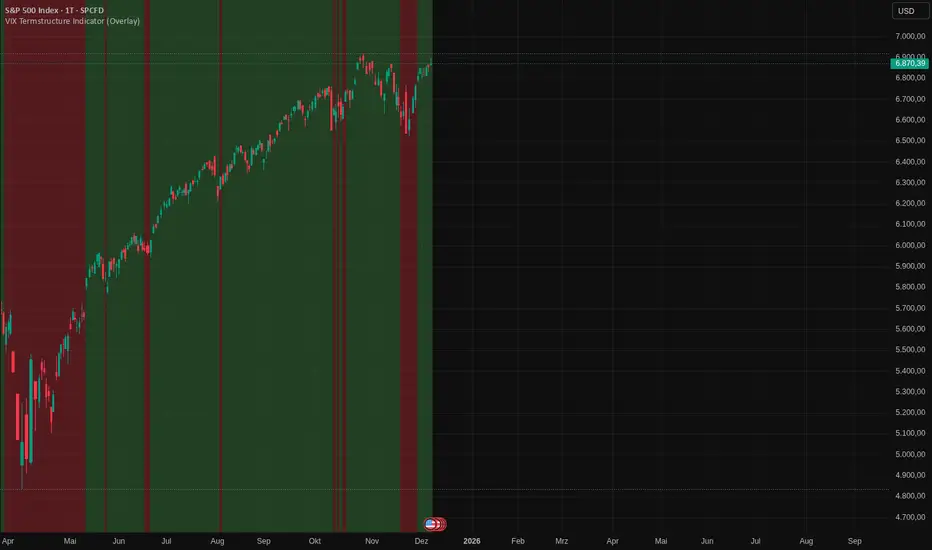
VIX Termstructure Indicator (Overlay)This indicator visualizes the VIX futures term structure directly on your chart background and highlights three key volatility regimes using color coding. It helps identify when the volatility curve is in normal contango, inverted (backwardation), or undergoing a curve flip between the front-month VIX futures.
What the indicator does
The script pulls and compares:
VIX spot index: VIX
Front-month VIX futures: VX1!
Second-month VIX futures: VX2!
All data is requested on the daily timeframe and used to classify the current volatility environment. The indicator then colors the background of your chart according to the detected VIX term structure:
Green background – Contango:
VIX spot is below the front-month futures (VIX < VX1!).
This is typically associated with more “normal” market conditions and lower perceived short-term stress.
Red background – Inverted curve (Backwardation):
VIX spot is above the front-month futures (VIX > VX1!).
This often signals elevated fear, stress, or risk-off conditions in the market.
Yellow background – Curve flip between VX1! and VX2!:
The front-month futures are trading above the second-month futures (VX1! > VX2!).
This can indicate a transition phase in the volatility term structure and may precede or accompany shifts in market sentiment.
How it works
The script fetches the daily close values of VIX, VX1!, and VX2!. It checks whether the front-month futures are above the second-month futures to detect a curve flip. It compares VIX with VX1! to determine if the curve is contango or inverted. Based on these conditions, the chart background is colored with a semi-transparent overlay:
Red has priority when VIX is above VX1! (inverted curve).
If not inverted, yellow is shown when a curve flip VX1! > VX2! is detected.
Otherwise, the background is green (normal contango).
Use cases
This overlay is designed as a context tool for indices, ETFs, Options, or individual stocks that are sensitive to volatility and risk sentiment. Typical applications include:
Identifying periods of heightened risk (red / inverted curve) to adjust position sizing or risk exposure.
Confirming risk-on environments (green / contango) where volatility is more contained.
Monitoring yellow curve-flip phases as potential early warnings of changing volatility regimes.
The indicator does not generate buy/sell signals on its own, but it can be a valuable regime filter or confirmation layer alongside other technical tools.
Notes
This is an overlay indicator: it colors the background of your active chart.
All VIX-related data is evaluated on the daily timeframe, regardless of the chart timeframe.
Make sure that the symbols VIX, VX1!, and VX2! are available on your broker/data feed in TradingView.
VIX vs VIX1Y SpreadSpread Calculation: Shows VIX1Y minus VIX
Positive = longer-term vol higher (normal contango)
Negative = near-term vol elevated (inverted term structure)
Can help identify longer term risk pricing of equity assets.

Contango/Backwardation Monitor
This is an indicator to display the spread difference between two products. I designed it around VX1! and VX2! but any other two products can be chosen. It is a simple subtraction of VX2-VX1. I will go through the options first and what they do followed by what contango/backwardation is in my own words. You will need the data package for VX futures for the default version to work.
INPUTS
-Apply Smoothing: choose to apply smoothing or not.
-Smoothing Method: choose between SMA,EMA,WMA, etc.
-Line Width: Width of line if line is chosen style(can be changed in style section)
-Threshold 1-5: This is the level at which the line will change colors(defaults are for VX)
-Color 1-5: The color the line will change to when crossing threshold.
Towards Backwardation: Background color change when line is slanted down
Towards Contango: Background color change when line is slanted up
Bars to Confirm Trend: This is my method to cut down on background color changes. It is how many bars consecutive going back needed to change color.
STYLE
-All colors and whatnot can be changed here(threshold colors can be changed here or on the input page).
T1 Line-T5 line: These are simple horizontal lines that can be used to denote threshold areas or whatever you want.
Contango/Backwardation-These terms are used mostly with futures to define the calendar spread between two contracts. Contango is when that spread is is getting longer and backwardation is when that spread is closing. In terms of VIX futures, Contango would imply that volatility is stabilizing and the S and P will likely gain. Backwardation, woudl eb the opposite.
The most simple way to read this indicator with default settings- If the line is up, red, and the background is red, then you can assume S and P prices are going down. And if the opposite is true, then prices are likely going up.
Please feel free to ask any questions and I will do my best to answer them.

Historical Federal Fund Futures CurveUse this indicator to plot the federal funds futures implied rates term structure against historical curves
Based upon the work of @BarefootJoey, @longfiat, @OpptionsOnly

Cash VIX Term StructureLet’s first start with some definitions:
VIX9D: The CBOE S&P 500 9-Day Volatility Index estimates the expected 9-day volatility of S&P 500® stock returns.
www.cboe.com
VIX: The CBOE Volatility Index® (VIX® ) is considered by many to be the world's premier barometer of equity market volatility. The VIX Index is based on real-time prices of options on the S&P 500® Index (SPX) and is designed to reflect investors' consensus view of future (30-day) expected stock market volatility. The VIX Index is often referred to as the market's "fear gauge".
www.cboe.com
VIX3M: The CBOE 3-Month Volatility Index is designed to be a constant measure of 3-month implied volatility of the S&P 500® (SPX) Index options.
www.cboe.com
VIX6M: The CBOE S&P 500 6-Month Volatility Index is an estimate of the expected 6-month volatility of the S&P 500® Index.
www.cboe.com
VIX1Y: The CBOE S&P 500 1-Year Volatility Index is an estimate of the expected 1-Yeaer volatility of the S&P 500® Index.
www.cboe.com
This indicator visually displays the relationship between all the above products (short term vol vs long term vol). It also displays the current value and daily percentage change.
The shape of the term structure can tell us a lot about the market:
When the slope of the term structure is upward sloping (longer term VIX are higher than shorter term VIX), we say the term structure is in contango. This usually means that market is stable.
When the slope of the term structure is downward sloping (longer term VIX are lower than shorter term VIX), we say the term structure is in backwardation. This usually happens in periods of extreme market volatility.
Sometimes VIX9D will be higher than VIX but the rest of the curve is in contango. This means that there might be some event in the next 9 days that we need to pay attention to.
I also added a few ratios that I personally track like VIX9D/VIX, VIX/VIX3M and VIX/VIX6M.
When trading short term, I tend to focus on the front end of the curve. When trading long term, I tend to look at VIX/VIX6M.
In addition to the ratios, I added some historical parameters (lookback date can be set from the indicator’s settings) like Highest Value, Lowest Value, Percentile Rank, Average, Median and Mode.
Percentile ranks are displayed for both individual products and their ratios (that’s how I like to see them).
I hope you guys like this indicator.
Happy trading!

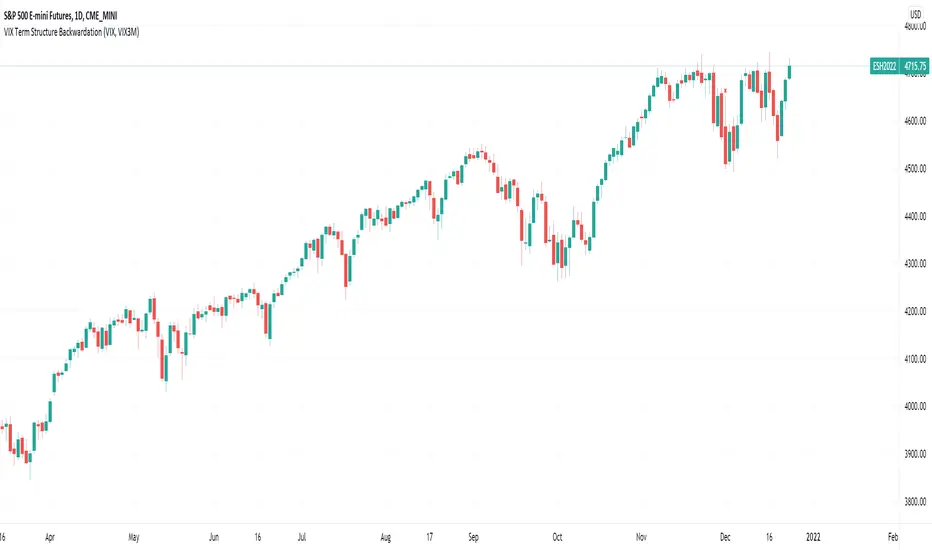
VIX Term Structure BackwardationTracks backwardation of the VIX Term Structure using the difference between 2 custom durations VIX / VIX3M /VIX6M/VIX1Y
vx_termsUSAGE
--------
This script helps train your intuition for changes in the VX term structure. I recommend using it on the VIX chart, so you can compare changes in the terms to changes in VIX. It's also nice for calendar spread traders who want to get a feel for the same changes.
1. Select a day, month, and year using the inputs
2. Observe the data table.
3. Open the input again and increment or decrement the day (and month, year as necessary).
4. Click "Ok".
5. Click to deselect the indicator, which allows the chart to load new data.
6. The data table will be reloaded with the next/previous day's data.
The data table has the following columns:
- contract: the VX contracts, in sequence. refer to the CBOE for month codes (F for January, etc.)
- close: the closing price of the contract.
- ma:mb: the spread (difference) between this row and the next row.
- ma:mb chg: the spread's change from prior close.
For example, given the following values for the first two columns:
VXQ2021, 16.5, -3.1, -0.2
VXU2021, 19.6, ..., ...
The front month (Q = august) closed at 16.5, $3.1 below the s\September contract. The negative spread enlarged by $0.20 from $2.90 on the previous trading day.
BUGS, ODDITIES, AND LIMITATIONS:
-------------------------------------------
- The first column will be greyed out after expiration day, which is the 3rd Tuesday of that month. Unfortunately, I can't load the next month's contract due to some limitations with TV.
- The active date is highlighted with a yellow background. When a non-trading date is selected, the highlight will disappear. However, the data table will sometimes fill with the nearest trading date, prematurely. No worries, just know that the data is probably for the previous Friday.
- The script is clunky and slow, but this is the best I can do with TV. Hopefully they add more continuous contracts or allow true dynamic symbol loading.
SPECIAL THANKS:
---------------------
Thanks to HeWhoMustNotBeNamed for helping me get through some messiness. Very helpful guy.
www.tradingview.com

VIX Term StructureThis script allows users to visualize the state of the VIX Futures Term Structure. The user is able to select from five CBOE VIX Indices; VIX, VIX9D, VIX3M, VIX6M, and VIX1Y and the script will color the candles based on the price relationship between selected indices. Visit the CBOE website for more info on how the various VIX indices are calculated.
