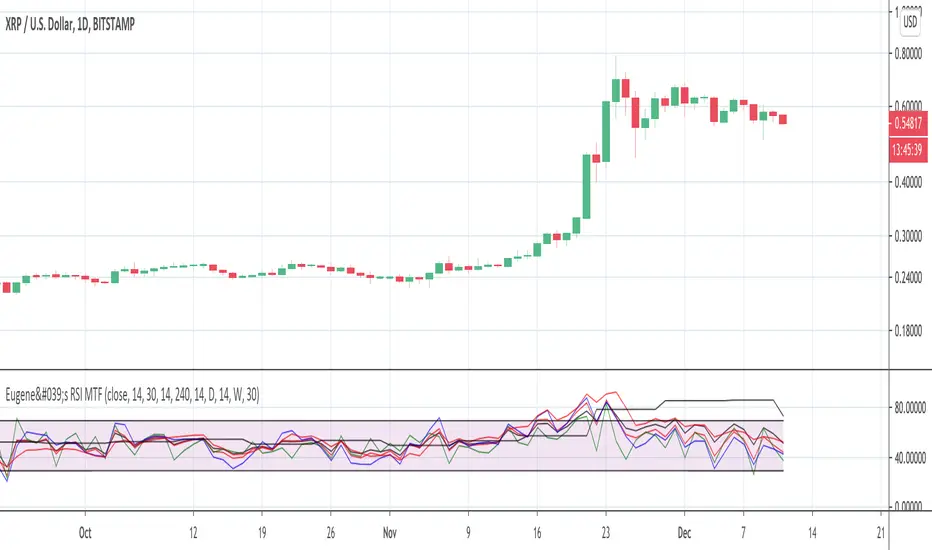
Eugene's RSI MTFFeel free to use this Multi Time Frame RSI indicator.
You can select up to 4 time frames.
You can plot either each of them or the average of all 4 or the faster 3.
Enjoy. Please leave a like if it is useful to you.
الزمن
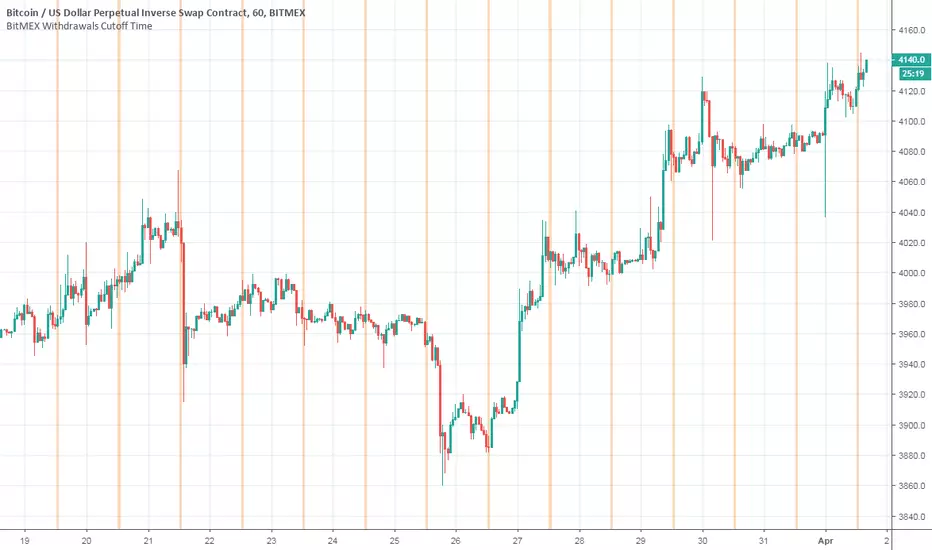
BitMEX Withdrawals Cutoff TimeThis indicator highlights time on the chart when BitMEX processes withdrawals.


Sum and Subtract Hours and Minutes to Sessions SampleThis indicators it's a programming sample of how to sum and subtract hours and minutes to sessions on Tradingview

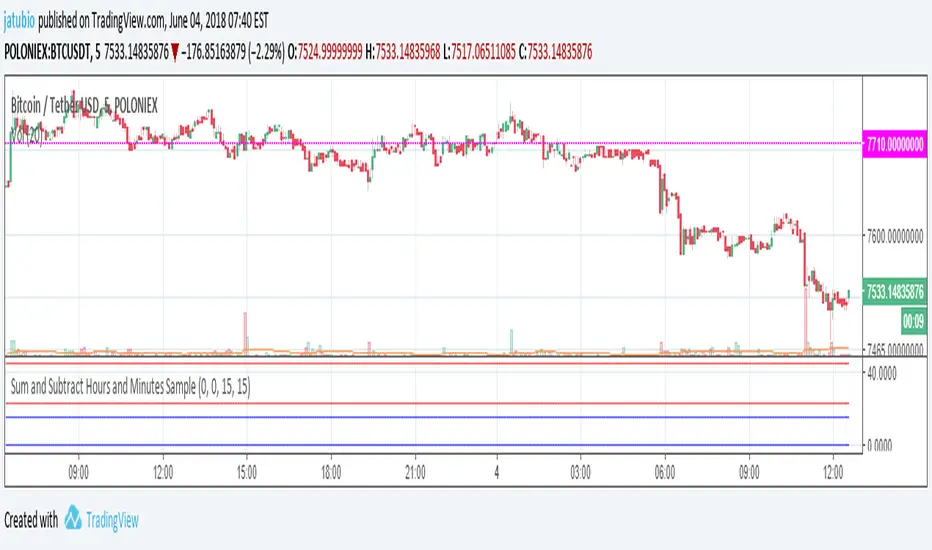
Sum and Subtract Hours and Minutes SampleThis indicators it's a programming sample of how to sum and subtract hours and minutes on Tradingview
Sum string hours sampleThis indicators it's a programming sample of how to sum string hours on Tradingview

C320up Strategy Tester Start TimeC320up Strategy Tester Start Time
This is a little snippet you can paste into your Strategy to set the testing start date and time.
It is not a Strategy per se, though is an example with the timestamp script included.
Instructions are fairly straight forward, and are listed in the script.
If for some reason you also wanted an end date, that too is possible. Just leave a note in the comments.
Disclaimer: We searched for a similar script on TV, and could not find anything at this point in time.
You can set your preferred date and time in the input section of the settings.
Enjoy!

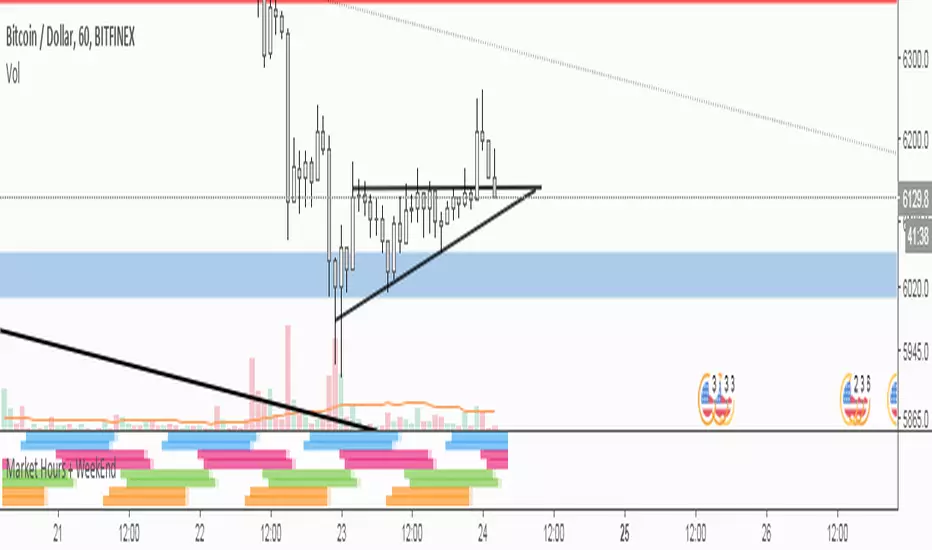
Custom Time ranges
Description:
This script colours the background of any time range you specify, including weekend periods.
It can be useful for spotting patterns on Bitcoin (recurring times of buying or selling).
Checkboxes to switch on and off. Inputs to specify time and day of week.
Monday = 2
Tuesday = 3
Wednesday = 4
Thursday = 5
Friday = 6
Saturday = 7
Sunday = 1
Example 1:
1500-1800:2
This will colour the background between 3pm and 6pm on Mondays.
Example 2:
0000-0600:247
This will colour the background between midnight and 6am on Mondays, Wednesdays, and Saturdays.
Any questions you may have, please leave in comments below and I'll respond when I have time.

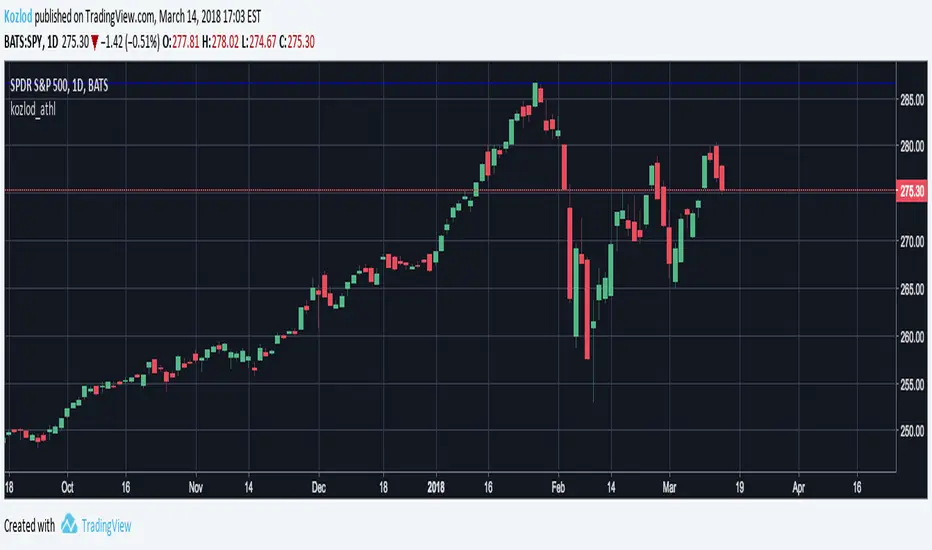
Kozlod - All-time high/low alertsA small script to track all-time high/low levels.
You can create alerts when levels will be updated.
Custom Time Frame, Inverse Price CapabilityAt it again. This time I've added to the custom time frame indicator an inversion capability. This way you can look at the inverse price of custom time frames, again without having to go pro!
I use it too look at downtrends with the same bias as I do uptrends. Unfortunately usually to look at the inverse on timeframes anything other than the 1D chart you need a pro account, but not with this indicator!
Enjoy.

Fibonacci Time Moving Average Ribbons [DW]This is an experimental study that takes a moving average of price, then offsets the average by up to 11 consecutive Fibonacci numbers from 1 to 144.
Choose between Kaufman's Adaptive Moving Average, Hull Moving Average, Fractal Adaptive Moving Average, Geometric Moving Average, or Exponential Moving Average.

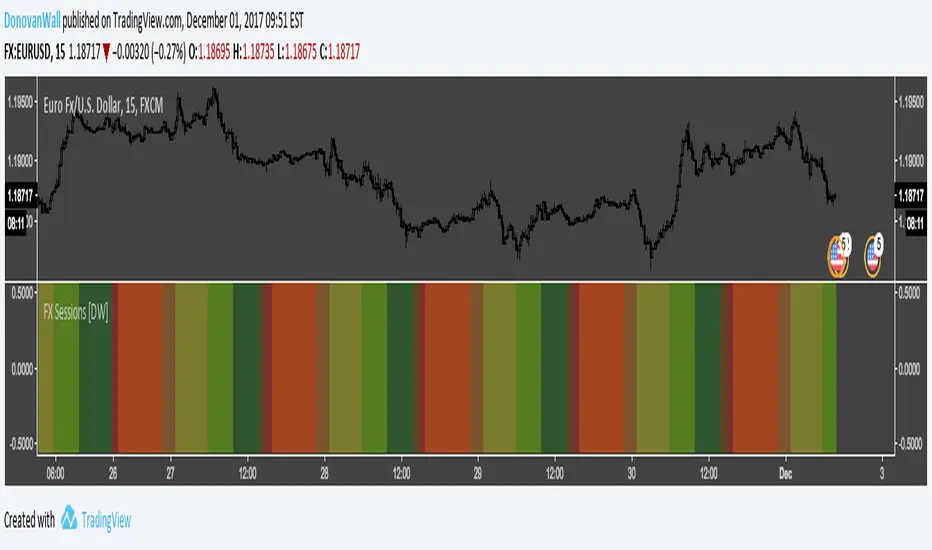
Forex Daily Trading Sessions [DW]This is a simple study designed to highlight the daily forex market sessions. Use it to identify the best sessions to trade your security in.
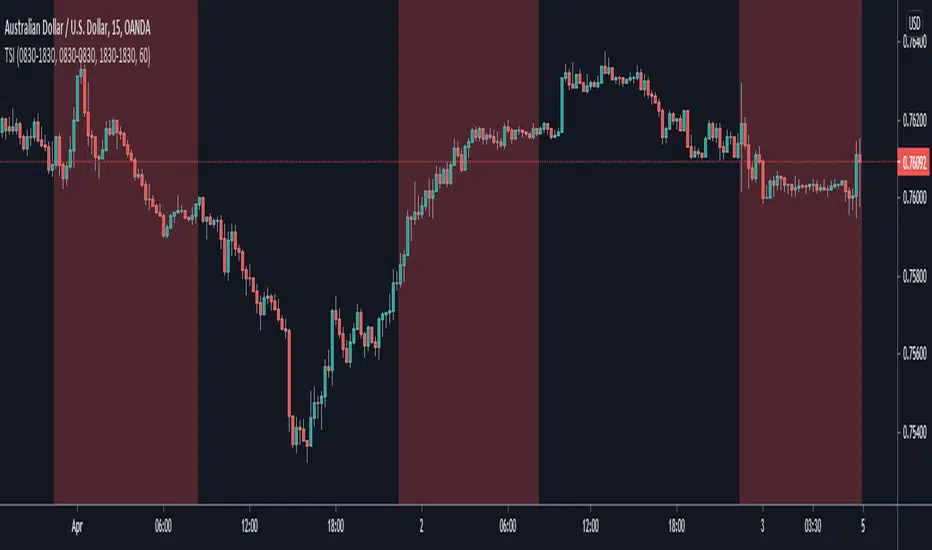
Trading Session IndicatorThis indicator is basically just a back-testing tool. All it does is highlight the background of your charts with the specified color within the specified timezone.
This is useful particularly for back-testing purposes, such as testing a day-trading strategy within a particular period of the day or ignoring signals that fall within the given timeframe (which is useful for ignoring setups during your testing that appear while you're asleep or at work etc.)
Take it easy :)
- Matt.
Renko Bar Time by JustUncleLThis indicator in designed to be used with Renko and other price only bars (ie Kagi, LineBreak, Point&Figure) and shows the number of minutes a bar was open before it was confirmed and printed.
NOTE: It will only work on currencies and symbols that are in the 24/5 market, it does account for weekend market close time but does not account for any Forex market holiday close times.
HINTS:
When the BAR TIME is long and the Renko Bricks have wicks, this is an indication of consolidation.
When the BAR TIME is short and the Renko Bricks have no wicks, this is an indication of acceleration.

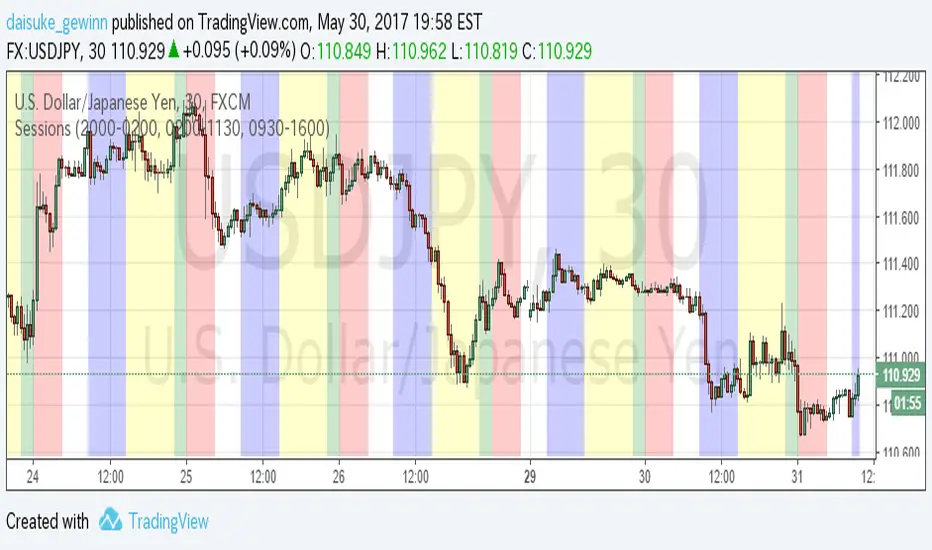
Time Sessions for FXCMThis indicator show Japan, EU and USA sessions for Currency.
The default parameters setting for FXCM summer time.(UTC-4)
英語の意味があっているか自信がないため、日本語でも書いておきます。
Trading Viewの通貨チャートで日本時間、EU時間、アメリカ時間を表示するインジケータです。
夏時間の自動判別などは入れていません。デフォルト設定はFXCMのUTC-4に合わせています。
もっと汎用的に作りたかったのですが、すごく面倒な感じになってしまったので、まずシンプルに
作成しました。
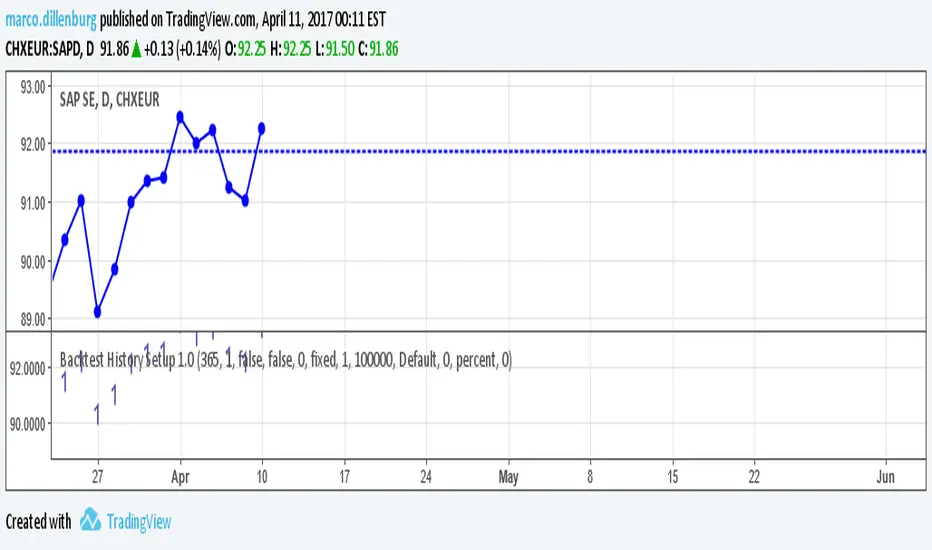
Backtest History Setup 1.0Script of strategy component to setup the backtext lookback. You setup the maximum days back in the history, which will be used for backtest.
EMA Time-FrameThis EMA allows you to specify a time-frame for the price used to calculate the moving average. For example, you can create 1 hour EMAs on your 5 minute chart.
NOTE: This indicator only works on intraday charts. The time-frame specified for the indicator must be greater than or equal to the time-frame of the chart.

Time zoneRegular script to allocate the specified time range within a day.
TradingView in time is specified by UTC. I Moscow time (GMT +3) and the time specified in the script Default 1:00 - 13:00 Moscow time equal 09:00 - 21:00 ie -8 Hours from the Moscow time (-7 in summer).
========== ==========
Обычный скрипт для выделения указанного диапазона времени внутри дня.
Время в TradingView указывается по UTC. У меня московское время (GMT +3) и время указанное в скрипте по умолчания 01:00 - 13:00 по московскому времени равняется 09:00 - 21:00 , т.е. -8 часов от московского времени (-7 в летнее время).

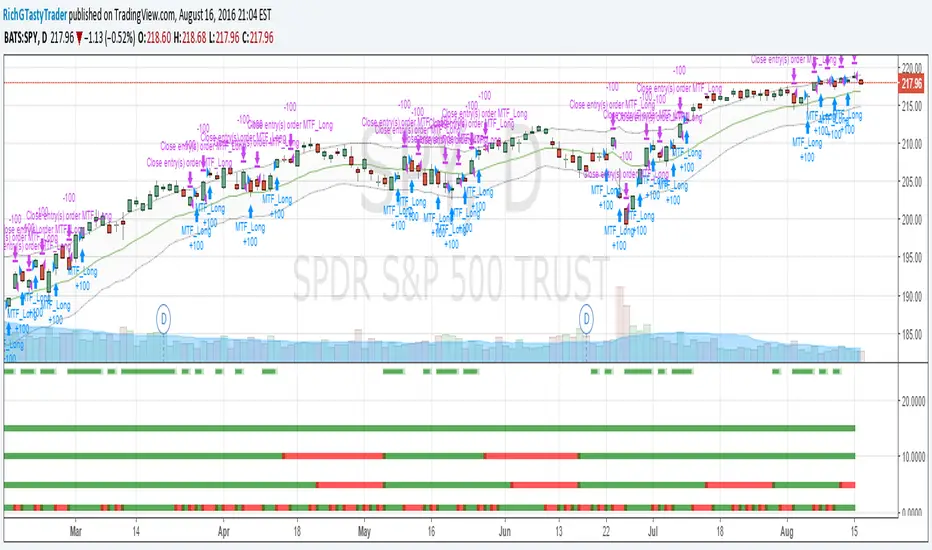
[RichG] Easy MTF Strategy v1.1This is a second attempt at an easy to understand multiple time frame strategy. This one uses ATR for exits. If the position is long, and the price closes below the ATR multiplier, it triggers a close. If the position is short, and the price closes above the ATR/multiplier, it triggers a close. This generates a lot of little trades but is useful because it uses multiple time frames along with cutting losses when the ATR disagrees.
Week of the Year indicatorSimple time indicator showing weeks of the year. Acts to help you define the greater perspective of time on your charts. You can overlay it on the entire chart or use it small and consolidated like I prefer it.
Easiest to configure colors in the script itself and then leave transparency values untouched:
q1w1 = the first week of the first quarter of the year (1st week of january, indicating a new year)
q1= 1-13
q2= 14-26
q3= 27-39
q4=40-53
Hope this helps you, like it helps me.
Best regards,
IMPORTANT NOTE:
Because the scripts asks for the week of the year it doesn't exactly indicate the first day of the quarter of the year. Instead it indicates the year like this: 52 / 4 = 13 W p/Q. Or in other words: 13 weeks per quarter of the year (roughly). Every 5.6 years there's a 53rd week, which will not cause any trouble as long as TV allows the use of the 53rd week, which I think it does.
