الزمن
How To Calculate Symbol's UTC NumberVarious methods to calculate a symbol's timezone offset as a numerical value in hours and decimal minutes. This value may be useful to script authors in certain situations where timezone information needs to be available in a numerical format while using intraday charts. Special thanks to @LucF and TradingView Support for their efficiency advisements!
NOTICE: This is an example script and not meant to be used as an actual strategy. By using this script or any portion thereof, you acknowledge that you have read and understood that this is for research purposes only and I am not responsible for any financial losses you may incur by using this script!

LibraryCheckNthBarLibrary "LibraryCheckNthBar"
TODO: add library description here
canwestart(UTC, prd) this function can be used if current bar is in last Nth bar
Parameters:
UTC : is UTC of the chart
prd : is the length of last Nth bar
Returns: true if the current bar is in N bar
FunctionDaysInMonthLibrary "FunctionDaysInMonth"
Method to find the number of days in a given month of year.
days_in_month(year, month) Method to find the number of days in a given month of year.
Parameters:
year : int, year of month, so we know if year is a leap year or not.
month : int, month number.
Returns: int

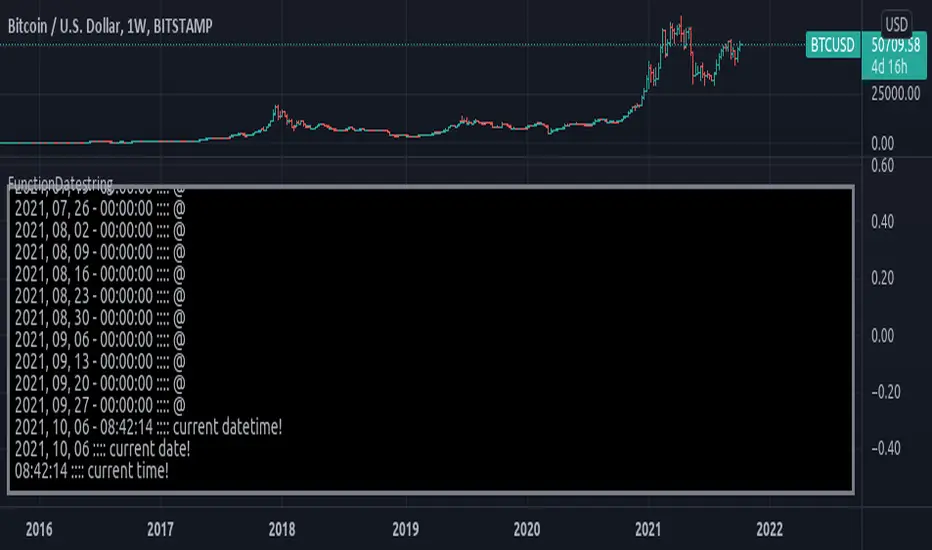
FunctionDatestringLibrary "FunctionDatestring"
Methods to stringify date/time, altho there is already builtin support for it.
datetime(unixtime) a stringified date stamp at specified unix time.
Parameters:
unixtime : int unix timestamp.
Returns: string
date_(unixtime) a stringified date stamp at specified unix time.
Parameters:
unixtime : int unix timestamp.
Returns: string
time_(unixtime) a stringified date stamp at specified unix time.
Parameters:
unixtime : int unix timestamp.
Returns: string
Special Time PeriodWith this indicator, you can choose candles in the period you want on your chart.
How ?
• If your chart is 5 minutes, the duration should be greater than 5 on this indicator.
If you do not do it this way, there will be gaps in the price, it will not give the right result.
• If you want to see it in minutes, you must enter a direct numerical value. For example, to see 2 hours, you must enter the number 120. Because 2 hours is 120 minutes.
Like the warning above, if you want to plot a 2-hour chart with this indicator, a maximum of 1 hour should be selected on your main chart.
• Resolution, eg. '60' - 60 minutes, 'D' - daily, 'W' - weekly, 'M' - monthly, '5D' - 5 days, '12M' - one year, '3M' - one quarter
• For example, if you want to see the 2-day chart, you should have a maximum of 1 day chart open on your home screen and write "2D" to the indicator value.
• You will get much better results if the period on your main chart and the period on this indicator are multiples of each other.
• In the image below, the period on the main chart is 30 minutes, but the period on the indicator is 90
• Click on the facing brackets at the top right of the legend and your chart will enlarge.

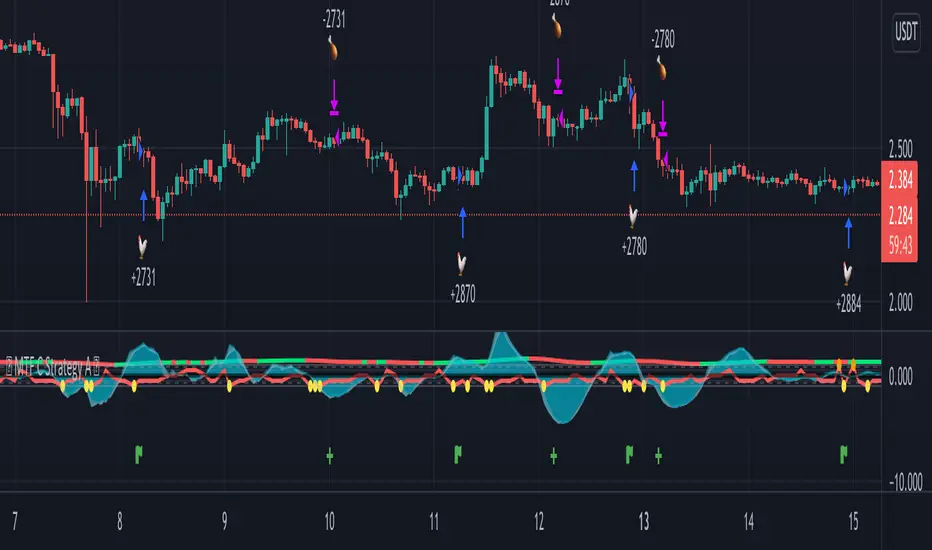
MTF C Strategy A
The Pearson coefficient is a type of correlation coefficient that represents the relationship between two variables that are measured on the same interval or ratio scale. It's a measure of the strength of the association between two continuous variables.
This script allows you to choose one or more sources as a curve, if several sources are chosen, their average is taken into account in an EMA or SMA of your choice. It is possible to have the average of all the curves and to add one or more other curves for an influence on the calculated average.
Then, on the basis of this curve a correlation is calculated from 8 time ranges which give 4 curves, it is on this basis that the conditions of entries in the trade and / or exits are based with the possibility of adding an RSI condition.
For some entries, it is possible to try the symmetrically opposite condition, ie the one that is used in shorts.
To make entry short work, you must activate an exit short option.
However, exit conditions are more flexible than entry conditions because they allow the inverse entry condition used and / or to use statistical indices such as CCI / RSI / ROC / BB as exit condition independently or combined way.
It should be noted that if a condition among those chosen is executed substantially first, it will predominate over the others (same for long / short entries).
In addition, it is possible to choose a stop loss as an exit condition, however, it is not possible to combine the other exit conditions with the stoploss at the same time. Credits to adolgov for the base of the stoploss script part.
You can combine several curves, just as it is possible to combine several types of trade entries / exits.
The strategy uses 100% of equity, it has not been configured in such a way that there is an order pyramid and the closings are done on a total equity basis.
You can configure a daily session interval, a limit of the number of daily trades, a limit of drawdown.
You can add comments for each execution of an opening / closing order respectively to the direction (long or short).
Each step of the configuration has a tip, a button that must be hovered over in order to have the information relating to the configuration.
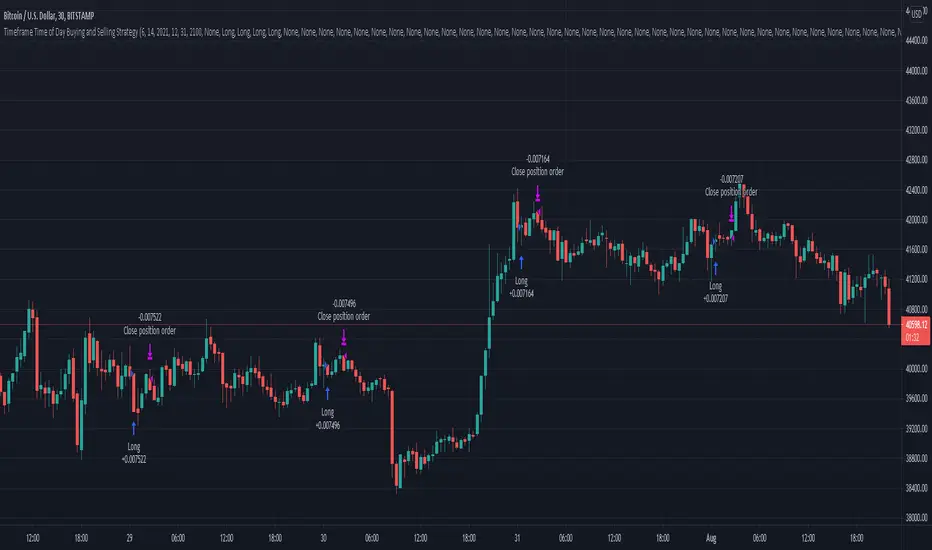
Time of Day and Day of Week Buying and Selling StrategyThis strategy allows you to back test longing or shorting or do nothing during time increments of 30 minutes for various days of the week. For example if you want to see if every Saturday if Bitcoin dropped in value from 1600-7000 UTC, this script will allow you to test that.
Make sure you are in the 30 minute time frame while viewing the performance and trade history.

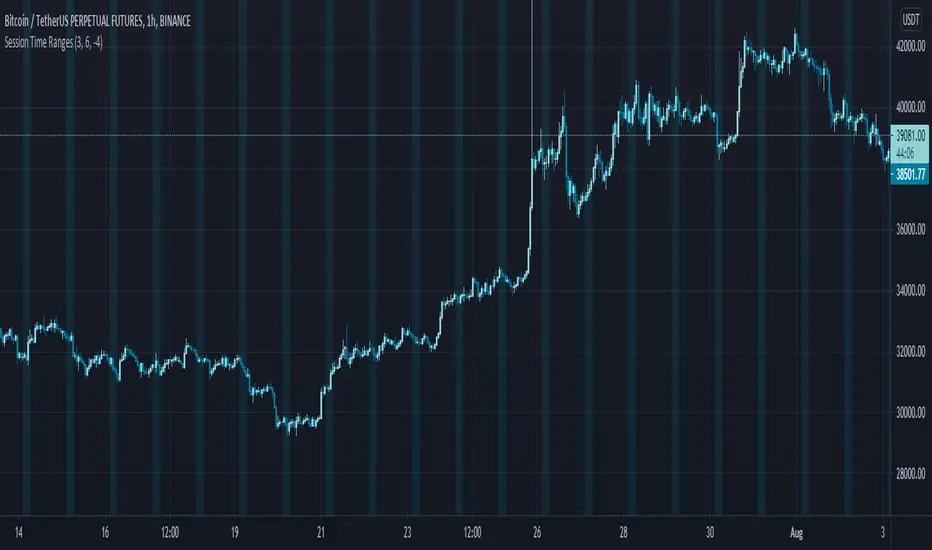
Session Time RangesHave you ever wondered if you are trading at the right time of the day or feel like all the good trades happen when you are sleeping? Well now you can check your theory :)
This Script allows you to highlight a time range on your chart over a 24hour time period. For example 3AM to 6AM
The script has two time variables, set your start time and end time based on a 24 hour clock and set the time zone offset variable to match your charts time zone. For example New York -4 (for utc just enter 0 for no offset )
This is a quick script I put together so hopefully it is error free enjoy :)
Timeframe Time of Day Buying and Selling StrategyThis strategy allows you to back test longing or shorting or do nothing during time increments of 30 minutes. The price trends in one direction every 30 minutes and this strategy allows you to test various 30 minute time frames across a range of dates to capitalize on this.
Make sure you are in the 30 minute time frame while viewing the performance and trade history.
ICT KillzonesThis Script plots the ICT Killzones in the Chart using a new Panel.
It's based on the Major Forex Sessions and this is usually where Key Swing Points occur.
It has a lookback of 20 days for Performance reasons.
CUSTOMISATION
- Time can be modified
- Lines width can be modified
- Lines colours can be modified
DEFAULT
By default the Killzones will be based on NY Time using the following order
- London Open: 02:00 to 05:00
- New York Open: 07:00 to 10:00
- London Close: 10:00 to 12:00

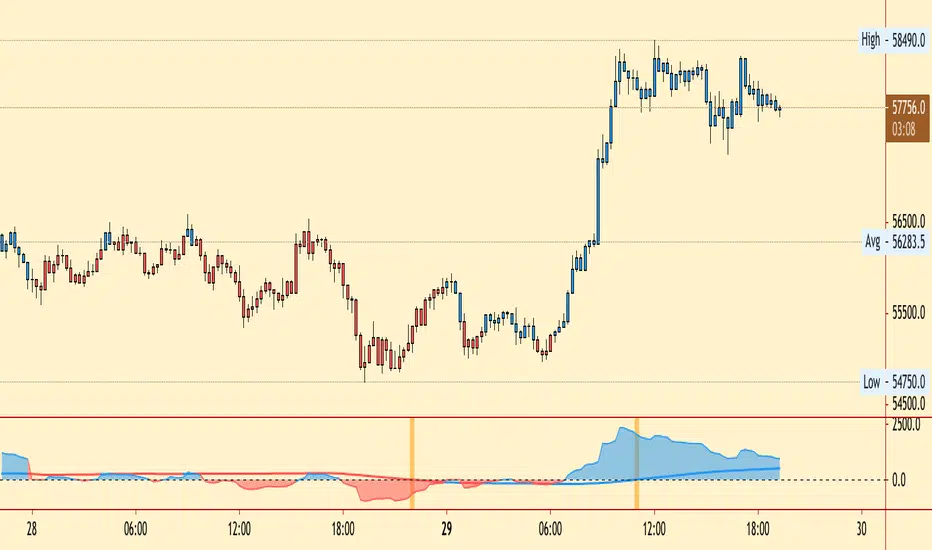
Natural Stochastic Indicator [CC]The Natural Stochastic Indicator was created by Jim Sloman and this is another indicator from his Ocean series which I will eventually publish all of them. Big thanks to @altcoinz and @tmac87 for giving me all of the source code in order to publish Jim's life work. This is another momentum indicator but unlike a traditional stochastic indicator, this one doesn't use overbought and oversold levels. Instead it becomes a sell signal when the indicator starts getting lower and vice versa. This takes the classic approach to a stochastic and combines it with the time factor from Jim's Ocean Theory to create this new indicator. I have included strong buy and sell signals as darker colors and normal buy and sell signals as lighter colors. Buy when the line turns green and sell when it turns red.
Let me know if there are any other indicators you would like to see me publish!

No Trading Zone (NZT)The script highlights Frankfurt's opening range up until New York's close. It is described as No Trading Zone in Gabrielle Fabris's The Price in Time book.
Projections of the Frankfurt range are potential supports and resistances and they are used in trade management & for taking profits in his system.
Full rules are not mine to share. You have to read the book to understand his system and run your own backtest on each pair to find out what management method you will be most comfortable with.

Auto Fib Time Zones and Trend-Based Fib Time by DGTFibonacci time zones, based on the Fibonacci number sequence, are vertical lines that represent potential areas where a swing high, low, or reversal could occur.
Trend-Based Fib Time shows probable price corrections in an existing trend. A useful tool to use in addition to Elliot Wave counting, Fib Time helps to identify how far the wave is likely to travel
Please note, Time zones aren't concerned with price, only time
Disclaimer :
Trading success is all about following your trading strategy and the indicators should fit within your trading strategy, and not to be traded upon solely
The script is for informational and educational purposes only. Use of the script does not constitute professional and/or financial advice. You alone have the sole responsibility of evaluating the script output and risks associated with the use of the script. In exchange for using the script, you agree not to hold dgtrd TradingView user liable for any possible claim for damages arising from any decision you make based on use of the script

Block Time AverageBitcoins network adjusts to maintain an average block time of 10 Minutes per block.
This chart uses the Hashrate and Difficulty to provide the average block time
< 10 Mins = Hashrate is increasing (Green)
> 10 Mins = Hashrate is decreasing (Red)

Planetary Aspects & Transits█ OVERVIEW
Planetary Aspects and Transits are commonly used by Astrology Traders and Gann Traders for various reasons. This script is designed to highlight these planetary aspects and transitions on your chart. You can select your favorite planet -including the sun and the moon- and also select the aspect that you would like to view and this script will highlight it on the chart. The aspects that are included to choose from are ( 0, 30, 45, 60, 72, 90, 120, 135, 144, 150, and 180 degrees ). You can also select the mode of these aspects and transits ( Heliocentric vs Geocentric ).
This script offers two running options :
1. Planet vs aspect : using this option you will be able to select a planet and an aspect and we will find/highlight all the transitions vs all the planets in that aspect.
2. Planet vs Planet : using this option you will be able to select two planet and a single aspect to view on the chart.
█ Future Plans and upgrades to this script may include :
1. Enhanced algorithm for a faster loading/processing script.
2. More future dates plotting.
And more! Feel free to contact me with any feature that you would like to see in this script
█ How to use :
1. Open the settings.
2. Choose the planet/planets, and the aspect.
3. Enable the option.
Give the script a few seconds and you should be set.
This script is coded as an addon to the Gann ToolBox package/scripts.

Time Wolna_2021_iun3[wozdux] Description of the Time_Wolna indicator
The indicator is designed to study the behavior of time. There are many indicators that study just the price, a little less indicators that study the volume of trading and vanishingly few indicators that study time.
This is not an oscillator, it does not have oversold or overbought levels. This indicator has an indefinite beginning and an indefinite end. Its value is not in the absolute values of the indicator, but in relative ones. This indicator calculates the time of price rise and the time of price decline. It clearly shows how long the price rises and how long the price falls.
The initial idea was to use my RSIVol indicator to study the time. Each bar is counted as a unit of time. If the price rises during the period of one bar, then one is added, if the price falls, then one is subtracted. By default, the blue line shows this time movement according to the RsiVol indicator.
The basic RsiVol indicator is shown at the bottom of the diagram. The bill goes along the blue line, which calculates the movement of the volume price. If the blue RSIVol line is above the yellow level, then the blue Time_Wolna time line is colored green. If the blue line in the base RsiVol indicator falls below the lower yellow level, then the blue time line of the Time_Wolna indicator turns red.
The result is a broken line that clearly shows the waves of rising and falling prices. In principle, the time indicator makes it easier to recognize waves.
It is known that time plays an important role in Elliott wave analysis, although in practice this is almost never done. The mention of Elliott is just a lyrical digression.
Time is very difficult to study. This indicator does not give clear buy or sell signals. This is just an analysis tool to help analysts.
In addition to the RsiVol indicator, simply the Rsi from the price and a simple moving average from the price are also used.
So, the settings of this indicator.
"switch Price == close <==> ( High+Low)/2" -- select the base price in all subsequent calculations
"Key EMA=> True=ema(Price); False=ema(Price*Volume)" --The key for switching the moving average from the price or from the volume price.
"T==> EMA(price, T)" --The period for calculating the moving average
" key red==> Yes/No Rsi")--the key turns on or off the RSI line red line
"key green==> Yes/No Orsi") --the key turns on or off the Volume RSI line green line
" key olive==> Yes/No RsiVol200 " -- the key enables or disables the Volumetric RSIVol200 olive line. This is RsiVol minus the 200-period moving average.
"keyVol blue==> Yes/No " - the key enables or disables the base blue line RSIVol
"keyVol blue==> V->tt(RsiVol) ->tt(ema(Price))"—The blue line selection will be calculated as the time from RSIVol or as the time from the moving average EMA.
"keyVol blue==> : 1=Time, 2=Time* price, 3=Time*(Ci-Ck) 4=Time*Volume, 5=Time*price*Volume")- selection for the blue baseline. By default, the time of the price rise or fall is calculated simply. Key=1. But you can investigate the joint influence of time and price and then the key is=2. If we study the combined effect of time and price changes per bar, then the key=3. If we study the joint influence of time and volume, then the key=4. If we study the joint influence of time, price and volume, then the key=5.
"key RsiO red + green==> : 1=Time, 2=Time*Price, 3=Time*(Ci-Ck) 4=Time*Volume, 5=Time*Price*Volume") - - - similar settings for the red green line. By default, the time of the price rise or fall is calculated simply. Key=1. But you can investigate the joint influence of time and price and then the key is=2. If we study the combined effect of time and price changes per bar, then the key=3. If we study the joint influence of time and volume, then the key=4. If we study the joint influence of time, price and volume, then the key=5.
"Key Color – - here you can disable changing the color of the blue line to green or red when the base indicator RsiVol exits above the upper and below the lower levels.
"Level nul ==> * Down Level Rsi - screen configuration in order to raise or lower chart
"Level nul ==> * Down Level ORsi -- beauty setup in order to raise or lower chart
"Level nul ==> * DownLevel RsiVol200 -- beauty setup in order to raise or lower chart
"blue =volume * price" – period for calculation of volumetric rates
"blue => RSIVOL(Volume*price,len) and EMA" – the period for calculating RsiVol
"blue__o1=> ema ( RSIVOL, o1)" – additional smoothing RsiVol
"red=rsi (Price,14)" – the period for calculating Rsi
"red= ema ( RSI ,3)" -- additional smoothing Rsi
"fuchsia__ => RsiVol200 (vp,200)" - the period for calculating RsiVol200
"fuchsia__o2=> ema ( RSIVOL200 , o2)" -- additional smoothing RsiVol200
To study the time between two fixed dates. Setting the start point of the calculation and the end point of the calculation
"Data(0)=Year" – the year of the start date
"Data(0)= Month" – the month of the start date
"Data (0)=Day" the day of the start date
"Data(1)=Year" – the year of the end date.
"Data(1)=Year" – month of the end date.
"Data(1)=Day" -- the day of the end date.
--------русский вариант описания ------
Описание индикатора Time_Wolna
Индикатор призван изучать поведение времени. Есть много индикаторов изучающих просто цену, немного меньше индикаторов изучающих объем торгов и исчезающе мало индикаторов, изучающих время.
Это не осциллятор у него нет уровней перепроданности или перекупленности. Данный индикатор имеет неопределенное начало и неопределенный конец. Ценность его не в абсолютных значениях индикатора, а в относительных. Этот индикатор высчитывает время подъема цены и время снижения цены. Он наглядно показывает сколько времени цена поднимается и сколько времени цена опускается.
Первоначальная идея была использовать мой индикатор RSIVol для изучения времени. Каждый бар считается за единицу времени. Если цена поднимается за период одного бара, то прибавляется единица, если цена опускается, то вычитается единица. По умолчанию голубая линия показывает такое движения времени по индикатору RsiVol.
Внизу на диаграмме показан базовый индикатор RsiVol. Счёт идет по синей линии, которая вычисляет движение объемной цены. Если синяя линия RSIVol находится выше желтого уровня, то голубая линия времени Time_Wolna окрашивается в зеленый цвет. Если синяя линия в базовом индикаторе RsiVol опускается ниже нижнего желтого уровня, то голубая линия времени индикатора Time_Wolna окрашивается в красный цвет.
В результате получается ломанная линия, четко показывающая волны восхождения и снижения цены. В принципе индикатор времени позволяет легче распознавать волны.
Известно, что время играет важную роль в волновом анализе Эллиотта, хотя на практике это почти никогда не делается. Упоминание Эллиотта это просто лирическое отступление.
Время очень трудно изучать. Этот индикатор не дает четких сигналов на покупку или продажу. Это всего лишь инструмент анализа в помощь аналитикам.
Кроме индикатора RsiVol, используются и просто Rsi от цены и простая скользящая средняя от цены.
Итак, настройки данного индикатора.
"switch Price == close <==> ( High+Low)/2" -- выбираем базовую цену во всех последующих вычислениях
"Key EMA=> True=ema(Price); False=ema(Price*Volume)" --Ключ переключения скользящей средней от цены или от объемной цены.
" T==> EMA(price,T)"--Период вычисления скользящей средней
"key red==> Yes/No Rsi")--ключ включает или выключает линию RSI красная линия
"key green==> Yes/No Orsi") --ключ включает или выключает линию Объемной RSI зеленая линия
"key olive==> Yes/No RsiVol200" -- ключ включает или выключает линию Объемной RSIVol200 оливковая линия. Это RsiVol минус 200-периодная скользящая средняя.
"keyVol blue==> Yes/No " – ключ включает или выключает базовую голубую линию RSIVol
"keyVol blue==> V->tt(RsiVol) ->tt(ema(Price))"—выбор голубая линия будет вычисляться как время от RSIVol или как время от скользящей средней EMA.
"keyVol blue==> : 1=Time, 2=Time* price, 3=Time*(Ci-Ck) 4=Time*Volume, 5=Time*price*Volume")—выбор для голубой базовой линии. По умолчанию вычисляется просто время подъема или опускания цены. Ключ=1. Но можно исследовать совместное влияние времени и цены и тогда ключ=2. Если изучаем совместное влияние времени и изменения цены за один бар, то ключ=3. Если изучаем совместное влияние времени и объема, то ключ=4. Если изучаем совместное влияние времени, цены и объема, то ключ=5.
"key RsiO red + green==> : 1=Time, 2=Time*Price, 3=Time*(Ci-Ck) 4=Time*Volume, 5=Time*Price*Volume") ---аналогичные настройки для красной зеленой линии. По умолчанию вычисляется просто время подъема или опускания цены. Ключ=1. Но можно исследовать совместное влияние времени и цены и тогда ключ=2. Если изучаем совместное влияние времени и изменения цены за один бар, то ключ=3. Если изучаем совместное влияние времени и объема, то ключ=4. Если изучаем совместное влияние времени, цены и объема, то ключ=5.
"Key Color" – здесь можно отключить изменение цвета голубой линии на зеленый или красный в моменты выхода базового индикатора RsiVol выше верхнего и ниже нижнего уровней.
"Level nul ==> * Down Level Rsi - косметическая настройка для того, чтобы поднять или опустить график
"Level nul ==> * Down Level ORsi -- косметическая настройка для того, чтобы поднять или опустить график
"Level nul ==> * DownLevel RsiVol200 -- косметическая настройка для того, чтобы поднять или опустить график
" blue =>volume * price" – период для вычисления объемной цены
" blue => RSIVOL(Volume*price,len) and EMA" – период для вычисления RsiVol
"blue__o1=> ema ( RSIVOL, o1)" – дополнительное сглаживание RsiVol
" red=rsi (Price,14)" – период для вычисления Rsi
" red= ema ( RSI ,3)" -- дополнительное сглаживание Rsi
"fuchsia__ => RsiVol200 (vp,200)" -- период для вычисления RsiVol200
"fuchsia__o2=> ema ( RSIVOL200 , o2)" -- дополнительное сглаживание RsiVol200
Для исследования времени между двумя фиксированными датами. Задаем начальную точку вычисления и конечную точку вычисления
"Data(0)=Year" – год начальной даты
"Data(0)= Month" – месяц начальной даты
"Data(0)=Day" день начальной даты
"Data(1)=Year" – год конечной даты.
"Data(1)=Year" – месяц конечной даты.
"Data(1)=Day" -- день конечной даты.


Time-Period Coloring Instagram LuckyNickVAFor Coloring Your Candles To A Specific Time Period. Used To Exploit Perspective Of Market Structure For Different Time Periods.

Hourly Time SeparatorI made this indicator mostly for personal use but there may be few others who would like to have vertical lines occur every day in specific our on chart.
I am no developer and all I did was copy @allanster's work and delete few lines and duplicate few others. Code will be open for anyone to edit since it was not my code to start with after all. Hopefully this one helps to someone.
Flunki T-WAP minus MA Oscillator
Yo,
Possible the last of these for now, and mostly for the sake of completeness..
This is..
Another simple oscillator that show the difference in price between a selectable timeframe TWAP and a Moving Average of that TWAP
This is shown as a histogram.
Use numeric TWAP values for minutes (30, 60 ,720 whatever) and D, 3D, W, M for higher values
There is also a global timeframe which will set the timeframe for a global alternate timeframe (instead of current chart resolution)
On top of that is a Moving Average of the histogram value, shown as a blue / red line with an option to highlight this MA crossing zero, and an option to colour bars to this line.
The major difference between this Oscillator, and the other script (Flunki VWAP minus MA Oscillator)
(I treid to insert a link but it's invisible so it would seem, anyway.. )
is that VWAP is usually calculated daily, so there is a sharp move upon the daily close, as VWAP starts a new day. Using TWAP this does not occur, so gives smoother transitions ; also the timeframe for TWAP is selectable for additional wap fun.
Simple idea : Code open
Enjoy !

Flunki TWAP minus MTF TWAP Oscillator
Heys,
Herewith a another simple oscillator that show the difference in price between a selectable timeframe TWAP and another alternative selectable timeframe TWAP
This is shown as a histogram.
Use numeric TWAP values for minutes (30, 60 ,720 whatever) and D, 3D, W, M for higher values
There is also a global timeframe which will set the timeframe for a global alternate timeframe (instead of current chart resolution)
On top of that is a Moving Average of the histogram value, shown as a blue / red line with an option to highlight this MA crossing zero, and an option to colour bars to this line.
Simple idea : Code open
Enjoy !
[@bartbtc] Deribit Quarterly and Monthly expiry datesAs options expiries seem to have a larger impact on BTC price, I've made a simple script to highlight them on the chart.
Let me know if there's any other features you'd like - cheers.