MarketSurge EPS Line [tradeviZion]MarketSurge EPS Line
EPS trend line overlay for TradingView charts, inspired by the IBD MarketSurge (formerly MarketSmith) EPS line style.
Comparison: Left side shows IBD MarketSurge EPS line as reference. Right side shows this TradingView script producing similar output with interactive tooltips. The left side image is for reference only to demonstrate similarity - it is not part of the TradingView script.
Features:
Displays EPS trend line on price charts
Uses 4-quarter earnings moving average
Shows earnings momentum over time
Works with actual, estimated, or standardized earnings data
Customizable line color and width
Interactive tooltips with detailed earnings information
Custom symbol analysis support
How to Use:
Add script to chart
EPS line appears automatically
Adjust color and width in settings if needed
Hover over line for earnings details
Settings Explained:
Display Settings:
Show EPS Line: Toggle to show or hide the EPS trend line
EPS Line Color: Choose the color for the EPS trend line and labels
EPS Line Width: Adjust the thickness of the EPS trend line (1-5 pixels)
Symbol Settings:
By default, the indicator analyzes the EPS data for the symbol currently displayed on your chart. The Custom Symbol feature allows you to:
Analyze EPS data for a different symbol without changing your chart
Compare earnings trends of related stocks or competitors
View EPS data for one symbol while analyzing price action of another
To use Custom Symbol:
Enable "Use Custom Symbol" checkbox
Click on "Custom Symbol" field to open TradingView's symbol picker
Search and select the symbol you want to analyze
The indicator will fetch and display EPS data for the selected symbol
Note: The chart will still show price action for your current symbol, but the EPS line will reflect the custom symbol's earnings data.
Data Settings:
EPS Field: Choose which earnings data source to use:
Actual Earnings: Reported earnings from company financial statements (default). Use this to analyze historical performance based on what companies actually reported.
Estimated Earnings: Analyst consensus forecasts for future quarters. Use this to see what analysts expect and compare expectations with actual results.
Standardized Earnings: Earnings adjusted for comparability across companies. Use this when comparing multiple stocks as it normalizes accounting differences.
Display Scale:
For the indicator to display correctly on the existing chart, it uses its own axis (right scale) by default. However, you can change this, but the view will not look the same. The right scale is recommended for optimal visibility as it allows the EPS line to be clearly visible alongside price action without compression.
Example: EPS line on separate right scale (recommended) - hover over labels to view detailed earnings tooltips
Example: EPS line pinned to Scale A (not recommended - appears as straight line due to small EPS range compared to price)
Example: EPS line displayed in separate pane below price chart
Methodology Credits:
This indicator implements the EPS line visualization methodology developed by Investor's Business Daily (IBD) for their MarketSurge platform (formerly known as MarketSmith). The EPS line concept helps visualize earnings momentum alongside price action, providing a fundamental overlay for technical analysis.
Technical Details:
Designed for daily, weekly, and monthly timeframes
Minimum 4 quarters of earnings data required
Uses TradingView's built-in earnings data
Automatically handles missing or invalid data
This indicator helps you visualize earnings trends alongside price action, providing a fundamental overlay for your technical analysis.
Tradevizion

Larry Williams COT Analysis Enhanced [tradeviZion]Larry Williams COT Analysis Enhanced - Complete Description
📖 Introduction
Welcome to the Larry Williams COT Analysis Enhanced indicator. This comprehensive description explains every setting, feature, and capability of this advanced Commitments of Traders (COT) analysis tool.
This indicator implements Larry Williams' professional COT analysis methodology with enhanced features including statistical validation, combination analysis, and adaptive signal generation.
---
🎯 Quick Start
Add the indicator to your chart
The script will automatically detect your symbol's CFTC code and asset type
Review the main COT analysis table (displayed by default)
Customize settings based on your trading style
Review the Trading Edge & Signals section for signal information
---
⚙️ Settings Groups Overview
The indicator is organized into 9 logical groups of settings:
1. Core COT Settings - Data source and report configuration
2. Analysis Parameters - Calculation methods and lookback periods
3. Signal Generation - Buy/sell signals and trend weighting
4. Plot Display Settings - Visual customization of chart lines
5. Smoothing Settings - Data smoothing options
6. COT Proximity Index Settings - Price-based proxy indicator configuration
7. Common Table Settings - Shared table appearance
8. Main Table Display Settings - Main analysis table customization
9. Historical Comparison Settings - Historical data table configuration
---
📋 Group 1: Core COT Settings
COT Report Type
Options: Legacy | Disaggregated | Financial
What it is: Selects the type of COT report data to analyze.
Legacy - Traditional COT report format. Recommended for most users. Uses "Commercial Positions" and "Noncommercial Positions" metrics. Shows Commercial, Non-Commercial, and Small Speculator positions in the classic format.
Commercials: "Commercial Positions"
Speculators: "Noncommercial Positions"
Small Specs: "Nonreportable Positions"
Disaggregated - Separates managed money from other speculators. Uses different metrics than Legacy format.
Commercials: "Producer Merchant Positions"
Speculators: "Managed Money Positions"
Small Specs: "Nonreportable Positions"
Important: When using Disaggregated report type, the table will still show "Non-Comm" as the label, but the data displayed is actually " Managed Money Positions " (hedge funds and CTAs). The underlying data changes based on your report type selection, even though the table label remains "Non-Comm" for consistency.
Where you'll see this data:
📊 Current Positions section - The "Non-Comm" row shows Managed Money long, short, and net positions
📊 Open Interest Analysis section - "Non-Comm" net changes reflect Managed Money position changes
📈 Analysis section - "Non-Comm" percentile and LW Index values are calculated from Managed Money positions
Chart plots - The blue "Non-Commercial" line shows Managed Money net positions
Useful when you want to analyze hedge funds (Managed Money) separately from other large speculators. The "Commercial" row will show " Producer Merchant Positions " instead of general "Commercial Positions".
Financial - Designed for financial instruments (currencies, bonds, stock indices). Uses financial-specific metrics.
Commercials: "Dealer Positions"
Speculators: "Leveraged Funds Positions"
Small Specs: "Nonreportable Positions"
Important: When using Financial report type, the table will still show "Commercial" and "Non-Comm" as labels, but the data displayed is actually " Dealer Positions " (commercials) and " Leveraged Funds Positions " (speculators). The underlying data changes based on your report type selection.
Where you'll see this data:
📊 Current Positions section - "Commercial" row shows Dealer long/short/net, "Non-Comm" row shows Leveraged Funds positions
📊 Open Interest Analysis section - Net changes reflect Dealer and Leveraged Funds position changes
📈 Analysis section - Percentile and LW Index values are calculated from Dealer and Leveraged Funds positions
Chart plots - Lines show Dealer and Leveraged Funds net positions
Use this for currency futures, bond futures, and stock index futures.
Trading Use: Most traders use Legacy as it provides the most comprehensive view and works with all asset types. Switch to Disaggregated if you want to analyze managed money positions separately. Use Financial specifically for financial instruments (currencies, bonds, stock indices).
---
Include Options Data
Default: Off (false)
What it is: Toggles whether to include options positions in addition to futures positions.
Trading Use: Larry Williams observed no significant difference in COT analysis when including options data. Keep this disabled unless you specifically need options data. Most traders leave it off for cleaner analysis.
---
Auto-detect CFTC Code
Default: On (true)
What it is: Automatically finds the correct CFTC code for your symbol.
Trading Use: Keep this enabled unless you need a specific CFTC code. The script automatically detects codes for:
- Currency futures: CME:6E1! , CME:6B1! , CME:6J1!
- Stock index futures: CME_MINI:ES1! , CBOT_MINI:YM1! , CME_MINI:NQ1!
- Commodities: NYMEX:CL1! , COMEX:GC1! , CBOT:ZC1!
- And many more
Only disable if you're analyzing a symbol that requires a specific CFTC code not in the auto-detection database.
---
Manual CFTC Code
Default: Empty
What it is: Enter a specific CFTC code manually (e.g. for E-mini S&P 500). "13874+"
Trading Use: Only used when Auto-detect CFTC Code is disabled. Most users never need this setting.
---
📊 Group 2: Analysis Parameters
Display Mode
Options: COT Report | COT Index | COT Proximity Index
What it is: Controls what data is displayed on the chart and in the table.
COT Report - Shows raw position data (Long, Short, Net positions) plus analysis. Best for detailed analysis. Displays Commercial, Non-Commercial, Small Speculator, and Open Interest lines.
COT Index - Shows index values based on your selected Analysis Method (Percentile or LW Index). Best for quick sentiment analysis. Displays index lines for Commercial, Non-Commercial, Small Speculator, and Open Interest. Percentile can exceed 0-100% for extremes, LW Index stays 0-100%.
Percentile can exceed 0-100% for extremes
LW Index stays 0-100%
COT Proximity Index - Shows a price-based proxy indicator. Useful when COT data is delayed or unavailable. Calculates sentiment based on price action patterns.
Trading Use:
- Use COT Report for comprehensive analysis
- Use COT Index when you want to focus on extreme sentiment levels
- Use COT Proximity Index as a backup when COT data is delayed or unavailable.
---
Analysis Method
Options: Percentile | LW Index
What it is: Selects the calculation method for position rankings.
Percentile - Professional approach. Excludes current bar from range calculation. Can show extremes (>100% or <0%) when today's value breaks historical range. More sensitive to recent extremes.
LW Index - Original Larry Williams method. Includes current bar in range, always 0-100%. Traditional approach.
Trading Use:
Percentile - Better for catching new extremes and recent market shifts
LW Index - Better for traditional Larry Williams analysis
Most traders prefer Percentile for its ability to show when positions break historical ranges.
---
Lookback Mode
Options: Auto | Manual
What it is: Controls how the historical lookback period is determined.
Auto - Automatically sets lookback period based on detected asset type
Manual - Choose your own lookback period
Trading Use: Use Auto unless you have a specific reason to customize. The script automatically sets optimal periods:
Currencies: 26 weeks
Metals: 13 weeks
Grains: 26 weeks
Stocks/Indices: 13 weeks
Bonds: 52 weeks
Energies: 13 weeks
---
Manual Lookback Period
Options: 1 Month | 3 Months | 6 Months | 1 Year | 3 Years | Asset-specific presets | Manual
What it is: How far back to look for historical comparison. Only used when Lookback Mode is set to Manual .
---
Manual Lookback Weeks
Default: 18 weeks | Range: 1-500
What it is: Exact number of weeks to look back. Only used when Manual Lookback Period is set to Manual .
Trading Use: Set a custom period if you want precise control. 18 weeks = approximately one quarter (3 months).
---
🎯 Group 3: Signal Generation
Show Signal Arrows
Default: Off (false)
What it is: Displays buy/sell arrows on the chart when extreme positions are detected.
Trading Use: Enable to get visual alerts for signals. Signals use strict multi-factor conditions requiring:
- Commercial extreme positioning
- Speculator positioning alignment
- Open Interest confirmation
- Trend consistency
- And more...
---
Show Background Colors
Default: Off (false)
What it is: Colors the chart background during extreme market conditions.
Trading Use: Enable for visual market state awareness:
- Strong signals = Darker background colors
- Moderate signals = Lighter background colors
- Green background = Bullish extreme
- Red background = Bearish extreme
Useful for quick visual assessment of market conditions.
---
Use Price Trend Weighting
Default: On (true)
What it is: Weights signals based on price trend alignment.
How it works:
Uptrend + Commercials long = Stronger bullish signal
Downtrend + Commercials short = Stronger bearish signal
Counter-trend signals = Harder to trigger (more conservative)
Trading Use: Keep enabled for more reliable signals. Commercials aligned with price trend are historically more accurate.
This feature makes signals easier to trigger when commercials align with the trend and harder when they're counter-trend.
---
Trend MA Period
Default: 40 | Range: 1-200
What it is: Moving average period for price trend detection.
How it works:
Price above MA with the MA rising = Uptrend
Price below MA with the MA declining = Downtrend
---
📈 Group 4: Plot Display Settings
Commercial Line Settings
Default Color: Red | Default Width: 2
What it is: Controls the Commercial traders net position line appearance.
Trading Use: Commercials are considered "smart money." Watch for:
Extreme long positions (high index ≥74%) = Heavy buyers = BULLISH signal
Extreme short positions (low index ≤26%) = Heavy sellers = BEARISH signal
Red is traditional for commercials. When Commercials are heavy buyers (high index), it's a bullish signal. When they're heavy sellers (low index), it's a bearish signal.
---
Non-Commercial Line Settings
Default Color: Blue | Default Width: 2
What it is: Controls the Non-Commercial (Large Speculators) net position line appearance.
Trading Use: Large speculators are often trend-followers. Watch for:
Extreme long = Potential top (contrarian sell signal)
Extreme short = Potential bottom (contrarian buy signal)
They're often wrong at extremes - use as contrarian indicator.
---
Small Speculator Line Settings
Default Color: Green | Default Width: 2
What it is: Controls the Small Speculators net position line appearance.
Trading Use: Small specs are typically wrong at extremes:
Extreme long = Potential top (sell signal)
Extreme short = Potential bottom (buy signal)
Exception: In Meats markets, small specs are accurate (like commercials).
---
Small Speculator Multiplier
Default: 5.0x | Range: 0.1-20.0
What it is: Multiplies Small Speculator PLOTTED values for visual comparison.
Important: This only affects the visual plot line, NOT calculations or table values. Raw values used in all calculations remain unchanged.
Trading Use: Small spec positions are often much smaller than commercials. Use multiplier (default 5.0x) to scale the line for easier visual comparison.
---
Open Interest Line Settings
Default Color: Black | Default Width: 1
What it is: Controls the Open Interest line appearance.
Trading Use: Open Interest shows market participation:
Rising OI = New money entering (confirms trend)
Falling OI = Money leaving (potential reversal)
Watch WHO is driving OI changes - This is critical
---
Scale Open Interest
Default: On (true)
What it is: Scales Open Interest values to fit chart range.
Important: Only affects plotted lines, not table values. Scaling changes based on lookback period:
- Shorter lookback = More compressed range
- Longer lookback = Wider range
Trading Use: Keep enabled for better visual comparison. Disable if you want absolute OI values.
---
Show Reference Lines
Default: Off (false)
What it is: Toggles the display of horizontal reference lines at 0%, 50%, and 100% levels on the chart.
What it shows:
Zero Line (0%) - Dotted gray line at 0% level
Midline (50%) - Solid gray line at 50% level
100 Line (100%) - Dotted gray line at 100% level
Trading Use: Enable when you want visual reference points for:
0% = Extreme bearish positioning
50% = Neutral/middle range
100% = Extreme bullish positioning
---
🔄 Group 5: Smoothing Settings
Smoothing Method
Options: None | SMA | EMA | WMA | RMA
What it is: Selects the moving average type for smoothing data.
None - Use raw data (no smoothing)
SMA - Simple Moving Average (equal weight to all periods)
EMA - Exponential Moving Average (more weight to recent data)
WMA - Weighted Moving Average (linear weighting)
RMA - Relative Moving Average (Wilder's smoothing)
Trading Use:
None - Best for catching extremes quickly
SMA - Most common, balanced smoothing
EMA - More responsive to recent changes
WMA/RMA - Advanced smoothing methods
Smoothing reduces noise but may delay signal detection. Use None for most responsive signals.
---
Smoothing Period
Default: 4 | Range: 2-20
What it is: Number of periods for the moving average smoothing.
Trading Use:
Shorter periods (2-5) = Less smoothing, more responsive
Longer periods (10-20) = More smoothing, less noise
Default 4 = Good balance
Only used when Smoothing Method is not None.
---
Smooth COT Report Plots
Default: Off (false)
What it is: Applies smoothing to COT Report plotted lines (Commercial, Non-Commercial, Small Speculators, Open Interest).
Trading Use: Enable if you want smoother chart lines. Note: Smoothing affects visual display but calculations use raw data unless Smooth COT Index Plots is also enabled.
---
Smooth COT Index Plots
Default: Off (false)
What it is: Applies smoothing to COT Index plotted lines.
Trading Use: Enable if you want smoother index lines. Important : When enabled, smoothed values are used in table displays and signal calculations. This affects the "user-facing" index values shown in the table and used for signals.
---
📊 Group 6: COT Proximity Index Settings
Proximity Length Mode
Options: Auto | Manual
What it is: Controls how the proximity index calculation period is determined.
Auto - Calculates length based on ZigZag patterns (dynamic)
Manual - Uses fixed length setting
Trading Use: Use Auto for adaptive calculation. Use Manual if you want consistent period regardless of market conditions.
---
Manual Proximity Length
Default: 8 bars | Range: 1+
What it is: Fixed number of bars for COT Proximity Index calculation. Only used when Proximity Length Mode is Manual .
Trading Use: Set based on your timeframe. 8 bars works well for weekly chart.
---
Heavy Buyers Level
Default: 74% | Range: 50-100
What it is: COT Index level above which commercials are considered heavy buyers (extreme long positioning).
Trading Use: This threshold is used for:
- Signal generation
- Market state calculation
- Entry level recommendations
Default 74% means commercials are "heavy buyers" when LW Index ≥ 74%.
---
Heavy Sellers Level
Default: 26% | Range: 0-50
What it is: COT Index level below which commercials are considered heavy sellers (extreme short positioning).
Trading Use: This threshold is used for:
- Signal generation
- Market state calculation
- Entry level recommendations
Default 26% means commercials are "heavy sellers" when LW Index ≤ 26%.
---
ZigZag Deviation
Default: 1.0% | Range: 1-100.0
What it is: Minimum price change (%) required to create a new ZigZag pivot point.
Trading Use:
Smaller values = More sensitive, more pivots
Larger values = Less sensitive, fewer pivots
Used for Auto proximity length calculation.
---
ZigZag Depth
Default: 1 | Range: 1+
What it is: Minimum number of bars between pivot points.
Trading Use: Higher values filter out minor pivots. Default 1 captures all significant pivots.
---
Extend ZigZag to Last Bar
Default: Off (false)
What it is: Draws ZigZag lines to the current bar (may show incomplete patterns).
Trading Use: Enable to see current ZigZag pattern, but be aware it may change as new bars form.
---
Show ZigZag Lines
Default: Off (false)
What it is: Displays ZigZag pivot lines on the chart for visual reference.
Trading Use: Enable to see the ZigZag pattern used for proximity index calculation. Useful for understanding how Auto mode works.
---
🎨 Group 7: Common Table Settings
Color Theme
Options: Dark | Light | Midnight Blue | Ocean Blue | Forest Green | Amber Gold | Slate Gray
What it is: Color scheme for both main and historical comparison tables.
Trading Use: Choose based on your preference:
Dark/Light - Classic themes
Midnight Blue - Professional dark theme
Ocean Blue - Calming blue tones
Forest Green - Natural green theme
Amber Gold - Warm gold tones
Slate Gray - Modern gray theme
Theme applies to both tables simultaneously for consistency.
---
📋 Group 8: Main Table Display Settings
Show COT Table
Default: On (true)
What it is: Toggles the main COT analysis table display.
Trading Use: Disable only if you want to use chart plots only. Most traders keep this enabled for comprehensive analysis.
---
Table Mode
Options: Full | Compact
What it is: Controls the detail level of the main table.
Full - Complete analysis table with all sections
Compact - Essential info only (mobile-friendly)
Trading Use:
Full - Desktop trading, comprehensive analysis
Compact - Mobile trading, quick reference
See "Table Modes Explained" section below for details.
---
Table Position
Options: Top Right | Top Left | Bottom Right | Bottom Left | Middle Right | Middle Left
What it is: Position of the main COT analysis table on the chart.
Trading Use: Choose based on your chart layout and preference. Top Right is default and works well for most traders.
---
Table Text Size
Options: Tiny | Small | Normal | Large
What it is: Size of text in the COT analysis table.
---
Section Visibility Controls
All default: On (true)
What it is: Individual toggles to show/hide specific table sections.
⚙️ Settings - Report Type, CFTC Code, Options setting
📊 Current Positions - Long, Short, Net positions for each group
📈 Analysis - LW Index, Percentile, Market State
🎯 Trading Edge & Signals - Current Signal, Entry Level, Best Setup
💡 Trading Tips - Context-aware trading insights
📈 Trend Analysis - Trend Direction, Strength, Cum Change, ROC, vs MA
🔄 Market Maker Activity - Spreading, Activity Level, Trading Edge
Trading Use: Customize your table to show only what you need:
Quick traders - Show only Trading Edge & Signals
Detailed analysis - Show all sections
Mobile users - Hide less critical sections
Each section can be toggled independently for maximum customization.
---
📊 Group 9: Historical Comparison Settings
Show Historical Comparisons
Default: On (true)
What it is: Toggles the historical comparison table display.
Trading Use: This table shows how current positions rank over different time periods (1M, 3M, 6M, 1Y, 3Y, All Time). Very useful for context.
---
Historical Table Mode
Options: Full | Compact
What it is: Controls the detail level of the historical comparison table.
Full - Complete historical comparison with all time periods (1M, 3M, 6M, 1Y, 3Y, All Time) and all COT groups
Compact - Essential periods only (1M, 3M, 6M, 1Y, All Time) showing Commercial % only
Trading Use:
- Full - Comprehensive historical analysis
- Compact - Quick reference, mobile-friendly
---
Table Position (Historical)
Options: Top Right | Top Left | Bottom Right | Bottom Left
What it is: Position of the historical comparison table on the chart.
---
Table Text Size (Historical)
Options: Tiny | Small | Normal | Large
What it is: Size of text in the historical comparison table.
---
Trading Days
Options: Weekdays | 24/7
What it is: How to calculate time periods for historical comparisons.
Weekdays - Calculate based on trading days only (5 days/week)
24/7 - Include all calendar days (7 days/week), Use for 24/7 markets like cryptocurrencies
Used for both main COT data and COT Proximity Index historical comparisons.
---
📊 Table Modes Explained
Full Mode - Main Table
The Full mode displays all available sections:
⚙️ Settings - Report type, CFTC code, options setting
📊 Current Positions - Long, Short, Net for Commercial, Non-Commercial, Small Speculators
📊 Open Interest Analysis - OI value, change, who's driving changes, concentration
📈 Analysis - Percentile ranks, LW Index values, Market State
🎯 Trading Edge & Signals - Current Signal, Entry Level, What to Watch, Best Setup
💡 Trading Tips - Context-aware insights
📈 Trend Analysis - Trend Direction, Strength, Consistency, Cumulative Change, ROC %, vs MA
🔄 Market Maker Activity - Spreading %, Activity Level, Interpretation, Trading Edge
Best for: Desktop trading, comprehensive analysis, detailed market assessment
---
📋 Understanding Each Table Section
This section explains what each part of the main table means and how to use it for trading decisions.
⚙️ Settings Section
Report Type - Shows which COT report format you're using (Legacy, Disaggregated, or Financial). Verify this matches your asset type.
Options - Indicates if options data is included ("Included") or excluded ("Excluded"). Most traders exclude options for cleaner analysis.
CFTC Code - Unique identifier for your futures contract. Shows "Auto" when automatically detected, or displays the manual code if set.
Trading Use: Always verify your CFTC code is correct. Wrong code = wrong data = wrong signals.
---
📊 Current Positions Section
Shows the actual position sizes for each trader group.
What Each Column Means:
Long - Total long contracts held by this group
Short - Total short contracts held by this group
Net - Net position (Long - Short). This is the key number.
How to Interpret:
Commercial Net Position:
- Negative (Net Short) = Commercials expect prices to fall
- Positive (Net Long) = Commercials expect prices to rise
- Commercials are "smart money" - their positioning often precedes major moves
Non-Commercial Net Position:
- Positive (Net Long) = Large speculators bullish
- Negative (Net Short) = Large speculators bearish
- Often trend-followers, can be caught at extremes
Small Spec Net Position:
- Positive (Net Long) = Small traders bullish
- Negative (Net Short) = Small traders bearish
- Often contrarian indicator - wrong at extremes
Trading Edge: Watch for extremes in Commercial net positions. When Commercials are heavy buyers (high index ≥74%), it's a bullish signal. When they're heavy sellers (low index ≤26%), it's a bearish signal.
---
📊 Open Interest Analysis Section
Open Interest - Total number of outstanding contracts. Shows market participation level.
Change - Week-over-week change in Open Interest. Rising OI = new money entering, Falling OI = money leaving.
Net Changes - Shows which group is driving Open Interest changes. This is Larry Williams' most important insight.
🎯 Critical Question: Who is Driving OI Changes?
EXTREMELY BULLISH SIGNAL (Very Rare - Pay Close Attention):
- Commercials driving OI increase + Commercials raising positions + Uptrend market
- Meaning: Smart money (commercials) accumulating long positions while market is rising
- Action: Extremely bullish - very rare setup, pay close attention to this signal
- This is the strongest bullish signal possible
BULLISH SIGNAL (Strong Buy):
- Commercials driving OI increase + Commercials net long
- Meaning: Smart money accumulating long positions
- Action: Strong bullish setup
BEARISH SIGNAL (Strong Sell - Market Topping):
- Commercials exiting + OI increasing due to Small Specs + Non-Commercials
- Meaning: Smart money leaving while speculative money entering
- Action: Market top forming - most likely scenario for bearish reversal
- This indicates speculative excess and potential market top
BEARISH SIGNAL (Speculative Excess):
- Small Specs + Non-Commercials driving OI increase + They are net long
- Meaning: Speculative excess, "dumb money" driving market
- Action: Bearish reversal likely
Trading Use:
- Rising OI = New money entering (confirms trend)
- Falling OI = Money leaving (potential reversal)
- Watch WHO is driving OI changes - This is critical
- When Commercials drive OI increases while raising positions in an uptrend = Extremely bullish and very rare - pay attention
- When Commercials exit while OI increases due to Small Specs and Non-Commercials = Market topping signal
Concentration - Shows how much of the market is controlled by the largest traders:
- Top 4 - Four largest traders' share of total OI
- Top 8 - Eight largest traders' share of total OI
Trading Use: High concentration (>30%) means fewer dominant players, potential for volatility. Low concentration means more distributed positions, healthier market.
---
📈 Analysis Section
Proximity Index (when in COT Proximity Index mode):
- Value: Current proximity index reading (0-100%)
- Length: Number of bars used in calculation
- Status: Heavy Buyers, Heavy Sellers, or Neutral
Analysis Method - Shows whether you're using Percentile or LW Index calculation.
Small Spec Mode - Shows how Small Speculators are interpreted:
- Contrarian (Traditional) - Small specs are wrong at extremes (default)
- Accurate (Meats) - Small specs are accurate like commercials (for Meats markets)
Market State - Overall market sentiment assessment:
- STRONG BULLISH - Multiple factors aligned bullish, strong buy signal
- MODERATE BULLISH - Several bullish factors, moderate buy signal
- LEANING BULLISH - Slight bullish bias, watch for confirmation
- NEUTRAL - Mixed signals, trade with existing trend
- LEANING BEARISH - Slight bearish bias, watch for confirmation
- MODERATE BEARISH - Several bearish factors, moderate sell signal
- STRONG BEARISH - Multiple factors aligned bearish, strong sell signal
Trading Use: Start your analysis here. Market State gives you the overall picture before diving into details.
---
🎯 Trading Edge & Signals Section
Current Signal - Shows which combination is active based on current positioning extremes and its expected accuracy percentage:
- Comm+Spec+OI - All three groups at extremes (highest accuracy)
- Comm+Spec - Commercials and specs at extremes (opposite extremes - Larry Williams' favorite)
- Comm+OI - Commercials and Open Interest at extremes (smart money + participation)
- Commercials - Only Commercials at extreme (smart money indicator)
- Wait - No extremes detected, wait for setup
Entry - Trading signal based on Commercial positioning:
- LONG - Commercials are heavy buyers (≥Heavy Buyers Level), bullish signal
- SHORT - Commercials are heavy sellers (≤Heavy Sellers Level), bearish signal
- Wait - Commercials neutral, no clear signal
Best Setup - Shows the historically highest accuracy combination found in the data:
- Comm+Spec+SmallSpec+OI - All four groups aligned (strongest signal)
- Comm+Spec+OI (All) - Commercials + Speculators + Open Interest aligned
- Comm+Spec+SmallSpec - Commercials + Speculators + Small Specs aligned
- Comm+Spec (Both) - Commercials + Speculators (opposite extremes - Larry Williams' favorite)
- Comm+OI (Both) - Commercials + Open Interest (participation confirms smart money)
- Comm+SmallSpec - Commercials + Small Specs (especially strong in Meats markets)
- Commercials Alone - Commercial positioning only (baseline - smart money indicator)
Trading Use: This is your action center . Focus on Entry signals when Market State confirms. Higher accuracy setups (shown in Best Setup) are more reliable.
---
💡 Trading Tips Section
Context-aware insights based on current market conditions.
What You'll See:
Commercial positioning assessment (extreme long/short, favorable/unfavorable)
Speculator positioning (contrarian support or warning)
Open Interest guidance (who's driving changes)
Trend assessment (aligning or conflicting)
Information about entry timing, position sizing, and confirmation needs
Trading Use: Review these tips when analyzing. They provide context-specific information tailored to current conditions.
---
📈 Trend Analysis Section
Trend Direction - Overall price trend:
- Bullish - Price trending up
- Bearish - Price trending down
- Mixed - No clear direction
Consistency - How stable the trend is:
- Consistent - Trend is stable and maintaining direction
- Mixed - Trend is unstable, direction changing
- Accelerating - Trend is gaining momentum
Strength - Trend intensity:
- Strong - Powerful trend
- Steady - Moderate trend
- Weak - Weak trend
This Week - Net position change this week (percentage).
Cumulative Change - Total net position change over different periods:
- 4W - 4-week cumulative change
- 13W - 13-week cumulative change (one quarter)
- 26W - 26-week cumulative change (half year)
ROC % - Rate of Change percentage over different periods. Shows momentum.
vs MA - Current net position compared to moving average:
- Positive = Above average (strong positioning)
- Negative = Below average (weak positioning)
Trading Use: Align COT signals with trend direction for higher accuracy. When COT signals align with price trend, signals are more reliable. Counter-trend signals require more confirmation.
---
🔄 Market Maker Activity Section
Total Spreading - Percentage of open interest in spread positions (simultaneous long and short in different months).
Percentile - Where current spreading level ranks historically. High percentile = unusual spreading activity.
13W Trend - 13-week trend in spreading activity (+ = increasing, - = decreasing).
Activity Level - Market maker activity intensity:
- High - Very active, expect volatility
- Moderate - Normal activity
- Low - Quiet, less volatility expected
vs 13W Avg - Current activity compared to 13-week average.
Trading Edge - Interpretation of market maker activity:
- High & Rising - Expect volatility, market makers hedging risk
- High & Stable - Active hedging, monitor for changes
- Low & Falling - Reduced activity, potential for directional moves
Trading Use: High market maker activity often precedes volatility. Use this to adjust position sizing and risk management. When spreading is high and rising, expect choppy conditions.
---
📋 Understanding Compact Mode Fields
The Compact mode provides essential information for quick trading decisions. Here's what each field means:
State
Shows the overall market sentiment based on combined COT analysis.
Possible Values:
- STRONG BULLISH - Multiple factors aligned bullish, strong buy signal
- MODERATE BULLISH - Several bullish factors, moderate buy signal
- LEANING BULLISH - Slight bullish bias, watch for confirmation
- NEUTRAL - Mixed signals, trade with existing trend
- LEANING BEARISH - Slight bearish bias, watch for confirmation
- MODERATE BEARISH - Several bearish factors, moderate sell signal
- STRONG BEARISH - Multiple factors aligned bearish, strong sell signal
Trading Use: Start your analysis here. Strong signals (STRONG BULLISH/BEARISH) indicate higher confidence setups. Neutral means trade with price trend.
---
Entry
Your actionable trading signal based on Commercial positioning.
Possible Values:
- LONG - Commercials are heavy buyers (≥Heavy Buyers Level), bullish signal
- SHORT - Commercials are heavy sellers (≤Heavy Sellers Level), bearish signal
- Wait - Commercials neutral, no clear signal
Trading Use: This is your go/no-go decision point. Only take trades when Entry shows LONG or SHORT. When Entry = Wait, stay on sidelines until clearer signal develops.
---
Comm Index
Commercial LW Index percentage showing where Commercial net position ranks historically.
Range: 0% to 100%
- 0-26% = Commercials heavy sellers (bearish positioning)
- 27-73% = Commercials neutral (no extreme)
- 74-100% = Commercials heavy buyers (bullish positioning)
Trading Use: Commercial extremes are most reliable. Values ≥74% (heavy buyers/extreme long) = BULLISH signal. Values ≤26% (heavy sellers/extreme short) = BEARISH signal. When Commercials are heavy buyers, it indicates bullish sentiment. When they're heavy sellers, it indicates bearish sentiment.
---
OI Status
Open Interest condition showing market participation level and trend.
Format: Status (Percentile %)
Examples:
- High (100.0%) - OI at extreme high, strong participation
- Moderate (50.0%) - OI at average level
- Low (10.0%) - OI at extreme low, weak participation
Trend Indicators:
- Rising - OI increasing (new money entering)
- Falling - OI decreasing (money leaving)
- Stable - OI unchanged
Trading Use: High OI with rising trend = strong market participation, confirms directional moves. Falling OI = watch for potential reversals. Low OI = reduced participation, potential for volatility.
---
Best Setup
Shows which combination of factors has the highest historical accuracy.
Format: Combination Name (Accuracy %)
Examples:
- Commercials Alone (75.3%) - Commercial positioning only
- Commercials + Speculators (68.2%) - Commercials and specs aligned
- Commercials + Open Interest (72.1%) - Commercials with OI confirmation
- Commercials + Speculators + OI (82.1%) - All factors aligned (strongest)
Trading Use: Higher accuracy values indicate signals with higher historical accuracy. When Best Setup shows "Commercials + Speculators + OI" with high accuracy, it indicates a combination with strong historical performance.
---
Trend
13-week cumulative trend direction based on net position changes.
Possible Values:
- Bullish - Net positions trending bullish over 13 weeks
- Bearish - Net positions trending bearish over 13 weeks
- Mixed - No clear directional trend
Trading Use: Align Entry signals with Trend for higher accuracy. When Entry = LONG and Trend = Bullish, signal is stronger. When Entry = LONG but Trend = Bearish, wait for price confirmation before entering. Counter-trend signals require more confirmation.
---
Full Mode - Historical Table
The Full historical mode shows:
All time periods: 1 Month, 3 Months, 6 Months, 1 Year, 3 Years, All Time
All COT groups: Commercial, Non-Commercial, Small Speculators, Open Interest
Complete header with asset type and lookback information
Best for: Comprehensive historical analysis, understanding long-term positioning
---
Compact Mode - Historical Table
The Compact historical mode shows:
Essential periods only: 1M, 3M, 6M, 1Y, All Time
Commercial % only (most important indicator)
Simplified header
Best for: Quick reference, mobile-friendly, focused analysis
---
🎯 How to Use Each Feature for Trading
Using Display Modes
COT Report Mode - Use for:
Understanding raw position sizes
Analyzing net position changes
Comparing absolute positions across groups
Detailed market structure analysis
COT Index Mode - Use for:
Quick sentiment assessment
Identifying extremes (Percentile can show >100% or <0%, LW Index shows 0-100%)
Comparing relative positioning
Signal generation
COT Proximity Index Mode - Use for:
When COT data is delayed
Real-time sentiment estimation
Price-action based analysis
---
Using Analysis Methods
Percentile Method - Use when:
You want to catch new extremes (>100% or <0%)
You need responsive signals
You're analyzing recent market regime changes
You want to use the professional approach (excludes current bar from range)
LW Index Method - Use when:
You want traditional Larry Williams analysis
You prefer stable, conservative signals
You're doing long-term analysis
You want always 0-100% range
---
Using Signal Generation
Enable Signal Arrows when:
You want visual alerts for high-quality setups
You're scanning multiple charts
You want to catch extreme positioning
Enable Background Colors when:
You want quick visual market state assessment
You're monitoring multiple timeframes
You want to see market conditions at a glance
Use Price Trend Weighting to:
Increase signal reliability
Align COT signals with price action
Filter counter-trend signals
---
Using Smoothing
No Smoothing - Best for:
Catching extremes quickly
Responsive signal generation
Active trading
With Smoothing - Best for:
Reducing noise
Trend identification
Swing trading
Remember: Smoothing affects visual display. Enable "Smooth COT Index Plots" if you want smoothed values in calculations.
---
Using Heavy Buyers/Sellers Levels
Default 74%/26% - Good starting point
Tighter levels (80%/20%) - More conservative, fewer signals
Wider levels (70%/30%) - More signals, less extreme
Trading Use: Adjust based on your risk tolerance and signal frequency preference.
---
Using Table Sections
Settings - Verify your configuration
Current Positions - Understand current market structure
Analysis - Identify extremes and market state
Trading Edge & Signals - Most important - Entry signals based on Commercial positioning
Trading Tips - Context-aware insights
Trend Analysis - Understand momentum and direction
Market Maker Activity - Assess market maker positioning
---
💡 Key Trading Concepts
Market State Interpretation
STRONG BULLISH - Multiple factors aligned bullish. Strong buy signal.
MODERATE BULLISH - Several bullish factors. Moderate buy signal.
LEANING BULLISH - Slight bullish bias. Watch for confirmation.
NEUTRAL - Mixed signals. Trade with existing trend.
LEANING BEARISH - Slight bearish bias. Watch for confirmation.
MODERATE BEARISH - Several bearish factors. Moderate sell signal.
STRONG BEARISH - Multiple factors aligned bearish. Strong sell signal.
---
Entry Level Signals
LONG - Commercials are heavy buyers (≥Heavy Buyers Level). Bullish signal.
SHORT - Commercials are heavy sellers (≤Heavy Sellers Level). Bearish signal.
Wait - Commercials neutral. No clear signal.
When Commercials are heavy buyers (high index), it indicates bullish sentiment. When they're heavy sellers (low index), it indicates bearish sentiment.
---
Best Setup Interpretation
The Best Setup shows the historically highest accuracy combination:
Commercials Alone - Commercial positioning is most reliable
Commercials + Speculators - Both groups aligned
Commercials + Open Interest - Commercials + OI confirmation
Commercials + Speculators + OI - All factors aligned (strongest)
Higher accuracy = More reliable signal. Use this to prioritize which signals to follow.
---
Open Interest Analysis
Critical Question: Who is driving Open Interest changes?
EXTREMELY BULLISH (Very Rare):
Commercials driving OI increase + Commercials raising positions + Uptrend = EXTREMELY BULLISH
This is very rare - pay close attention when this occurs
STRONG BULLISH:
Commercials driving OI increase + Commercials long = STRONG BULLISH
BEARISH (Market Topping):
Commercials exiting + OI increasing due to Small Specs + Non-Commercials = BEARISH (market topping)
Most likely scenario for bearish reversal - speculative excess
BEARISH (Speculative Excess):
Speculators driving OI increase + Speculators long = BEARISH (speculative excess)
TREND CONFIRMATION:
Rising OI = Confirms trend (new money entering)
Falling OI = Potential reversal (money leaving)
This is one of Larry Williams' most important insights. When Commercials drive OI increases while raising positions in an uptrend, it's extremely bullish and very rare - pay attention. When Commercials exit while Small Specs and Non-Commercials drive OI increases, the market is likely topping.
---
🚀 Practical Trading Workflow
Daily Analysis Routine
Check Market State - Overall assessment
Review Entry Level - Actionable signal
Check Best Setup - Signal reliability
Review Trading Tips - Context-aware insights
Analyze Trend Analysis - Momentum confirmation
Check Historical Comparison - Context over time
Verify Open Interest - Who's driving changes
---
Signal Confirmation Checklist
Before taking a trade based on COT signals:
✓ Market State shows clear bias (not Neutral)
✓ Entry Level matches Market State
✓ Best Setup shows high accuracy (>60%)
✓ Price trend aligns with signal (if using trend weighting)
✓ Open Interest confirms (rising for trend continuation, falling for reversal)
✓ Historical comparison shows extreme positioning
✓ Price action confirms (wait for price confirmation)
---
⚠️ Important Notes
COT data is weekly - Updates every Friday afternoon
Extremes can persist - Don't expect immediate reversals
Combine with price action - COT is one tool among many
Historical context matters - Consider market conditions
Meats markets are special - Small specs are accurate (like commercials)
Signals are rare - High-quality signals don't appear every week
---
This description covers all settings and features of the Larry Williams COT Analysis Enhanced indicator. Larry Williams recommends combining COT analysis with other indicators for setup signals: Williams Sentiment Index, Williams Valuation Index, Williams True Seasonal, Pinch and Paunch Signal, along with price action, technical analysis, and fundamental factors.
---
📖 Conclusion
The Larry Williams COT Analysis Enhanced indicator provides a sophisticated framework for understanding market sentiment through the lens of different participant groups. By combining mathematical analysis with behavioral insights, it displays COT positioning data, calculates index values, and generates signals based on extreme positioning.
Remember: This is a tool for analysis, not a crystal ball. Consider combining COT analysis with other Larry Williams indicators, price action, technical analysis, and fundamental factors.
Practice with the indicator, study historical signals, and develop your understanding of how different market participants behave. Signals with multiple factors aligned - Commercials at extremes, Open Interest changes driven by the right groups, and price action confirming the COT signals - have shown higher historical accuracy.
This description provides comprehensive documentation for the Larry Williams COT Analysis Enhanced indicator. For the most current data and analysis, always refer to the latest COT reports and market conditions.
---
Acknowledgment
This tool builds upon the foundational work of Larry Williams, who developed the Commitments of Traders (COT) analysis methodology and the principles for interpreting COT data. It also incorporates enhancements including statistical validation, combination analysis, adaptive signal generation, and comprehensive historical comparison features.
Note: Always practice proper risk management and thoroughly test the indicator to ensure it aligns with your trading strategy. Past performance is not indicative of future results.

DCA Investment Tracker Pro [tradeviZion]DCA Investment Tracker Pro: Educational DCA Analysis Tool
An educational indicator that helps analyze Dollar-Cost Averaging strategies by comparing actual performance with historical data calculations.
---
💡 Why I Created This Indicator
As someone who practices Dollar-Cost Averaging, I was frustrated with constantly switching between spreadsheets, calculators, and charts just to understand how my investments were really performing. I wanted to see everything in one place - my actual performance, what I should expect based on historical data, and most importantly, visualize where my strategy could take me over the long term .
What really motivated me was watching friends and family underestimate the incredible power of consistent investing. When Napoleon Bonaparte first learned about compound interest, he reportedly exclaimed "I wonder it has not swallowed the world" - and he was right! Yet most people can't visualize how their $500 monthly contributions today could become substantial wealth decades later.
Traditional DCA tracking tools exist, but they share similar limitations:
Require manual data entry and complex spreadsheets
Use fixed assumptions that don't reflect real market behavior
Can't show future projections overlaid on actual price charts
Lose the visual context of what's happening in the market
Make compound growth feel abstract rather than tangible
I wanted to create something different - a tool that automatically analyzes real market history, detects volatility periods, and shows you both current performance AND educational projections based on historical patterns right on your TradingView charts. As Warren Buffett said: "Someone's sitting in the shade today because someone planted a tree a long time ago." This tool helps you visualize your financial tree growing over time.
This isn't just another calculator - it's a visualization tool that makes the magic of compound growth impossible to ignore.
---
🎯 What This Indicator Does
This educational indicator provides DCA analysis tools. Users can input investment scenarios to study:
Theoretical Performance: Educational calculations based on historical return data
Comparative Analysis: Study differences between actual and theoretical scenarios
Historical Projections: Theoretical projections for educational analysis (not predictions)
Performance Metrics: CAGR, ROI, and other analytical metrics for study
Historical Analysis: Calculates historical return data for reference purposes
---
🚀 Key Features
Volatility-Adjusted Historical Return Calculation
Analyzes 3-20 years of actual price data for any symbol
Automatically detects high-volatility stocks (meme stocks, growth stocks)
Uses median returns for volatile stocks, standard CAGR for stable stocks
Provides conservative estimates when extreme outlier years are detected
Smart fallback to manual percentages when data insufficient
Customizable Performance Dashboard
Educational DCA performance analysis with compound growth calculations
Customizable table sizing (Tiny to Huge text options)
9 positioning options (Top/Middle/Bottom + Left/Center/Right)
Theme-adaptive colors (automatically adjusts to dark/light mode)
Multiple display layout options
Future Projection System
Visual future growth projections
Timeframe-aware calculations (Daily/Weekly/Monthly charts)
1-30 year projection options
Shows projected portfolio value and total investment amounts
Investment Insights
Performance vs benchmark comparison
ROI from initial investment tracking
Monthly average return analysis
Investment milestone alerts (25%, 50%, 100% gains)
Contribution tracking and next milestone indicators
---
📊 Step-by-Step Setup Guide
1. Investment Settings 💰
Initial Investment: Enter your starting lump sum (e.g., $60,000)
Monthly Contribution: Set your regular DCA amount (e.g., $500/month)
Return Calculation: Choose "Auto (Stock History)" for real data or "Manual" for fixed %
Historical Period: Select 3-20 years for auto calculations (default: 10 years)
Start Year: When you began investing (e.g., 2020)
Current Portfolio Value: Your actual portfolio worth today (e.g., $150,000)
2. Display Settings 📊
Table Sizes: Choose from Tiny, Small, Normal, Large, or Huge
Table Positions: 9 options - Top/Middle/Bottom + Left/Center/Right
Visibility Toggles: Show/hide Main Table and Stats Table independently
3. Future Projection 🔮
Enable Projections: Toggle on to see future growth visualization
Projection Years: Set 1-30 years ahead for analysis
Live Example - NASDAQ:META Analysis:
Settings shown: $60K initial + $500/month + Auto calculation + 10-year history + 2020 start + $150K current value
---
🔬 Pine Script Code Examples
Core DCA Calculations:
// Calculate total invested over time
months_elapsed = (year - start_year) * 12 + month - 1
total_invested = initial_investment + (monthly_contribution * months_elapsed)
// Compound growth formula for initial investment
theoretical_initial_growth = initial_investment * math.pow(1 + annual_return, years_elapsed)
// Future Value of Annuity for monthly contributions
monthly_rate = annual_return / 12
fv_contributions = monthly_contribution * ((math.pow(1 + monthly_rate, months_elapsed) - 1) / monthly_rate)
// Total expected value
theoretical_total = theoretical_initial_growth + fv_contributions
Volatility Detection Logic:
// Detect extreme years for volatility adjustment
extreme_years = 0
for i = 1 to historical_years
yearly_return = ((price_current / price_i_years_ago) - 1) * 100
if yearly_return > 100 or yearly_return < -50
extreme_years += 1
// Use median approach for high volatility stocks
high_volatility = (extreme_years / historical_years) > 0.2
calculated_return = high_volatility ? median_of_returns : standard_cagr
Performance Metrics:
// Calculate key performance indicators
absolute_gain = actual_value - total_invested
total_return_pct = (absolute_gain / total_invested) * 100
roi_initial = ((actual_value - initial_investment) / initial_investment) * 100
cagr = (math.pow(actual_value / initial_investment, 1 / years_elapsed) - 1) * 100
---
📊 Real-World Examples
See the indicator in action across different investment types:
Stable Index Investments:
AMEX:SPY (SPDR S&P 500) - Shows steady compound growth with standard CAGR calculations
Classic DCA success story: $60K initial + $500/month starting 2020. The indicator shows SPY's historical 10%+ returns, demonstrating how consistent broad market investing builds wealth over time. Notice the smooth theoretical growth line vs actual performance tracking.
MIL:VUAA (Vanguard S&P 500 UCITS) - Shows both data limitation and solution approaches
Data limitation example: VUAA shows "Manual (Auto Failed)" and "No Data" when default 10-year historical setting exceeds available data. The indicator gracefully falls back to manual percentage input while maintaining all DCA calculations and projections.
MIL:VUAA (Vanguard S&P 500 UCITS) - European ETF with successful 5-year auto calculation
Solution demonstration: By adjusting historical period to 5 years (matching available data), VUAA auto calculation works perfectly. Shows how users can optimize settings for newer assets. European market exposure with EUR denomination, demonstrating DCA effectiveness across different markets and currencies.
NYSE:BRK.B (Berkshire Hathaway) - Quality value investment with Warren Buffett's proven track record
Value investing approach: Berkshire Hathaway's legendary performance through DCA lens. The indicator demonstrates how quality companies compound wealth over decades. Lower volatility than tech stocks = standard CAGR calculations used.
High-Volatility Growth Stocks:
NASDAQ:NVDA (NVIDIA Corporation) - Demonstrates volatility-adjusted calculations for extreme price swings
High-volatility example: NVIDIA's explosive AI boom creates extreme years that trigger volatility detection. The indicator automatically switches to "Median (High Vol): 50%" calculations for conservative projections, protecting against unrealistic future estimates based on outlier performance periods.
NASDAQ:TSLA (Tesla) - Shows how 10-year analysis can stabilize volatile tech stocks
Stable long-term growth: Despite Tesla's reputation for volatility, the 10-year historical analysis (34.8% CAGR) shows consistent enough performance that volatility detection doesn't trigger. Demonstrates how longer timeframes can smooth out extreme periods for more reliable projections.
NASDAQ:META (Meta Platforms) - Shows stable tech stock analysis using standard CAGR calculations
Tech stock with stable growth: Despite being a tech stock and experiencing the 2022 crash, META's 10-year history shows consistent enough performance (23.98% CAGR) that volatility detection doesn't trigger. The indicator uses standard CAGR calculations, demonstrating how not all tech stocks require conservative median adjustments.
Notice how the indicator automatically detects high-volatility periods and switches to median-based calculations for more conservative projections, while stable investments use standard CAGR methods.
---
📈 Performance Metrics Explained
Current Portfolio Value: Your actual investment worth today
Expected Value: What you should have based on historical returns (Auto) or your target return (Manual)
Total Invested: Your actual money invested (initial + all monthly contributions)
Total Gains/Loss: Absolute dollar difference between current value and total invested
Total Return %: Percentage gain/loss on your total invested amount
ROI from Initial Investment: How your starting lump sum has performed
CAGR: Compound Annual Growth Rate of your initial investment (Note: This shows initial investment performance, not full DCA strategy)
vs Benchmark: How you're performing compared to the expected returns
---
⚠️ Important Notes & Limitations
Data Requirements: Auto mode requires sufficient historical data (minimum 3 years recommended)
CAGR Limitation: CAGR calculation is based on initial investment growth only, not the complete DCA strategy
Projection Accuracy: Future projections are theoretical and based on historical returns - actual results may vary
Timeframe Support: Works ONLY on Daily (1D), Weekly (1W), and Monthly (1M) charts - no other timeframes supported
Update Frequency: Update "Current Portfolio Value" regularly for accurate tracking
---
📚 Educational Use & Disclaimer
This analysis tool can be applied to various stock and ETF charts for educational study of DCA mathematical concepts and historical performance patterns.
Study Examples: Can be used with symbols like AMEX:SPY , NASDAQ:QQQ , AMEX:VTI , NASDAQ:AAPL , NASDAQ:MSFT , NASDAQ:GOOGL , NASDAQ:AMZN , NASDAQ:TSLA , NASDAQ:NVDA for learning purposes.
EDUCATIONAL DISCLAIMER: This indicator is a study tool for analyzing Dollar-Cost Averaging strategies. It does not provide investment advice, trading signals, or guarantees. All calculations are theoretical examples for educational purposes only. Past performance does not predict future results. Users should conduct their own research and consult qualified financial professionals before making any investment decisions.
---
© 2025 TradeVizion. All rights reserved.

IBD Style Candles [tradeviZion]IBD Style Candles - Visualize Price Bars Like the Pros
Transform your chart with institutional-grade IBD-style bars and customizable moving averages for both daily and weekly timeframes. This indicator helps you visualize price action the way professionals at Investors Business Daily do.
What This Indicator Offers:
IBD-style bar visualization (clean, professional appearance)
Customizable coloring based on price movement or previous close
Automatic timeframe detection for appropriate moving averages
Four customizable moving averages for daily timeframes (10, 21, 50, 200)
Four customizable moving averages for weekly timeframes (10, 20, 30, 40)
Options to use SMAs or EMAs with adjustable colors and line widths
"The IBD-style bars provide a cleaner view of price action, allowing you to focus on market structure without the visual noise of traditional candles."
How to Apply the IBD-Style Bars:
On your TradingView chart, select "Bars" as the chart type from the main chart type selection menu (next to the time interval options).
Right-click on the chart and select "Settings".
Go to the "Symbol" tab.
Uncheck the "Thin Bars" option to display thicker bars.
Set the "Up Color" and "Down Color" opacity to 0 for a clean IBD-style appearance.
Enable "IBD-style Candles" from the script's settings.
To revert to the original chart style, repeat the above steps and restore the default settings.
Moving Average Configuration:
The indicator automatically detects your timeframe and displays the appropriate moving averages:
Daily Timeframe Moving Averages:
10-day moving average (SMA/EMA)
21-day moving average (SMA/EMA)
50-day moving average (SMA/EMA)
200-day moving average (SMA/EMA)
Weekly Timeframe Moving Averages:
10-week moving average (SMA/EMA)
20-week moving average (SMA/EMA)
30-week moving average (SMA/EMA)
40-week moving average (SMA/EMA)
Usage Tips:
Enable "Color bars based on previous close" to identify momentum shifts based on prior candle closes
Customize colors to match your chart theme or preference
Enable only the moving averages relevant to your trading strategy
For cleaner charts, reduce the number of visible moving averages
For stock trading, the 10/21/50/200 daily and 10/40 weekly MAs are most commonly used by institutions
// Example configuration for different timeframes
if timeframe.isweekly
// Weekly configuration
showSMA1_Weekly = true // 10-week MA
showSMA4_Weekly = true // 40-week MA
else
// Daily configuration
showMA2_Daily = true // 21-day MA
showMA3_Daily = true // 50-day MA
showMA4_Daily = true // 200-day MA
While the IBD style provides clarity, remember that no visualization method guarantees trading success. Always combine with proper analysis and risk management.
If you found this indicator helpful, please consider leaving a comment or suggestion for future improvements. Happy trading!

True Seasonal Pattern [tradeviZion]True Seasonal Pattern: Uncover Hidden Market Cycles
Markets have rhythms and patterns that repeat with surprising regularity. The True Seasonal Pattern indicator reveals these hidden cycles across different timeframes, helping you anticipate potential market movements based on historical seasonal tendencies.
What This Indicator Does
The True Seasonal Pattern analyzes years of historical price data to identify recurring seasonal trends. It then plots these patterns on your chart, showing you both the historical pattern and future projection based on past seasonal behavior.
Automatic Timeframe Detection: Works with Monthly, Weekly, and Daily charts
Historical Pattern Analysis: Analyzes up to 100 years of data (customizable)
Future Projection: Projects the seasonal pattern ahead on your chart
Smart Smoothing: Applies appropriate smoothing based on your timeframe
How to Use This Indicator
Add the indicator to a Daily, Weekly, or Monthly chart (not designed for intraday timeframes)
The indicator automatically detects your chart's timeframe
The blue line shows the historical seasonal pattern
Watch for potential turning points in the pattern that align with other technical signals
Seasonal patterns work best as a supporting factor in your analysis, not as standalone trading signals. They are particularly effective in markets with well-established seasonal influences.
Best Applications
Futures Markets: Commodities and futures often show strong seasonal tendencies due to production cycles, weather patterns, and economic factors
Stock Indices: Many stock markets demonstrate regular seasonal patterns (like the "Sell in May" phenomenon)
Individual Stocks: Companies with seasonal business cycles often show predictable price patterns
Practical Applications
Identify potential turning points based on historical seasonal patterns
Plan entries and exits around seasonal tendencies
Add seasonal context to your existing technical analysis
Understand why certain months or periods might show consistent behavior
Pro Tip: For best results, use this tool on instruments with at least 5+ years of historical data. Longer timeframes often reveal more reliable seasonal patterns.
Important Notes
This indicator works best on Daily, Weekly, and Monthly timeframes - not intraday charts
Seasonal patterns are tendencies, not guarantees
Always combine seasonal analysis with other technical tools
Past patterns may not repeat exactly in the future
// Sample of the seasonal calculation approach
float yearHigh = array.max(currentYearHighs)
float yearLow = array.min(currentYearLows)
// Calculate seasonality for each period
for i = 0 to array.size(currentYearCloses) - 1
float periodClose = array.get(currentYearCloses, i)
if not na(periodClose) and yearHigh != yearLow
float seasonality = (periodClose - yearLow) / (yearHigh - yearLow) * 100
I developed this indicator to help traders incorporate seasonal analysis into their trading approach without the complexity of traditional seasonal tools. Whether you're analyzing agricultural commodities, energy futures, or stock indices, understanding the seasonal context can provide valuable insights for your trading decisions.
Remember: Markets don't always follow seasonal patterns, but when they do, being aware of these tendencies can give you a meaningful edge in your analysis.

Price Change Sentiment Index [tradeviZion]Price Change Sentiment Index
A technical indicator that measures price changes relative to the day's range.
Indicator Overview
Normalizes price changes on a 0-100 scale
Uses a smoothing period for signal clarity
Shows potential overbought/oversold conditions
Inputs
Smoothing Period (default: 3)
Show Background Colors (on/off)
Overbought Level (default: 75)
Oversold Level (default: 25)
Reading the Indicator
Values above 75: Price change showing strong upward movement
Values below 25: Price change showing strong downward movement
Around 50: Neutral price movement
Technical Details
// Core calculation
changePct = (currClose - prevClose) / (high - low)
normalized = 50 + (changePct * 50)
smoothedNormalized = ta.sma(normalizedClamped, smoothingPeriod)
Usage Notes
Best used with other technical analysis tools
Adjustable smoothing period affects signal sensitivity
Background colors highlight extreme readings
Works on any timeframe
Settings Guide
Smoothing Period:
- Lower values (1-3): More responsive
- Higher values (5-10): Smoother output
Visual Settings: Toggle background colors
Levels: Adjust overbought/oversold thresholds
This indicator is a technical analysis tool. Please conduct your own research and testing before use.

Larry Williams POIV A/D [tradeviZion]Larry Williams' POIV A/D - Release Notes v1.0
=================================================
Release Date: 01 April 2025
OVERVIEW
--------
The Larry Williams POIV A/D (Price, Open Interest, Volume Accumulation/Distribution) indicator implements Williams' original formula while adding advanced divergence detection capabilities. This powerful tool combines price movement, open interest, and volume data to identify potential trend reversals and continuations.
FEATURES
--------
- Implements Larry Williams' original POIV A/D formula
- Divergence detection system:
* Regular divergences for trend reversal signals
* Hidden divergences for trend continuation signals
- Fast Mode option for earlier pivot detection
- Customizable sensitivity for divergence filtering
- Dynamic color visualization based on indicator direction
- Adjustable smoothing to reduce noise
- Automatic fallback to OBV when Open Interest is unavailable
FORMULA
-------
POIV A/D = CumulativeSum(Open Interest * (Close - Close ) / (True High - True Low)) + OBV
Where:
- Open Interest: Current period's open interest
- Close - Close : Price change from previous period
- True High - True Low: True Range
- OBV: On Balance Volume
DIVERGENCE TYPES
---------------
1. Regular Divergences (Reversal Signals):
- Bullish: Price makes lower lows while indicator makes higher lows
- Bearish: Price makes higher highs while indicator makes lower highs
2. Hidden Divergences (Continuation Signals):
- Bullish: Price makes higher lows while indicator makes lower lows
- Bearish: Price makes lower highs while indicator makes higher highs
REQUIREMENTS
-----------
- Works best with futures and other instruments that provide Open Interest data
- Automatically adapts to work with any instrument by using OBV when OI is unavailable
USAGE GUIDE
-----------
1. Apply the indicator to any chart
2. Configure settings:
- Adjust sensitivity for divergence detection
- Enable/disable Fast Mode for earlier signals
- Customize visual settings as needed
3. Look for divergence signals:
- Regular divergences for potential trend reversals
- Hidden divergences for trend continuation opportunities
4. Use the alerts system for automated divergence detection
KNOWN LIMITATIONS
----------------
- Requires Open Interest data for full functionality
- Fast Mode may generate more signals but with lower reliability
ACKNOWLEDGEMENTS
---------------
This indicator is based on Larry Williams' work on Open Interest analysis. The implementation includes additional features for divergence detection while maintaining the integrity of the original formula.

Mean Reversion Pro Strategy [tradeviZion]Mean Reversion Pro Strategy : User Guide
A mean reversion trading strategy for daily timeframe trading.
Introduction
Mean Reversion Pro Strategy is a technical trading system that operates on the daily timeframe. The strategy uses a dual Simple Moving Average (SMA) system combined with price range analysis to identify potential trading opportunities. It can be used on major indices and other markets with sufficient liquidity.
The strategy includes:
Trading System
Fast SMA for entry/exit points (5, 10, 15, 20 periods)
Slow SMA for trend reference (100, 200 periods)
Price range analysis (20% threshold)
Position management rules
Visual Elements
Gradient color indicators
Three themes (Dark/Light/Custom)
ATR-based visuals
Signal zones
Status Table
Current position information
Basic performance metrics
Strategy parameters
Optional messages
📊 Strategy Settings
Main Settings
Trading Mode
Options: Long Only, Short Only, Both
Default: Long Only
Position Size: 10% of equity
Starting Capital: $20,000
Moving Averages
Fast SMA: 5, 10, 15, or 20 periods
Slow SMA: 100 or 200 periods
Default: Fast=5, Slow=100
🎯 Entry and Exit Rules
Long Entry Conditions
All conditions must be met:
Price below Fast SMA
Price below 20% of current bar's range
Price above Slow SMA
No existing position
Short Entry Conditions
All conditions must be met:
Price above Fast SMA
Price above 80% of current bar's range
Price below Slow SMA
No existing position
Exit Rules
Long Positions
Exit when price crosses above Fast SMA
No fixed take-profit levels
No stop-loss (mean reversion approach)
Short Positions
Exit when price crosses below Fast SMA
No fixed take-profit levels
No stop-loss (mean reversion approach)
💼 Risk Management
Position Sizing
Default: 10% of equity per trade
Initial capital: $20,000
Commission: 0.01%
Slippage: 2 points
Maximum one position at a time
Risk Control
Use daily timeframe only
Avoid trading during major news events
Consider market conditions
Monitor overall exposure
📊 Performance Dashboard
The strategy includes a comprehensive status table displaying:
Strategy Parameters
Current SMA settings
Trading direction
Fast/Slow SMA ratio
Current Status
Active position (Flat/Long/Short)
Current price with color coding
Position status indicators
Performance Metrics
Net Profit (USD and %)
Win Rate with color grading
Profit Factor with thresholds
Maximum Drawdown percentage
Average Trade value
📱 Alert Settings
Entry Alerts
Long Entry (Buy Signal)
Short Entry (Sell Signal)
Exit Alerts
Long Exit (Take Profit)
Short Exit (Take Profit)
Alert Message Format
Strategy name
Signal type and direction
Current price
Fast SMA value
Slow SMA value
💡 Usage Tips
Consider starting with Long Only mode
Begin with default settings
Keep track of your trades
Review results regularly
Adjust settings as needed
Follow your trading plan
⚠️ Disclaimer
This strategy is for educational and informational purposes only. It is not financial advice. Always:
Conduct your own research
Test thoroughly before live trading
Use proper risk management
Consider your trading goals
Monitor market conditions
Never risk more than you can afford to lose
📋 Release Notes
14 January 2025
Added New Fast & Slow SMA Options:
Fibonacci-based periods: 8, 13, 21, 144, 233, 377
Additional period: 50
Complete Fast SMA options now: 5, 8, 10, 13, 15, 20, 21, 34, 50
Complete Slow SMA options now: 100, 144, 200, 233, 377
Bug Fixes:
Fixed Maximum Drawdown calculation in the performance table
Now using strategy.max_drawdown_percent for accurate DD reporting
Previous version showed incorrect DD values
Performance metrics now accurately reflect trading results
Performance Note:
Strategy tested with Fast/Slow SMA 13/377
Test conducted with 10% equity risk allocation
Daily Timeframe
For Beginners - How to Modify SMA Levels:
Find this line in the code:
fastLength = input.int(title="Fast SMA Length", defval=5, options= )
To add a new Fast SMA period: Add the number to the options list, e.g.,
To remove a Fast SMA period: Remove the number from the options list
For Slow SMA, find:
slowLength = input.int(title="Slow SMA Length", defval=100, options= )
Modify the options list the same way
⚠️ Note: Keep the periods that make sense for your trading timeframe
💡 Tip: Test any new combinations thoroughly before live trading
"Trade with Discipline, Manage Risk, Stay Consistent" - tradeviZion

IBD Market School [tradeviZion]IBD Market School Indicator: User Guide and Settings Reference
A comprehensive guide to configuring and using the IBD Market School indicator for TradingView
Introduction
The IBD Market School indicator is an advanced market analysis tool that implements Investor's Business Daily's methodology for identifying optimal trading opportunities. By tracking key market indexes and analyzing price and volume patterns, it provides actionable buy and sell signals based on the CANSLIM investment system.
The indicator offers a comprehensive set of features:
Complete Signal System
10 primary buy signals (B1-B10)
Additional buy-side indicators (HH - Higher High, ED - Expired Days)
14 sell signals (S1-S14)
Index Rise 6% signal for Distribution/Stalling Day expiration
Market Health Tracking
Distribution Day detection and counting
Stalling Day identification and validation
Automatic 25-day signal expiration
6% price rise monitoring for signal clearing
Market Condition Analysis
Rally Day detection (major and minor)
Follow-Through Day confirmation
Dynamic market exposure management (0-100%)
Power Trend analysis with multiple states
Risk Management Features
Circuit Breaker system for major declines
Buy Switch system for exposure control
Customizable volume analysis (Nasdaq/S&P 500)
Distribution day clustering detection
Visual Analysis Tools
IBD-style candle display option
Power Trend state visualization
Signal line drawing system
Customizable tooltips and alerts
Proper configuration of the indicator's settings is essential as it affects:
Signal detection sensitivity and accuracy
Market exposure calculations and adjustments
Volume confirmation requirements
Visual display of market conditions and signals
Alert system behavior and notifications
This guide provides detailed explanations of each component and setting to help you optimize the indicator for your trading strategy while maintaining adherence to IBD's proven methodology.
📊 General Settings
This section controls the indicator's tooltip display, alert behavior, and candle visualization preferences.
The General Settings panel allows you to configure tooltip modes, alert types, and candle appearance.
Tooltip Display Mode
Select how detailed the tooltips should be when hovering over signals and indicators:
The three tooltip display modes: Simple (left), Detailed (center), and Market Analysis (right).
Simple Mode
Displays concise signal definitions
Shows basic entry and exit conditions
Focuses on essential trigger points
Perfect for experienced traders
Detailed Mode
Provides in-depth explanations of each buy/sell signal
Shows complete validation criteria and conditions
Includes volume requirements and percentage thresholds
Explains the context and significance of each signal
Market Analysis Mode
Focuses on broad market health metrics
Shows market exposure percentage and trend
Displays buy switch and power trend status
Tracks distribution days and signal buffers
Note: Choose the tooltip mode based on your needs:
- Simple: Provides quick, essential information on signals for fast decision-making
- Detailed: Breaks down conditions for each buy/sell signal, ideal for users wanting in-depth explanations
- Market Analysis: Focuses on broad market health, including exposure, buy switch, distribution days, and trends
Market Exposure Alert System
The indicator alerts you when market exposure levels change, helping you adjust your positions accordingly.
Alert Types
On Close (Recommended)
Triggers only after bar closes
More reliable signals as price action is confirmed
Real-Time
Triggers immediately when conditions are met
Note: Signals may change by bar close
Setting Up Alerts
Click the "..." (More) button on the indicator label "$tradeviZion - IBD Market School"
Select "Add alert on $tradeviZion - IBD Market School..."
In the Create Alert dialog:
Settings tab:
Verify the symbol and timeframe (e.g., NASDAQ:IXIC , 1D)
Condition: Select "$tradeviZion - IBD Market School"
Alert function: Choose "Any alert() function call"
Expiration: Set to "Open-ended alert"
Alert name will auto-populate
Switch to Notifications tab:
Enable "Notify in app" for push notifications in the mobile app
Enable "Show toast notification" for on-screen alerts
Enable "Play sound" and customize duration (e.g., Thin, 10 seconds)
Optional settings:
Send email (requires profile settings configuration)
Webhook URL for POST requests
Send plain text for alternative email format
Click Create to activate the alert
Alert Messages
Message format: "Market exposure change for : Market exposure from % to %"
Example: "Market exposure change for NASDAQ:IXIC : 📈 Market exposure reduced from 100% to 75%"
📈 Arrow indicates exposure increase
📉 Arrow indicates exposure decrease
Messages include previous and new exposure percentages
Note: These alerts specifically track changes in market exposure levels, helping you stay aligned with market conditions. They are essential for maintaining proper position sizing and risk management.
Chart Style Options
IBD-style Candles
Enable to match Investor's Business Daily chart style
For MarketSmith style setup, right-click on chart and go to Settings
Navigate to Symbol tab
Uncheck Body, Borders, and Wicks
Press Alt+R to restore chart view if zoom affects display
To revert to original style, right-click on chart and go to Settings
Navigate to Symbol tab
Check Body, Borders, and Wicks
Color Based on Previous Close
Colors bars based on close vs. previous close
When enabled, determines colors by comparing current close to previous close
Use blue color for closes above previous
Use pink color for closes below previous
📈 Market Exposure Table Settings
Configure how the market exposure information is displayed on your chart.
The Market Exposure Table Settings panel allows you to customize the appearance and layout of the market status display.
Layout Options
• Hide Table
Completely hides the market status display
• Basic (2 Columns)
Shows main indicators in two columns
Compact view without signal list
Ideal for minimalist chart view
• Detailed (2 Columns with Signals)
Displays main indicators plus signal panel
Shows Buy and Sell signals in separate columns
Provides comprehensive market overview
• Stacked (1 Column, Compact)
Vertical layout with single column
Most space-efficient option
Ideal for smaller chart windows
Color Settings
Background : Dark gray background for the table
Text : White text for general information
Buy Signal : Green highlighting for buy signals
Sell Signal : Red highlighting for sell signals
Additional Options
Show Trading Wisdom: Enable rotating trading messages
Displays empowering trading messages
Helps reinforce disciplined trading practices
Updates every 5 bars with new wisdom
Includes tooltips with comprehensive trading guidance
Customizable yellow text color for messages
💹 Buy Signals Settings
This section controls the visibility and behavior of buy signals and related indicators.
The Buy Signals Settings panel allows you to configure signal visibility, volatility calculations, and visual appearance of buy signals.
Signal Display Options
Buy Signals Display : Choose display mode
Show Selected Signals
Hide All
Compact Signals
Individual Signal Toggles
Primary Buy Signals (B1-B10)
Special Indicators (HH, ED)
Understanding Buy Signals
B1: Follow-Through Day (FTD)
Buy on the initial FTD with volume higher than the previous day. You may use an FTD from an index other than the NASDAQ:IXIC , but if you do, you must stay within that index for future Buy and Sell Signals.
B2: Additional Follow-Through
Buy on all additional follow-through days within 25 days from a rally day that closes above the low of the initial follow-through day.
B3: Low Above EMA21
Buy on an up or flat day when the intraday low is at or above the EMA21. Note: Once you have a B3 or B4, you can't have another until it is reset by an S5.
Special Buy Indicators
HH: Higher High (No FTD after Rally)
Triggers when current close exceeds highest point since last confirmed rally. Must not have a Follow-Through Day (FTD). Buy switch turns on when close exceeds last rally's high and turns off if close drops below that high.
ED: Expired Days
Tracks Distribution and Stalling days that have aged out. Days are tracked for a specific trading period and expired days are removed from the count.
Index Rise Settings
Index Rise 6% from DD & SD
Toggle to enable/disable monitoring of price rises above Distribution and Stalling Days. Default value of 6% (adjustable) for monitoring rises above these days.
Understanding Index Rise
This feature tracks significant market recoveries by monitoring when the index rises substantially above Distribution Days (DD) or Stalling Days (SD). When the index rises 6% or more above the closing price of any DD or SD, it indicates a strong market recovery. This is an important signal because it helps identify when the market has shown enough strength to potentially overcome previous distribution periods. When triggered, this signal reduces the distribution day count, effectively acknowledging that the previous distribution pattern may no longer be as relevant due to the market's strong recovery.
B1 Signal Configuration
Volatility Settings
B1 Auto Volatility: Calculates FTD price requirement based on 200-day volatility
B1 Manual Volatility: Fixed value (default 1.245) when auto is disabled
Visual Settings
Label Size: Small (options: Tiny, Small, Normal, Large)
Signal Color: Light green background for buy signals
Text Color: Customizable text color for signal labels
Important Notes
Signal visibility affects both chart display and calculations
Auto volatility is recommended for most users
Manual volatility should only be adjusted by experienced users
Visual settings apply to all enabled buy signals
Confirmation Rules
Price Requirements
Follow-Through Day (B1) thresholds based on 200-day volatility:
Below 0.4% volatility: 0.7% gain required
0.4% to 0.55% volatility: 0.85% gain required
0.55% to 1% volatility: 1% gain required
Above 1% volatility: 1.245% gain required
EMA Breaks (S5/S6): 0.2% threshold below 21 EMA
Downside Reversal (B9): 1.75% high-to-low spread required
Volume Requirements
Distribution Days: Volume > previous day, with -0.20% or more price decline
Stalling Days: Volume ≥ 95% of previous day
Follow-Through Days (B1/B2): Volume > previous day
Accumulation Days (B7): Volume > previous day, close in upper 25% range
Sell Signals Settings
This section controls the visibility and behavior of sell signals and market weakness indicators.
The Sell Signals Settings panel allows you to configure signal visibility and visual appearance of sell signals and market health indicators.
Signal Display Options
Sell Signals Display: Dropdown with options to control signal visibility:
Show Selected Signals
Hide All
Compact Signals
Individual Signal Toggles
Primary Sell Signals: S1-S14 and CB (Circuit Breaker)
Market Health Indicators:
Distribution Days (DD): Indicative of institutional selling. Occurs when:
Market closes down by at least 0.2%
Volume greater than or equal to prior day
Tracked for 25 trading days
Stalling Days (SD): Sign of heavy volume without upside progress. Occurs when:
Market at/near new highs
Closes with small gain (0% to 0.4%)
High volume in lower half of day's range
Understanding Sell Signals
S1: Follow-Through Day Undercut
Sell if the index closes below the low of the initial follow-through day.
S2: Failed Rally Attempt
Sell if the index undercuts the major low of the rally attempt. Market exposure is reduced to zero and the Buy Switch is turned off.
S2ml: Minor Low Undercut
Minor Low undercut of rally attempt. Market exposure is reduced by two. This does not turn off the Buy Switch.
S3: Full Distribution Minus One
Sell after the distribution count increases to one less than the full distribution count.
S4: Full Distribution
Sell after reaching the full distribution count.
S5: Break Below EMA21
Sell if the index closes 0.2% or more below the EMA21. Note: Once you have an S5, S6, or S7, you can't have another until it is reset by a B3.
S6: Overdue Break Below EMA21
Sell if the index closes down 0.2% or more below the EMA21 after 30 days have passed since the last B3 without triggering an S5.
S7: Trending Below EMA21
Sell after S5 on the 5th consecutive day that the high is below the EMA21 and a down day.
S8: Living Below EMA21
Sell after S5 on the 10th and every 5th consecutive day after that (15th, 20th, 25th, etc.) that the high is below the EMA21.
S9: Break Below 50-Day MA
Sell if the index closes below the 50-Day Moving Average. Triggers only if a B6 signal was previously printed.
S10: Bad Break
Sell if the close is down 2.25% or greater in the bottom 25% of the range. Close below the MA50 or intraday high below EMA21.
S11: Downside Reversal
Sell after a Downside Reversal Day, which occurs with:
New High within 13 weeks
Close in bottom quartile of range
Close Down for the day
Spread of 1.75% or greater
S12: Lower Low
Sell after closing below the last marked low as defined by MarketSmith.
S13: Distribution Cluster
Distribution and stalling days increase to four up to eight days within a rolling eight-day period.
S14: Break Below Higher High
Sell after closing below the last marked high that printed a B8 (Higher High).
CB: Circuit Breaker
Triggers when the index drops 10% from the highest high since the FTD (B1) and falls 5% or more below the 50-Day MA intraday.
Buy/Sell Undercut Lines
This section controls the visibility and appearance of important price level lines on your chart.
The Buy/Sell Undercut Lines panel allows you to configure which signal lines are displayed and their visual appearance.
Line Visibility
Buy Signal Lines :
B8 Line: First high above the last pivot high
HH Line: Close above the prior high since last confirmed rally without FTD
Sell Signal Lines :
S1 Line: Close below the initial follow-through day
S2 Line: Undercut of major low
S2ml Line: Minor low undercut
S12 Line: Close below last marked low
S14 Line: Close below last marked high
Line Appearance
Color Settings :
B8: Green (Buy signal)
HH: Green (Buy signal)
S1: Red (Sell signal)
S2: Red (Sell signal)
S2ml: Orange (Modified sell signal)
S12: Purple (Pivot low signal)
S14: Blue (Close below pivot)
Line Style : Dashed (options: solid, dotted, dashed)
Line Width : 1 (adjustable)
📈 Rally Signal Settings
The Rally Signal Settings panel allows you to configure Rally Day detection and visualization.
Rally Day:
Toggle to enable/disable Rally Day signals. These mark the beginning of potential market uptrends when the market closes higher than the previous day, following a significant decline.
Visual Settings:
Label Size: small (options: tiny, small, normal, large)
Background Color: Customizable background for Rally Day labels
Text Color: Customizable text color for Rally Day labels
Distribution Day Settings:
Use Manual FullDDcount: Option to manually set the minimum combined number of Distribution and Stalling Days
Count Value: Default is 6 days (adjustable when manual mode is enabled)
This setting determines how many Distribution/Stalling Days are required to trigger a new rally
Pivot Point Settings
The Pivot Point Settings panel allows you to configure the display of high/low points and percentage changes between pivots.
Display Options
Display H/L Points
Toggle to show or hide pivot levels (high and low points) on the chart
%Change
Toggle to display percentage changes between pivot points
Color Settings
Positive % Color : Blue (customizable) - Used for positive percentage changes
Negative % Color : Pink (customizable) - Used for negative percentage changes
Precision Settings
Decimal Places: Set the number of decimal places (default: 2) for:
Pivot point price levels
Percentage change calculations
⚡ Power Trend Settings
This section controls how Power Trend information is visualized on your chart.
The Power Trend Settings panel allows you to configure how trend states are displayed and customize their visual appearance.
Example of Power Trend visualization showing both boxes (green background) and trend lines. The boxes indicate trend state while lines show trend transitions.
Display Options
Show Power Trend Line : Display trend states as lines on the chart
Show Boxes : Display trend states as boxes
Show Background : Display trend states as background colors
Power Trend Color Settings
On : Light green - Full power trend active
Resume : Light green - Power trend resuming
Off : Gray - Power trend inactive
With Floor : Yellow - Under pressure with support
No Floor : Orange - Under pressure without support
Power Trend Line Settings
Line Width : Set line thickness (default: 1)
Line Offset : Adjust line position (default: 5)
Power Trend Box Settings
Text Align : Set text alignment (left, center, right)
Text Position : Set vertical position (top, middle, bottom)
Size : Set box size (tiny, small, normal, large)
Color : Customize box background color
Power Trend States
Full Power (On)
Represents strongest market condition with maximum exposure of +7
Base maximum exposure of 5 plus 2 buffer signals
Buffer allows maintaining high exposure during normal pullbacks
2 sell signals reduce count from 7 to 5 without affecting base
Indicates very healthy market that can absorb normal profit-taking
Resume State
Shows successful market recovery after pressure period
Requires 10+ days without S2 minor, S9, or S13 signals
Must reestablish all initial strength conditions
Maintains same benefits as Full Power (+7 max, +2 floor)
Shows as light green in visualization
Under Pressure With Floor
First warning stage triggered by S2 minor or S13 signals
Reduces maximum exposure to +5
Maintains minimal protection with +1 floor
Suggests defensive positioning while keeping core positions
Shows as yellow in visualization
Under Pressure No Floor
Severe warning stage triggered by S9 signal
Maintains +5 maximum exposure but removes floor protection
Indicates higher risk of continued market decline
Requires careful position management
Shows as orange in visualization
Power Trend Off
Triggered by EMA/MA crossdowns with declining price
Can also be activated by S2 or Circuit Breaker signals
Maximum exposure limited to +5 with no buffer signals
Suggests focus on capital preservation
Shows as gray in visualization
Power Trend System Rules
Each state enforces strict exposure limits with automatic floor and ceiling adjustments
Power Trend can activate Buy Switch when entering Full Power state
Restraint Rule limits exposure to +2 until significant progress or B4 signal when starting from zero exposure
State transitions immediately update exposure limits and Buy Switch status
Distribution Cluster (S13) can move Power Trend to Under Pressure With Floor state
System maintains exposure floors to prevent panic selling while allowing flexibility below floor levels
Weekly SMAs Settings
The Weekly SMAs Settings panel allows you to configure the weekly moving averages display and calculations.
SMA 1: 10 periods (enabled), Red
Length: 10
Optional EMA toggle
Width: 1
SMA 2: 20 periods, Pink
Length: 20
Optional EMA toggle
Width: 1
SMA 3: 30 periods, Green
Length: 30
Optional EMA toggle
Width: 1
SMA 4: 40 periods (enabled), White
Length: 40
Optional EMA toggle
Width: 1
SMAs Settings
The SMAs Settings panel allows you to configure the daily moving averages display and calculations.
MA 1: 10 periods, Optional EMA, Pink
Length: 10
Optional EMA toggle
Width: 1
MA 2: 21 periods (enabled), EMA, Green
Length: 21
EMA enabled
Width: 1
MA 3: 50 periods (enabled), SMA, Red
Length: 50
EMA disabled
Width: 1
MA 4: 200 periods (enabled), SMA, White
Length: 200
EMA disabled
Width: 1
Volume Settings (NASDAQ & S&P 500)
This section controls volume data sources for market analysis. Proper volume settings are crucial for confirming market signals and analyzing institutional participation.
The Volume Settings panel allows you to configure volume data sources and custom ticker options for accurate market analysis.
Important Volume Source Information
TradingView's default volume data differs from IBD's Yahoo Finance data source
Current default settings (IXIC and TVOL) provide the most accurate results compared to IBD signals
Volume differences between TradingView and IBD are expected due to different data sources
Custom ticker options are provided for future compatibility with Yahoo Finance volume data
Volume Configuration
Nasdaq Volume Settings
Default Source: NASDAQ:IXIC (Nasdaq Composite Index)
Custom Ticker Option: USI:TVOL.NQ
Enable custom source by checking "Use Custom Nasdaq Ticker?"
Note: Custom ticker must be price-based for accurate volume analysis
S&P 500 Volume Settings
Default Source: TVOL (S&P 500 Total Volume)
Custom Ticker Option: USI:TVOL.NY
Enable custom source by checking "Use Custom S&P 500 Ticker?"
Note: Custom ticker must be price-based for accurate volume analysis
Volume Analysis Impact
Used for Distribution Day confirmation
Required for Follow-Through Day validation
Helps identify institutional buying/selling
Critical for Stalling Day detection
Recommendations
Keep default settings for most accurate current results
Only use custom tickers if you have confirmed price-based volume sources
Be aware that volume-based signals might slightly differ from IBD due to data source differences
Future updates may add Yahoo Finance volume compatibility
Market Status Table
The Market Status Table provides a real-time visual overview of current market conditions and signal status. Users can customize the table's appearance through the Market Exposure Table Settings.
The Market Status Table can be displayed in three different layouts: Basic (left), Detailed (center), and Stacked (right).
Layout Options
Hide Table
Completely hides the market status display
Basic (2 Columns)
Shows main indicators in two columns
Compact view without signal list
Ideal for minimalist chart view
Detailed (2 Columns with Signals)
Displays main indicators plus signal panel
Shows Buy and Sell signals in separate columns
Provides comprehensive market overview
Stacked (1 Column, Compact)
Vertical layout with single column
Most space-efficient option
Ideal for smaller chart windows
Main Indicators
• Market Exposure
Displayed as colored dots: 🟠 🟢 🟢 🟢 🟢
Shows current exposure level (0-100%)
(⚪ ⚪ ⚪ ⚪ ⚪): 0% exposure
(🟠 ⚪ ⚪ ⚪ ⚪): 30% exposure
(🟠 🟡 ⚪ ⚪ ⚪): 55% exposure
(🟠 🟡 🟢 ⚪ ⚪): 75% exposure
(🟠 🟡 🟢 🟢 ⚪): 90% exposure
(🟠 🟡 🟢 🟢 🟢): 100% exposure
• Key Status Indicators
Buy Switch: Shows ON (forced) or OFF status
Power Trend: Displays current state with floor and maximum values
Restraint Rule: Indicates ON or OFF status
Count / Signals Buffer: Shows current count and available buffer (e.g., "7 / (+0)")
Dist. Days / Cluster: Displays distribution day count and cluster status (e.g., "1 / 0")
• Signal Panel (Available in Detailed layout)
Lists all active Buy and Sell signals
Highlighted signals indicate currently active conditions
Green highlighting shows confirmed signals
Provides quick reference for all available signals
Status Indicator Colors
🟢 indicates "ON" or positive conditions (e.g., Buy Switch ON, Power Trend Full Power)
🟡 indicates "Under Pressure" or caution (e.g., Power Trend Under Pressure With Floor)
🟠 indicates "Under Pressure No Floor" or increased caution
🔴 indicates "OFF" or negative conditions (e.g., Buy Switch OFF, Power Trend OFF)
• Signal Colors
Green background for buy signals
Red background for sell signals
Black text on signal backgrounds for better visibility
• Number Formats
Count / Buffer signals shown as "7 / (+2)"
Distribution Days / Cluster count shown as "1 / 0"
Exposure percentage shown with dots (e.g., "90%")
Trading Wisdom - Market Risk Management
"The key to successful trading is not just knowing when to enter, but managing your exposure based on market health. Always check two critical indicators before any trade:
1. Market Exposure Levels
100% (5 dots): Full positions in strong market
90% (4 dots): Slightly reduced positions
75% (3 dots): Moderate positions, more cautious
55% (2 dots): Half positions only
30% (1 dot): Small positions only
0% (0 dots): Stay in cash
2. Distribution Days Risk Levels
1-2 Days: Normal market behavior
3 Days: Caution - reduce new positions
4+ Days: High risk - defensive positioning
5-6 Days: Consider moving to cash
Remember: It's better to miss an opportunity than to catch a falling market. Let the Market Exposure Table be your guide to smart position sizing."
Pro Tip: Make checking these two indicators part of your daily routine. They're your first line of defense against major drawdowns.
Conclusion
The IBD Market School indicator brings William O'Neil's proven methodology to TradingView, providing a comprehensive system for market analysis and risk management. This tool automates the complex task of tracking market signals while maintaining strict adherence to IBD's time-tested principles.
Key Features
Follows IBD's core methodology for identifying market direction
Automates tracking of Distribution Days, Follow-Through Days, and market signals
Provides clear market exposure guidance through the Power Trend system
Helps maintain discipline through systematic Buy Switch control
Offers multiple layers of risk management
Best Practices
Always check Market Exposure and Distribution Day count before making trades
Let the Buy Switch guide your market participation
Follow Power Trend states for proper position sizing
Use the default volume settings for most accurate signal generation
Monitor all confirmation rules for proper signal validation
Remember: This indicator is designed to replicate IBD's methodology as closely as possible within TradingView's environment. While it automates signal detection and exposure management, successful trading still requires discipline, patience, and strict adherence to risk management principles.
"The goal is not to be right about the market - it's to make money by following the market's signals and managing risk."
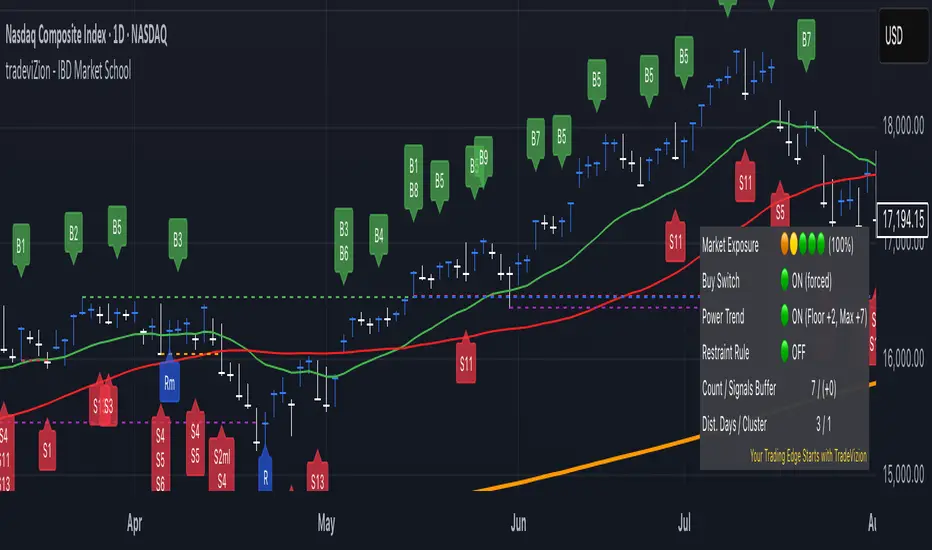
Multi-Timeframe Stochastic Alert [tradeviZion]# Multi-Timeframe Stochastic Alert : Complete User Guide
## 1. Introduction
### What is the Multi-Timeframe Stochastic Alert?
The Multi-Timeframe Stochastic Alert is an advanced technical analysis tool that helps traders identify potential trading opportunities by analyzing momentum across multiple timeframes. It combines the power of the stochastic oscillator with multi-timeframe analysis to provide more reliable trading signals.
### Key Features and Benefits
- Simultaneous analysis of 6 different timeframes
- Advanced alert system with customizable conditions
- Real-time visual feedback with color-coded signals
- Comprehensive data table with instant market insights
- Motivational trading messages for psychological support
- Flexible theme support for comfortable viewing
### How it Can Help Your Trading
- Identify stronger trends by confirming momentum across multiple timeframes
- Reduce false signals through multi-timeframe confirmation
- Stay informed of market changes with customizable alerts
- Make more informed decisions with comprehensive market data
- Maintain trading discipline with clear visual signals
## 2. Understanding the Display
### The Stochastic Chart
The main chart displays three key components:
1. ** K-Line (Fast) **: The primary stochastic line (default color: green)
2. ** D-Line (Slow) **: The signal line (default color: red)
3. ** Reference Lines **:
- Overbought Level (80): Upper dashed line
- Middle Line (50): Center dashed line
- Oversold Level (20): Lower dashed line
### The Information Table
The table provides a comprehensive view of stochastic readings across all timeframes. Here's what each column means:
#### Column Explanations:
1. ** Timeframe **
- Shows the time period for each row
- Example: "5" = 5 minutes, "15" = 15 minutes, etc.
2. ** K Value **
- The fast stochastic line value (0-100)
- Higher values indicate stronger upward momentum
- Lower values indicate stronger downward momentum
3. ** D Value **
- The slow stochastic line value (0-100)
- Helps confirm momentum direction
- Crossovers with K-line can signal potential trades
4. ** Status **
- Shows current momentum with symbols:
- ▲ = Increasing (bullish)
- ▼ = Decreasing (bearish)
- Color matches the trend direction
5. ** Trend **
- Shows the current market condition:
- "Overbought" (above 80)
- "Bullish" (above 50)
- "Bearish" (below 50)
- "Oversold" (below 20)
#### Row Explanations:
1. ** Title Row **
- Shows "🎯 Multi-Timeframe Stochastic"
- Indicates the indicator is active
2. ** Header Row **
- Contains column titles
- Dark blue background for easy reading
3. ** Timeframe Rows **
- Six rows showing different timeframe analyses
- Each row updates independently
- Color-coded for easy trend identification
4. **Message Row**
- Shows rotating motivational messages
- Updates every 5 bars
- Helps maintain trading discipline
### Visual Indicators and Colors
- ** Green Background **: Indicates bullish conditions
- ** Red Background **: Indicates bearish conditions
- ** Color Intensity **: Shows strength of the signal
- ** Background Highlights **: Appear when alert conditions are met
## 3. Core Settings Groups
### Stochastic Settings
These settings control the core calculation of the stochastic oscillator.
1. ** Length (Default: 14) **
- What it does: Determines the lookback period for calculations
- Higher values (e.g., 21): More stable, fewer signals
- Lower values (e.g., 8): More sensitive, more signals
- Recommended:
* Day Trading: 8-14
* Swing Trading: 14-21
* Position Trading: 21-30
2. ** Smooth K (Default: 3) **
- What it does: Smooths the main stochastic line
- Higher values: Smoother line, fewer false signals
- Lower values: More responsive, but more noise
- Recommended:
* Day Trading: 2-3
* Swing Trading: 3-5
* Position Trading: 5-7
3. ** Smooth D (Default: 3) **
- What it does: Smooths the signal line
- Works in conjunction with Smooth K
- Usually kept equal to or slightly higher than Smooth K
- Recommended: Keep same as Smooth K for consistency
4. ** Source (Default: Close) **
- What it does: Determines price data for calculations
- Options: Close, Open, High, Low, HL2, HLC3, OHLC4
- Recommended: Stick with Close for most reliable signals
### Timeframe Settings
Controls the multiple timeframes analyzed by the indicator.
1. ** Main Timeframes (TF1-TF6) **
- TF1 (Default: 10): Shortest timeframe for quick signals
- TF2 (Default: 15): Short-term trend confirmation
- TF3 (Default: 30): Medium-term trend analysis
- TF4 (Default: 30): Additional medium-term confirmation
- TF5 (Default: 60): Longer-term trend analysis
- TF6 (Default: 240): Major trend confirmation
Recommended Combinations:
* Scalping: 1, 3, 5, 15, 30, 60
* Day Trading: 5, 15, 30, 60, 240, D
* Swing Trading: 15, 60, 240, D, W, M
2. ** Wait for Bar Close (Default: true) **
- What it does: Controls when calculations update
- True: More reliable but slightly delayed signals
- False: Faster signals but may change before bar closes
- Recommended: Keep True for more reliable signals
### Alert Settings
#### Main Alert Settings
1. ** Enable Alerts (Default: true) **
- Master switch for all alert notifications
- Toggle this off when you don't want any alerts
- Useful during testing or when you want to focus on visual signals only
2. ** Alert Condition (Options) **
- "Above Middle": Bullish momentum alerts only
- "Below Middle": Bearish momentum alerts only
- "Both": Alerts for both directions
- Recommended:
* Trending Markets: Choose direction matching the trend
* Ranging Markets: Use "Both" to catch reversals
* New Traders: Start with "Both" until you develop a specific strategy
3. ** Alert Frequency **
- "Once Per Bar": Immediate alerts during the bar
- "Once Per Bar Close": Alerts only after bar closes
- Recommended:
* Day Trading: "Once Per Bar" for quick reactions
* Swing Trading: "Once Per Bar Close" for confirmed signals
* Beginners: "Once Per Bar Close" to reduce false signals
#### Timeframe Check Settings
1. ** First Check (TF1) **
- Purpose: Confirms basic trend direction
- Alert Triggers When:
* For Bullish: Stochastic is above middle line (50)
* For Bearish: Stochastic is below middle line (50)
* For Both: Triggers in either direction based on position relative to middle line
- Settings:
* Enable/Disable: Turn first check on/off
* Timeframe: Default 5 minutes
- Best Used For:
* Quick trend confirmation
* Entry timing
* Scalping setups
2. ** Second Check (TF2) **
- Purpose: Confirms both position and momentum
- Alert Triggers When:
* For Bullish: Stochastic is above middle line AND both K&D lines are increasing
* For Bearish: Stochastic is below middle line AND both K&D lines are decreasing
* For Both: Triggers based on position and direction matching current condition
- Settings:
* Enable/Disable: Turn second check on/off
* Timeframe: Default 15 minutes
- Best Used For:
* Trend strength confirmation
* Avoiding false breakouts
* Day trading setups
3. ** Third Check (TF3) **
- Purpose: Confirms overall momentum direction
- Alert Triggers When:
* For Bullish: Both K&D lines are increasing (momentum confirmation)
* For Bearish: Both K&D lines are decreasing (momentum confirmation)
* For Both: Triggers based on matching momentum direction
- Settings:
* Enable/Disable: Turn third check on/off
* Timeframe: Default 30 minutes
- Best Used For:
* Major trend confirmation
* Swing trading setups
* Avoiding trades against the main trend
Note: All three conditions must be met simultaneously for the alert to trigger. This multi-timeframe confirmation helps reduce false signals and provides stronger trade setups.
#### Alert Combinations Examples
1. ** Conservative Setup **
- Enable all three checks
- Use "Once Per Bar Close"
- Timeframe Selection Example:
* First Check: 15 minutes
* Second Check: 1 hour (60 minutes)
* Third Check: 4 hours (240 minutes)
- Wider gaps between timeframes reduce noise and false signals
- Best for: Swing trading, beginners
2. ** Aggressive Setup **
- Enable first two checks only
- Use "Once Per Bar"
- Timeframe Selection Example:
* First Check: 5 minutes
* Second Check: 15 minutes
- Closer timeframes for quicker signals
- Best for: Day trading, experienced traders
3. ** Balanced Setup **
- Enable all checks
- Use "Once Per Bar"
- Timeframe Selection Example:
* First Check: 5 minutes
* Second Check: 15 minutes
* Third Check: 1 hour (60 minutes)
- Balanced spacing between timeframes
- Best for: All-around trading
### Visual Settings
#### Alert Visual Settings
1. ** Show Background Color (Default: true) **
- What it does: Highlights chart background when alerts trigger
- Benefits:
* Makes signals more visible
* Helps spot opportunities quickly
* Provides visual confirmation of alerts
- When to disable:
* If using multiple indicators
* When preferring a cleaner chart
* During manual backtesting
2. ** Background Transparency (Default: 90) **
- Range: 0 (solid) to 100 (invisible)
- Recommended Settings:
* Clean Charts: 90-95
* Multiple Indicators: 85-90
* Single Indicator: 80-85
- Tip: Adjust based on your chart's overall visibility
3. ** Background Colors **
- Bullish Background:
* Default: Green
* Indicates upward momentum
* Customizable to match your theme
- Bearish Background:
* Default: Red
* Indicates downward momentum
* Customizable to match your theme
#### Level Settings
1. ** Oversold Level (Default: 20) **
- Traditional Setting: 20
- Adjustable Range: 0-100
- Usage:
* Lower values (e.g., 10): More conservative
* Higher values (e.g., 30): More aggressive
- Trading Applications:
* Potential bullish reversal zone
* Support level in uptrends
* Entry point for long positions
2. ** Overbought Level (Default: 80) **
- Traditional Setting: 80
- Adjustable Range: 0-100
- Usage:
* Lower values (e.g., 70): More aggressive
* Higher values (e.g., 90): More conservative
- Trading Applications:
* Potential bearish reversal zone
* Resistance level in downtrends
* Exit point for long positions
3. ** Middle Line (Default: 50) **
- Purpose: Trend direction separator
- Applications:
* Above 50: Bullish territory
* Below 50: Bearish territory
* Crossing 50: Potential trend change
- Trading Uses:
* Trend confirmation
* Entry/exit trigger
* Risk management level
#### Color Settings
1. ** Bullish Color (Default: Green) **
- Used for:
* K-Line (Main stochastic line)
* Status symbols when trending up
* Trend labels for bullish conditions
- Customization:
* Choose colors that stand out
* Match your trading platform theme
* Consider color blindness accessibility
2. ** Bearish Color (Default: Red) **
- Used for:
* D-Line (Signal line)
* Status symbols when trending down
* Trend labels for bearish conditions
- Customization:
* Choose contrasting colors
* Ensure visibility on your chart
* Consider monitor settings
3. ** Neutral Color (Default: Gray) **
- Used for:
* Middle line (50 level)
- Customization:
* Should be less prominent
* Easy on the eyes
* Good background contrast
### Theme Settings
1. **Color Theme Options**
- Dark Theme (Default):
* Dark background with white text
* Optimized for dark chart backgrounds
* Reduces eye strain in low light
- Light Theme:
* Light background with black text
* Better visibility in bright conditions
- Custom Theme:
* Use your own color preferences
2. ** Available Theme Colors **
- Table Background
- Table Text
- Table Headers
Note: The theme affects only the table display colors. The stochastic lines and alert backgrounds use their own color settings.
### Table Settings
#### Position and Size
1. ** Table Position **
- Options:
* Top Right (Default)
* Middle Right
* Bottom Right
* Top Left
* Middle Left
* Bottom Left
- Considerations:
* Chart space utilization
* Personal preference
* Multiple monitor setups
2. ** Text Sizes **
- Title Size Options:
* Tiny: Minimal space usage
* Small: Compact but readable
* Normal (Default): Standard visibility
* Large: Enhanced readability
* Huge: Maximum visibility
- Data Size Options:
* Recommended: One size smaller than title
* Adjust based on screen resolution
* Consider viewing distance
3. ** Empowering Messages **
- Purpose:
* Maintain trading discipline
* Provide psychological support
* Remind of best practices
- Rotation:
* Changes every 5 bars
* Categories include:
- Market Wisdom
- Strategy & Discipline
- Mindset & Growth
- Technical Mastery
- Market Philosophy
## 4. Setting Up for Different Trading Styles
### Day Trading Setup
1. **Timeframes**
- Primary: 5, 15, 30 minutes
- Secondary: 1H, 4H
- Alert Settings: "Once Per Bar"
2. ** Stochastic Settings **
- Length: 8-14
- Smooth K/D: 2-3
- Alert Condition: Match market trend
3. ** Visual Settings **
- Background: Enabled
- Transparency: 85-90
- Theme: Based on trading hours
### Swing Trading Setup
1. ** Timeframes **
- Primary: 1H, 4H, Daily
- Secondary: Weekly
- Alert Settings: "Once Per Bar Close"
2. ** Stochastic Settings **
- Length: 14-21
- Smooth K/D: 3-5
- Alert Condition: "Both"
3. ** Visual Settings **
- Background: Optional
- Transparency: 90-95
- Theme: Personal preference
### Position Trading Setup
1. ** Timeframes **
- Primary: Daily, Weekly
- Secondary: Monthly
- Alert Settings: "Once Per Bar Close"
2. ** Stochastic Settings **
- Length: 21-30
- Smooth K/D: 5-7
- Alert Condition: "Both"
3. ** Visual Settings **
- Background: Disabled
- Focus on table data
- Theme: High contrast
## 5. Troubleshooting Guide
### Common Issues and Solutions
1. ** Too Many Alerts **
- Cause: Settings too sensitive
- Solutions:
* Increase timeframe intervals
* Use "Once Per Bar Close"
* Enable fewer timeframe checks
* Adjust stochastic length higher
2. ** Missed Signals **
- Cause: Settings too conservative
- Solutions:
* Decrease timeframe intervals
* Use "Once Per Bar"
* Enable more timeframe checks
* Adjust stochastic length lower
3. ** False Signals **
- Cause: Insufficient confirmation
- Solutions:
* Enable all three timeframe checks
* Use larger timeframe gaps
* Wait for bar close
* Confirm with price action
4. ** Visual Clarity Issues **
- Cause: Poor contrast or overlap
- Solutions:
* Adjust transparency
* Change theme settings
* Reposition table
* Modify color scheme
### Best Practices
1. ** Getting Started **
- Start with default settings
- Use "Both" alert condition
- Enable all timeframe checks
- Wait for bar close
- Monitor for a few days
2. ** Fine-Tuning **
- Adjust one setting at a time
- Document changes and results
- Test in different market conditions
- Find your optimal timeframe combination
- Balance sensitivity with reliability
3. ** Risk Management **
- Don't trade against major trends
- Confirm signals with price action
- Use appropriate position sizing
- Set clear stop losses
- Follow your trading plan
4. ** Regular Maintenance **
- Review settings weekly
- Adjust for market conditions
- Update color scheme for visibility
- Clean up chart regularly
- Maintain trading journal
## 6. Tips for Success
1. ** Entry Strategies **
- Wait for all timeframes to align
- Confirm with price action
- Use proper position sizing
- Consider market conditions
2. ** Exit Strategies **
- Trail stops using indicator levels
- Take partial profits at targets
- Honor your stop losses
- Don't fight the trend
3. ** Psychology **
- Stay disciplined with settings
- Don't override system signals
- Keep emotions in check
- Learn from each trade
4. ** Continuous Improvement **
- Record your trades
- Review performance regularly
- Adjust settings gradually
- Stay educated on markets

FibExtender [tradeviZion]FibExtender : A Guide to Identifying Resistance with Fibonacci Levels
Introduction
Fibonacci levels are essential tools in technical analysis, helping traders identify potential resistance and support zones in trending markets. FibExtender is designed to make this analysis accessible to traders at all levels, especially beginners, by automating the process of plotting Fibonacci extensions. With FibExtender, you can visualize potential resistance levels quickly, empowering you to make more informed trading decisions without manually identifying every pivot point. In this article, we’ll explore how FibExtender works, guide you step-by-step in using it, and share insights for both beginner and advanced users.
What is FibExtender ?
FibExtender is an advanced tool that automates Fibonacci extension plotting based on significant pivot points in price movements. Fibonacci extensions are percentages based on prior price swings, often used to forecast potential resistance zones where price might reverse or consolidate. By automatically marking these Fibonacci levels on your chart, FibExtender saves time and reduces the complexity of technical analysis, especially for users unfamiliar with calculating and plotting these levels manually.
FibExtender not only identifies Fibonacci levels but also provides a customizable framework where you can adjust anchor points, colors, and level visibility to suit your trading strategy. This customization allows traders to tailor the indicator to fit different market conditions and personal preferences.
Key Features of FibExtender
FibExtender offers several features to make Fibonacci level analysis easier and more effective. Here are some highlights:
Automated Fibonacci Level Identification : The script automatically detects recent swing lows and pivot points to anchor Fibonacci extensions, allowing you to view potential resistance levels with minimal effort.
Customizable Fibonacci Levels : Users can adjust the specific Fibonacci levels they want to display (e.g., 0.618, 1.0, 1.618), enabling a more focused analysis based on preferred ratios. Each level can be color-coded for visual clarity.
Dual Anchor Points : FibExtender allows you to choose between anchoring levels from either the last pivot low or a recent swing low, depending on your preference. This flexibility helps in aligning Fibonacci levels with key market structures.
Transparency and Visual Hierarchy : FibExtender automatically adjusts the transparency of levels based on their "sequence age," creating a subtle visual hierarchy. Older levels appear slightly faded, helping you focus on more recent, potentially impactful levels.
Connection Lines for Context : FibExtender draws connecting lines from recent lows to pivot highs, allowing users to visualize the price movements that generated each Fibonacci extension level.
Step-by-Step Guide for Beginners
Let’s walk through how to use the FibExtender script on a TradingView chart. This guide will ensure that you’re able to set it up and interpret the key information displayed by the indicator.
Step 1: Adding FibExtender to Your Chart
Open your TradingView chart and select the asset you wish to analyze.
Search for “FibExtender ” in the Indicators section.
Click to add the indicator to your chart, and it will automatically plot Fibonacci levels based on recent pivot points.
Step 2: Customizing Fibonacci Levels
Adjust Levels : Under the "Fibonacci Settings" tab, you can enable or disable specific levels, such as 0.618, 1.0, or 1.618. You can also change the color for each level to improve visibility.
Set Anchor Points : Choose between "Last Pivot Low" and "Recent Swing Low" as your Fibonacci anchor point. If you want a broader view, choose "Recent Swing Low"; if you prefer tighter levels, "Last Pivot Low" may be more suitable.
Fib Line Length : Modify the line length for Fibonacci levels to make them more visible on your chart.
Step 3: Spotting Visual Clusters (Manual Analysis)
Identify Potential Resistance Clusters : Look for areas on your chart where multiple Fibonacci levels appear close together. For example, if you see 1.0, 1.272, and 1.618 levels clustered within a small price range, this may indicate a stronger resistance zone.
Why Clusters Matter : Visual clusters often signify areas where traders expect heightened price reaction. When levels are close, it suggests that resistance may be reinforced by multiple significant ratios, making it harder for price to break through. Use these clusters to anticipate potential pullbacks or consolidation areas.
Step 4: Observing the Price Action Around Fibonacci Levels
As price approaches these identified levels, watch for any slowing momentum or reversal patterns, such as doji candles or bearish engulfing formations, that might confirm resistance.
Adjust Strategy Based on Resistance : If price hesitates or reverses at a clustered resistance zone, it may be a signal to secure profits or tighten stops on a long position.
Advanced Insights (for Intermediate to Advanced Users)
For users interested in the technical workings of FibExtender, this section provides insights into how the indicator functions on a code level.
Pivot Point and Swing Detection
FibExtender uses a pivot-high and pivot-low detection function to identify significant price points. The upFractal and dnFractal variables detect these levels based on recent highs and lows, creating the basis for Fibonacci extension calculations. Here’s an example of the code used for this detection:
// Fractal Calculations
upFractal = ta.pivothigh(n, n)
dnFractal = ta.pivotlow(n, n)
By setting the number of periods for n, users can adjust the sensitivity of the script to recent price swings.
Fibonacci Level Calculation
The following function calculates the Fibonacci levels based on the selected pivot points and applies each level’s specific ratio (e.g., 0.618, 1.618) to project extensions above the recent price swing.
calculateFibExtensions(float startPrice, float highPrice, float retracePrice) =>
fibRange = highPrice - startPrice
var float levels = array.new_float(0)
array.clear(levels)
if array.size(fibLevels) > 0
for i = 0 to array.size(fibLevels) - 1
level = retracePrice + (fibRange * array.get(fibLevels, i))
array.push(levels, level)
levels
This function iterates over each level enabled by the user, calculating extensions by multiplying the price range by the corresponding Fibonacci ratio.
Example Use Case: Identifying Resistance in Microsoft (MSFT)
To better understand how FibExtender highlights resistance, let’s look at Microsoft’s stock chart (MSFT), as shown in the image. The chart displays several Fibonacci levels extending upward from a recent pivot low around $408.17. Here’s how you can interpret the chart:
Clustered Resistance Levels : In the chart, note the grouping of several Fibonacci levels in the range of $450–$470. These levels, particularly when tightly packed, suggest a zone where Microsoft may encounter stronger resistance, as multiple Fibonacci levels signal potential barriers.
Applying Trading Strategies : As price approaches this clustered resistance, traders can watch for weakening momentum. If price begins to stall, it may be wise to lock in profits on long positions or set tighter stop-loss orders.
Observing Momentum Reversals : Look for specific candlestick patterns as price nears these levels, such as bearish engulfing candles or doji patterns. Such patterns can confirm resistance, helping you make informed decisions on whether to exit or manage your position.
Conclusion: Harnessing Fibonacci Extensions with FibExtender
FibExtender is a powerful tool for identifying potential resistance levels without the need for manual Fibonacci calculations. It automates the detection of key swing points and projects Fibonacci extensions, offering traders a straightforward approach to spotting potential resistance zones. For beginners, FibExtender provides a user-friendly gateway to technical analysis, helping you visualize levels where price may react.
For those with a bit more experience, the indicator offers insight into pivot points and Fibonacci calculations, enabling you to fine-tune the analysis for different market conditions. By carefully observing price reactions around clustered levels, users can identify areas of stronger resistance and refine their trade management strategies accordingly.
FibExtender is not just a tool but a framework for disciplined analysis. Using Fibonacci levels for guidance can support your trading decisions, helping you recognize areas where price might struggle or reverse. Integrating FibExtender into your trading strategy can simplify the complexity of Fibonacci extensions and enhance your understanding of resistance dynamics.
Note: Always practice proper risk management and thoroughly test the indicator to ensure it aligns with your trading strategy. Past performance is not indicative of future results.
Trade smarter with TradeVizion—unlock your trading potential today!

WillStop Pro [tradeviZion]WillStop Pro : A Step-by-Step Guide for Beginners to Master Trend Trading
Welcome to an in-depth guide to the WillStop Pro indicator. This article will walk you through the key features, how to use them effectively, and how this tool can help you navigate the markets confidently. WillStop Pro is based on principles established by Larry Williams, a well-known figure in trading, and aims to help you manage trades more effectively without overcomplicating things.
This guide will help you understand the basics of the WillStop Pro indicator, how to interpret its signals, and how to use it step-by-step to manage risk and identify opportunities in your trading journey. We will also cover the underlying logic and calculations for advanced users interested in more details.
What is the WillStop Pro Indicator?
The WillStop Pro indicator is a user-friendly tool that helps traders establish stop levels dynamically. It helps you figure out optimal points to enter or exit trades, while managing risk effectively during changing market conditions. The indicator tracks trending markets and sets price levels as stops for ongoing trades, making it suitable both for deciding when to enter and exit trades.
The indicator is beginner-friendly because it simplifies complex calculations and presents the results visually. This allows traders to focus more on their decision-making process instead of spending time with complex analysis.
WillStop Pro adapts to different market conditions, whether you're trading stocks, forex, commodities, or cryptocurrencies. It adjusts stop levels dynamically based on current market momentum, providing a practical way to manage both risk and reward.
Another significant benefit of WillStop Pro is that it works well with other indicators. Beginners can use it on its own or combine it with other tools like moving averages or oscillators to form a comprehensive trading strategy. Whether you are trading daily or looking at longer-term trends, WillStop Pro helps you manage your trades effectively.
Key Features of WillStop Pro
Dynamic Stop Levels : WillStop Pro calculates real-time stop levels for both long (buy) and short (sell) positions. This helps you protect your profits and reduce risk. The stop levels adjust based on the current market environment, making them more adaptable compared to fixed stop levels.
Advanced Stop Settings : There are optional settings to make the stop calculations more advanced, which take into consideration previous price movements to refine where the stops should be placed. These settings provide more precise control over your trades.
Break Signals and Alerts : The indicator provides visual signals, like arrows, to show when a stop level has been broken. This makes it easier for you to identify possible reversals and understand when the market direction is changing.
Comprehensive Table Display : A small table on the chart shows the current trend, the stop level, and whether advanced mode is active. This simple display provides an overview of the market, making decision-making easier.
Based on Larry Williams' Methodology : WillStop Pro builds upon Larry Williams' ideas, which are designed to capture major market trends while managing risk effectively. It provides a systematic way to follow these strategies without requiring deep technical analysis skills.
How Are Stop Levels Calculated? (For Advanced Users)
The WillStop Pro indicator determines stop levels by evaluating highs, lows, and closing prices over a specific lookback period. It uses this information to identify key points that justify adjusting your stop level, and there are separate approaches for both long and short positions.
Below, we explain the mathematical logic behind the stop calculations, along with some code snippets to give advanced users a clearer understanding.
For Long Stops (buy positions): The indicator looks for the highest closing price within the lookback period and continues until it finds three valid bars that meet certain criteria. Stops are adjusted to skip bars that have consecutive upward closes to ensure that the stop is placed at a level that offers solid support. Specifically, the function iterates over recent bars to determine the highest closing value, and checks for specific conditions before finalizing the stop level. Here is an excerpt of the relevant code:
getTrueLow(idx) => math.min(low , close )
findStopLevels() =>
float highestClose = close
int highestCloseIndex = 0
for i = 0 to lookback
if close > highestClose
highestClose := close
highestCloseIndex := i
// Logic to adjust based on up close skipping
int longCount = 0
int longCurrentIndex = highestCloseIndex
while longCount < 3 and longCurrentIndex < 100
if not isInsideBar(longCurrentIndex)
longCount += 1
longCurrentIndex += 1
// Determine the lowest low for the stop level
float longStopLevel = high * 2
for i = searchIndex to highestCloseIndex
longStopLevel := math.min(longStopLevel, getTrueLow(i))
// Apply offset
longStopLevel := longStopLevel - (offsetTicks * tickSize)
In this code snippet, the function findStopLevels() calculates the long stop level by first identifying the highest close within the lookback period and then finding a suitable support level while skipping certain conditions, such as inside bars or consecutive upward closes. Finally, the user-defined offset ( offsetTicks ) is applied to determine the stop level.
For Short Stops (sell positions): Similarly, the indicator finds the lowest closing price within the lookback period and then identifies three bars that fit the conditions for a short stop. It avoids using bars with consecutive down closes to help find a more robust resistance level. Here's a relevant code snippet:
getTrueHigh(idx) => math.max(high , close )
findStopLevels() =>
float lowestClose = close
int lowestCloseIndex = 0
for i = 0 to lookback
if close < lowestClose
lowestClose := close
lowestCloseIndex := i
// Logic to adjust based on down close skipping
int shortCount = 0
int shortCurrentIndex = lowestCloseIndex
while shortCount < 3 and shortCurrentIndex < 100
if not isInsideBar(shortCurrentIndex)
shortCount += 1
shortCurrentIndex += 1
// Determine the highest high for the stop level
float shortStopLevel = 0
for i = searchIndex to lowestCloseIndex
shortStopLevel := math.max(shortStopLevel, getTrueHigh(i))
// Apply offset
shortStopLevel := shortStopLevel + (offsetTicks * tickSize)
Here, findStopLevels() calculates the short stop level by finding the lowest closing price within the lookback period. It then determines the highest value that acts as a resistance level, excluding bars that do not fit certain criteria.
Volume Confirmation for Alert Accuracy : To further enhance the stop level accuracy, volume is used as a confirmation filter. The average volume (volAvg) is calculated over a 20-period moving average, and alerts are only generated if the volume exceeds a defined threshold (volMultiplier). This ensures that price movements are significant enough to consider as meaningful signals.
volAvg = ta.sma(volume, 20)
isVolumeConfirmed() =>
result = requireVolumeConfirmation ? volume > (volAvg * volMultiplier) : true
result
This additional logic ensures that stop level breaks or adjustments are not triggered during periods of low trading activity, thus enhancing the reliability of the generated signals.
These calculations are at the core of WillStop Pro's ability to determine dynamic stop levels that respond effectively to market movements, helping traders manage risk by placing stops at levels that make sense given historical price and volume data.
How to Identify Opportunities with WillStop Pro
WillStop Pro provides various signals that help you decide when to enter or exit a trade:
When a Stop Level is Broken: If a stop level (support for long positions or resistance for short positions) is broken, it may indicate a reversal. WillStop Pro visually plots arrows whenever a stop level is breached, making it easy for you to see where changes might occur. This feature helps traders identify momentum shifts quickly.
Support and Resistance Levels: The indicator plots support and resistance levels, which show key zones to watch for opportunities. These levels often act as psychological barriers in the market, where price action may either reverse or stall temporarily.
Dynamic State Management: The indicator shifts between long and short states based on price action, providing real-time feedback. This helps traders stick to their trading plan without second-guessing the market.
A major advantage of WillStop Pro is that it responds well to changing market conditions. By identifying when key support or resistance levels break, it allows you to adjust your strategies and react to new opportunities accordingly. Whether the market is trending strongly or staying within a range, WillStop Pro provides valuable information to help guide your trades.
Setting Up Alerts
Alerts are an important feature in trading, especially when you can’t be in front of your charts all the time. WillStop Pro has been enhanced to include flexible alert settings to help you stay on top of your trades without constantly monitoring the charts.
Enable Alerts: There is a master switch to enable or disable all alerts. This way, you can control whether you want to be notified of events at any time.
Alert Frequency: Choose between receiving alerts Once Per Bar or Once Per Bar Close . This helps you manage the frequency of alerts and decide if you need real-time updates or want confirmation after a bar closes.
Break Alerts: These alerts notify you when a stop level has been broken. This can help you catch potential reversals or trading opportunities as soon as they happen.
Strong Break Alerts: Alerts are available for strong breaks, which occur when the price breaks stop levels with confirmation based on additional price, volume, and momentum criteria. These alerts help identify significant shifts in the market.
Level Change Alerts: These alerts tell you whenever a new stop level is calculated, keeping you updated about changes in market dynamics. You can set a Minimum Level Change % to ensure that alerts are only triggered when the stop level changes significantly.
Require Volume Confirmation: You can opt to receive alerts only if the volume is above a certain threshold. This confirmation helps reduce false signals by ensuring that significant price changes are backed by increased trading activity.
Volume Multiplier: The volume multiplier allows you to set a minimum volume requirement that must be met for an alert to trigger. This ensures that alerts are triggered only when there is sufficient trading interest.
Here is a part of the updated alert logic that has been implemented in the indicator:
// Alert on break conditions
if alertsEnabled
if alertOnBreaks
if longStopBroken and isVolumeConfirmed()
alert(createAlertMessage("Support Break - Short Signal", useAdvancedStops), alertFreq)
if shortStopBroken and isVolumeConfirmed()
alert(createAlertMessage("Resistance Break - Long Signal", useAdvancedStops), alertFreq)
// Strong break alerts
if alertOnStrongBreaks
if longStopBroken and isStrongBreak(false)
alert(createAlertMessage("Strong Support Break - Short Signal", useAdvancedStops), alertFreq)
if shortStopBroken and isStrongBreak(true)
alert(createAlertMessage("Strong Resistance Break - Long Signal", useAdvancedStops), alertFreq)
// Level change alerts
if alertOnLevelChanges and isSignificantChange() and isVolumeConfirmed()
alert(createAlertMessage("Significant Level Change", useAdvancedStops), alertFreq)
Setting alerts allows you to react to market changes without having to watch the charts constantly. Alerts are particularly helpful if you have other responsibilities and can’t be actively monitoring your trades all day.
Understanding the Table Display
The WillStop Pro indicator provides a status table that gives an overview of the current market state. Here’s what the table shows:
Indicator Status: The table indicates whether the indicator is in a LONG or SHORT state. This helps you quickly understand the market trend.
Stop Level: The active stop level is shown, whether it is acting as support (long) or resistance (short). This is important for knowing where to set your protective stops.
Mode: The table also displays whether the advanced calculation mode is being used. This keeps you informed about how stop levels are being calculated and why they are positioned where they are.
Empowering Messages: The table also includes motivational messages that rotate periodically, such as 'Trade with Clarity, Stop with Precision' and 'Let Winners Run, Cut Losses Short.' These messages are designed to keep you focused, motivated, and disciplined during your trading journey.
The table is simple and easy to follow, helping you maintain discipline in your trading plan. By having all the essential information in one place, the table reduces the need to make quick, emotional decisions and promotes more thoughtful analysis.
Tips for Using WillStop Pro Effectively
Here are some practical ways to make the most of the WillStop Pro indicator:
Start with Default Settings: If you’re new to the indicator, start with the default settings. This will give you an idea of how stop levels are determined and how they adjust to different markets.
Experiment with Advanced Settings: Once you are comfortable, try using the advanced stop settings to see how they refine the stop levels. This can be useful in certain market conditions to improve accuracy.
Use Alerts to Stay Updated: Set up alerts for when a stop level is broken or when new levels are calculated. This helps you take action without constantly watching the chart. Swing traders may find alerts especially helpful for monitoring longer-term moves.
Monitor the Status Table: Keep an eye on the status table to understand the current market condition. Whether the indicator is in a LONG or SHORT state can help you make more informed decisions.
Focus on Risk Management: WillStop Pro is designed to help you manage risk by dynamically adjusting stop levels. Make sure you are using these levels to protect your trades, especially during strong trends or volatile periods.
Acknowledging Larry Williams' Influence
WillStop Pro is inspired by the work of Larry Williams, who described the approach as one of his best trading techniques. His method aims to ride major market trends while reducing the risk of giving back gains during corrections. WillStop Pro builds upon this approach, adding features like advanced stop settings and visual alerts that make it easier to apply in modern markets.
By using WillStop Pro, you are essentially leveraging a well-established trading strategy with additional tools that help improve its effectiveness. The indicator is designed to provide a reliable way to manage trades, stay on top of market conditions, and reduce emotional decision-making.
Conclusion: Why WillStop Pro is Great for Beginners and Advanced Users
The WillStop Pro is a powerful yet easy-to-use tool that helps traders ride trends while managing risk during market corrections. It can be used both for entering and exiting trades, and its visual features make it accessible for those who are new to trading, while the underlying logic appeals to advanced users seeking greater control and understanding.
WillStop Pro is more than just a tool for setting stops. It is a comprehensive solution for managing trades, with features like dynamic stop levels, customizable alerts, and an easy-to-understand status table. This combination of simplicity and advanced features makes it suitable for beginners as well as more experienced traders.
We hope this guide helps you get started with WillStop Pro and improves your trading confidence. Remember to start with the basics, explore the advanced features, and set alerts to stay informed without getting overwhelmed. Whether you’re just beginning or want to simplify your strategy, WillStop Pro is a valuable tool to have in your trading arsenal.
Trading can be challenging, but the right tools make it more manageable. WillStop Pro helps you keep track of market movements, identify opportunities, and manage risk effectively. Give it a try and see how it can improve your trading decisions and help you navigate the markets more efficiently.
By incorporating WillStop Pro into your strategy, you are following a systematic approach that has been refined over time. It’s designed to help you make sense of the markets, plan your trades, and manage your risks with greater clarity and confidence.
Note: Always practice proper risk management and thoroughly test the indicator to ensure it aligns with your trading strategy. Past performance is not indicative of future results.
Trade smarter with TradeVizion—unlock your trading potential today!

Larry Williams Valuation Index [tradeviZion]Larry Williams Valuation Index
Welcome to the Larry Williams Valuation Index by tradeviZion! This script is an interpretation of Larry Williams' famous WillVal (Valuation) Index, originally developed in 1990 to help traders determine whether a market or asset is overvalued or undervalued. We've extended it to support multiple securities and offer alerts for different valuation levels, helping you make more informed trading decisions.
What is the Valuation Index?
The Valuation Index measures how a security's current price compares to its historical price action. It helps identify whether the security is overvalued (priced too high), undervalued (priced too low), or in a normal range.
This version supports multiple securities and uses valuation parameters to help you assess the relative valuation of three securities simultaneously. It can help you determine the best times to enter (buy) or exit (sell) the market.
Key Features
Multi-Security Analysis: Analyze up to three securities simultaneously to get a broader view of market conditions.
Valuation Levels: Automatically calculate overvaluation and undervaluation levels or set manual levels for consistent analysis.
Custom Alerts: Create custom alerts when securities move between overvalued, undervalued, or normal ranges.
Customizable Table Display: Display a table with valuation values and their status on the chart.
Getting Started
Step 1: Adding the Script to Your Chart
First, add the Larry Williams Valuation Index script to your chart on TradingView. The script is designed to work with any timeframe, but for best results, use weekly or daily timeframes for a longer-term perspective.
Step 2: Configuring Securities
The script allows you to analyze up to three different securities :
Security 1 (Default: DXY)
Security 2 (Default: GC1!)
Security 3 (Default: ZB1!)
You can enable or disable each security individually.
Custom Timeframe Option: You have the option to select a custom timeframe for analysis. This allows you to see whether the security is overvalued or undervalued in lower or higher timeframes. Note that this feature is experimental and has not been extensively tested. Larry Williams originally used the weekly timeframe to determine if a stock was overvalued or undervalued. By default, the indicator compares the current price with the security based on the selected timeframe, except if you choose to use a custom timeframe.
Pro Tip : New users can start with the default securities to understand the concept before using other assets.
Step 3: Valuation Index Settings
Short EMA Length : This is the short-term average used for calculations. A lower value makes it more responsive to recent price changes.
Long EMA Length : This is the long-term average, used to smooth the valuation over time.
Valuation Length (Default: 156) : Represents approximately three years of daily bars (as recommended by Larry Williams).
How is the Valuation Index Calculated?
The valuation calculation is done using a method called WVI (WillVal Index), which compares the current price of a security to the price of another correlated security. Here’s a step-by-step explanation:
1. Data Collection: The script takes the closing price of the security you are analyzing and the closing price of the correlated security.
2. Ratio Calculation : The ratio of the two prices is calculated:
Price Ratio = (Price of your security) / (Price of correlated security) * 100.
This ratio helps determine how expensive or cheap your security is compared to the correlated one.
3. Exponential Moving Averages (EMAs) : The price ratio is used to calculate short-term and long-term EMAs (Exponential Moving Averages). EMAs are used to create smooth lines that represent the average price of a security over a specific period of time, with more weight given to recent data. By calculating both short-term and long-term EMAs, we can identify the trend direction and how the security is performing compared to its historical averages.
4. Valuation Index Calculation:
The Valuation Index is calculated as the difference between the short-term EMA and the long-term EMA. This difference helps to determine if the security is currently overvalued or undervalued:
A positive value indicates that the price is above its longer-term trend, suggesting potential overvaluation.
A negative value indicates that the price is below its longer-term trend, suggesting potential undervaluation.
5. Normalization:
To make the valuation easier to interpret, the calculated valuation index is then normalized using the highest and lowest values over the selected valuation length (e.g., 156 bars).
This normalization process converts the index into a percentage between 0 and 100, where higher values indicate overvaluation and lower values indicate undervaluation.
Step 4: Understanding Valuation Levels
The valuation levels indicate whether a security is currently undervalued, overvalued, or in a normal range.
Manual Levels : You can manually set the overvaluation and undervaluation thresholds (default is 85 for overvalued and 15 for undervalued).
Auto Levels : The script can automatically calculate these levels based on recent price action, allowing you to adapt to changing market conditions.
Auto Levels Calculation Explained:
The Auto Levels are calculated by taking the average of the valuation indices for all three securities (e.g., index1, index2, and index3).
The script then looks at the highest and lowest values of this average over a selected number of recent bars (e.g., 50 bars).
The overvaluation level is determined by taking the highest value and multiplying it by a multiplier (e.g., 5). Similarly, the undervaluation level is calculated using the lowest value and the multiplier.
These dynamic levels adjust according to recent price action, providing an adaptive approach to identifying overvalued and undervalued conditions.
Step 5: How to Use the Script to Make Trading Decisions
For new users, here's a step-by-step trading strategy you can use with the Valuation Index:
1. Identify Undervalued Opportunities
When two or more securities are in the undervalued range (below 15 for manual or below automatically calculated undervalue levels), wait for at least two of these securities to turn from undervalued to normal .
This transition indicates a potential buy opportunity .
2. Buying Signal
When at least two securities transition from undervalued to normal, you can consider buying the asset.
This indicates that the market may be recovering from undervalued conditions and could be moving into a growth phase.
3. Selling Signal
Exit when the price high closes below the EMA 21 (21-day exponential moving average).
Alternatively, if the valuation index reaches overvalued levels (above 85 manually or auto-calculated), wait for it to drop back to normal . This can be another point to exit the trade .
You can also use any other sell condition based on your r isk management strategy .
Alerts for Valuation Levels
The script includes alerts to notify you of changing market conditions:
To activate these alerts, follow these steps, referring to the provided screenshot with detailed steps:
1. Enable Alerts : Click on the settings gear icon on the script title in your chart. In the settings menu, scroll to the section labeled Alerts Settings .
Enable Alerts by checking the Enable Alerts box.
Set the Required Securities for Alert (default is 2 securities).
Choose the Alert Frequency : Selecting Once Per Bar Close will trigger alerts only at the close of each bar, ensuring you receive confirmed signals rather than potentially noisy intermediate signals.
2. Select Alert Type : Choose the type of alert you want to activate, such as Alert on Overvalued, Alert on Undervalued, Alert on Over to Normal , or Alert on Under to Normal .
3. Save Settings : Click OK to save your alert settings.
4. Add Alert on Indicator : Click the "..." (More button) next to the indicator name on the chart and select " Add alert on tradeviZion - WillVal ".
5. Create Alert : In the Create Alert window:
Set Condition to tradeviZion - WillVal .
Ensure Any alert() function call is selected.
Set the Alert Name and select your Expiration preferences.
6. Set Notification Preferences : Go to the Notifications tab and select how you want to receive notifications, such as via app notification, toast notification, email , or sound alert . Adjust these preferences to best suit your needs.
7. Click Create : Finally, click Create to activate the alert.
These alerts will help you stay informed about key market conditions and take action accordingly, ensuring you do not miss critical trading opportunities.
Understanding the Table Display
The script includes an interactive table on the chart to show the valuation status of each security:
Security : The name of the security being analyzed.
Value : The current valuation index value.
Status : Indicates whether the security is overvalued, undervalued , or in a normal range.
Color: Displays a color code for easy identification of status:
Red for overvalued.
Green for undervalued.
Other colors represent normal valuation levels.
Empowering Messages : Motivational messages are displayed to encourage disciplined trading. These messages will change periodically, helping keep a positive trading mindset.
Acknowledgment
This tool builds upon the foundational work of Larry Williams, who developed the WillVal (Valuation) Index concept. It also incorporates enhancements to extend multi-security analysis, valuation normalization, and advanced alerting features, providing a more versatile and powerful indicator. The Larry Williams Valuation Index [ tradeviZion ] helps traders make informed decisions by assessing overvalued and undervalued conditions for multiple securities simultaneously.
Note : Always practice proper risk management and thoroughly test the indicator to ensure it aligns with your trading strategy. Past performance is not indicative of future results.
Trade smarter with TradeVizion—unlock your trading potential today!

MTF Squeeze Analyzer - [tradeviZion]MTF Squeeze Analyzer
Multi-Timeframe Squeeze Pro Analyzer Tool
Overview:
The MTF Squeeze Analyzer is a comprehensive tool designed to help traders monitor the TTM Squeeze indicator across multiple timeframes in a streamlined and efficient manner. Built with Pine Script™ version 5, this indicator enhances your market analysis by providing detailed insights into squeeze conditions and momentum shifts, enabling you to make more informed trading decisions.
Key Features:
1. Multi-Timeframe Monitoring:
Comprehensive Coverage: Track squeeze conditions across multiple timeframes, including 1-minute, 5-minute, 15-minute, 30-minute, 1-hour, 2-hour, 4-hour, and daily charts.
Squeeze Counts: Keep count of the number of consecutive bars the price has been within each squeeze level (low, mid, high), helping you assess the strength and duration of consolidation periods.
2. Dynamic Table Display:
Customizable Appearance: Adjust table position, text size, and colors to suit your preferences.
Color-Coded Indicators: Easily identify squeeze levels and momentum shifts with intuitive color schemes.
Message Integration: Features rotating messages to keep you engaged and informed.
3. Alerts for Key Market Events:
Squeeze Start and Fire Alerts: Receive notifications when a squeeze starts or fires on your selected timeframes.
Custom Squeeze Count Alerts: Set thresholds for squeeze counts and get alerted when these levels are reached, allowing you to anticipate potential breakouts.
Fully Customizable: Choose which alerts you want to receive and tailor them to your trading strategy.
4. Momentum Analysis:
Momentum Oscillator: Visualize momentum using a histogram that changes color based on momentum shifts.
Detailed Insights: Determine whether momentum is increasing or decreasing to make more strategic trading decisions.
How It Works:
The indicator is based on the TTM Squeeze concept, which identifies periods of low volatility where the market is "squeezing" before a potential breakout. It analyzes the relationship between Bollinger Bands and Keltner Channels to determine squeeze conditions and uses linear regression to calculate momentum.
1. Squeeze Levels:
No Squeeze (Green): Market is not in a squeeze.
Low Compression Squeeze (Gray): Mild consolidation, potential for a breakout.
Mid Compression Squeeze (Red): Moderate consolidation, higher breakout potential.
High Compression Squeeze (Orange): Strong consolidation, significant breakout potential.
2. Squeeze Counts:
Tracks the number of consecutive bars in each squeeze condition.
Helps identify how long the market has been consolidating, providing clues about potential breakout timing.
3. Momentum Histogram:
Upward Momentum: Shown in aqua or blue, indicating increasing or decreasing upward momentum.
Downward Momentum: Displayed in red or yellow, representing increasing or decreasing downward momentum.
Using Alerts:
Stay ahead of market movements with customizable alerts:
1. Enable Alerts in Settings:
Squeeze Start Alert: Get notified when a new squeeze begins.
Squeeze Fire Alert: Be alerted when a squeeze ends, signaling a potential breakout.
Squeeze Count Alert: Set a specific number of bars for a squeeze condition, and receive an alert when this count is reached.
2. Set Up Alerts on Your Chart:
Click on the indicator name and select " Add Alert on MTF Squeeze Analyzer ".
Choose your desired alert conditions and customize the notification settings.
Click " Create " to activate the alerts.
How to Set It Up:
1. Add the Indicator to Your Chart:
Search for " MTF Squeeze Analyzer " in the TradingView Indicators library.
Add it to your chart.
2. Customize Your Settings:
Table Display:
Choose whether to show the table and select its position on the chart.
Adjust text size and colors to enhance readability.
Timeframe Selection:
Select the timeframes you want to monitor.
Enable or disable specific timeframes based on your trading strategy.
Colors & Styles:
Customize colors for different squeeze levels and momentum shifts.
Adjust header and text colors to match your chart theme.
Alert Settings:
Enable alerts for squeeze start, squeeze fire, and squeeze counts.
Set your preferred squeeze type and count threshold for alerts.
3. Interpret the Data:
Table Information:
The table displays the squeeze status and counts for each selected timeframe.
Colors indicate the type of squeeze, making it easy to assess market conditions at a glance.
Momentum Histogram:
Use the histogram to gauge the strength and direction of market momentum.
Observe color changes to identify shifts in momentum.
Why Use MTF Squeeze Analyzer ?
Enhanced Market Insight:
Gain a deeper understanding of market dynamics by monitoring multiple timeframes simultaneously.
Identify potential breakout opportunities by analyzing squeeze durations and momentum shifts.
Customizable and User-Friendly:
Tailor the indicator to fit your trading style and preferences.
Easily adjust settings without needing to delve into the code.
Time-Efficient:
Save time by viewing all relevant squeeze information in one place.
Reduce the need to switch between different charts and timeframes.
Stay Informed with Alerts:
Never miss a critical market movement with fully customizable alerts.
Focus on other tasks while the indicator monitors the market for you.
Acknowledgment:
This tool builds upon the foundational work of John Carter , who developed the TTM Squeeze concept. It also incorporates enhancements from LazyBear and Makit0 , providing a more versatile and powerful indicator. MTF Squeeze Analyzer extends these concepts by adding multi-timeframe analysis, squeeze counting, and advanced alerting features, offering traders a comprehensive solution for market analysis.
Note: Always practice proper risk management and test the indicator thoroughly to ensure it aligns with your trading strategy. Past performance is not indicative of future results.
Trade smarter with TradeVizion—unlock your trading potential today!

MTF SqzMom [tradeviZion]Credits:
John Carter for creating the TTM Squeeze and TTM Squeeze Pro.
Lazybear for the original interpretation of the TTM Squeeze: Squeeze Momentum Indicator.
Makit0 for evolving Lazybear's script by incorporating TTM Squeeze Pro upgrades – Squeeze PRO Arrows.
MTF SqzMom - Multi-Timeframe Squeeze & Momentum Tool
MTF SqzMom is a tool designed to help traders easily monitor squeeze and momentum signals across multiple timeframes in a simple, organized format. Built using Pine Script 5, it ensures that data remains consistent, even when switching between different time intervals on the chart.
Key Features:
Multi-Timeframe Monitoring: Track squeeze and momentum signals across various timeframes, all in one view. This includes key timeframes like 1-minute, 5-minute, hourly, and daily.
Dynamic Table Display: A color-coded table that automatically adjusts based on the selected timeframes, offering a clear view of market conditions.
Alerts for Key Market Events: Get notifications when a squeeze starts or fires across your chosen timeframes, so you can stay informed without needing to monitor the chart continuously.
Customizable Appearance: Tailor the look of the table by selecting colors for squeeze levels and momentum shifts, and choose the best position on your chart for easy access.
How It Works:
MTF SqzMom is based on the concept of the squeeze, which signals periods of lower volatility where price breakouts may occur. The tool tracks this by monitoring the contraction of Bollinger Bands within Keltner Channels. Along with this, it provides momentum analysis to help you gauge the potential direction of the market after a squeeze.
Squeeze Conditions: The script tracks four levels of squeeze conditions (no squeeze, low, mid, and high), each represented by a different color in the table.
Momentum Analysis: Momentum is visually represented by colors indicating four stages: up increasing, up decreasing, down increasing, and down decreasing. This color coding helps you quickly assess whether the market is gaining or losing momentum.
Using Alerts:
You can enable two types of alerts: when a squeeze starts (indicating consolidation) and when a squeeze fires (indicating a breakout). These alerts cover all timeframes you’ve selected, so you never miss important signals.
How to Set It Up:
1. Enable Alerts in Settings: Turn on "Alert for Squeeze Start" and "Alert for Squeeze Fire" in the settings.
2. Add Alerts to Your Chart:
Click the three dots next to the indicator name.
Select "Add alert on tradeviZion - MTF SqzMom."
3. Customize and Save: Adjust alert options, choose your notification type, and click "Create."
Why Use MTF SqzMom ?
Consistent Data: The tool ensures that squeeze and momentum data remain consistent, even when you switch between chart intervals.
Real-Time Alerts: Stay updated with alerts for squeeze conditions without needing to constantly watch the chart.
Simple to Use, Customizable to Fit: You can easily adjust the table’s look and choose the timeframes and colors that best suit your trading style.
Acknowledgment:
While this tool builds on the TTM Squeeze concept developed by John Carter of Simpler Trading, it offers added flexibility through multi-timeframe analysis, alerts, and customizability to make monitoring market conditions more accessible.
