Multi-VWAP Pro (HP) + Alerts - par alphaomega18Multi-VWAP Pro High-Precision (D/W/M) – by alphaomega18
🚀 Overview
Elevate your institutional analysis with the Multi-VWAP Pro High-Precision, a comprehensive tool designed for traders who demand surgical accuracy.
Most standard VWAP indicators lag or shift when changing timeframes. This script solves that by using a 1-minute data polling engine (request.security), ensuring your Daily, Weekly, and Monthly levels remain rock-solid and accurate, whether you are on a 1m, 15m, or 1h chart.
💎 Key Features
High-Precision Engine: Calculation based on 1-minute intraday data for maximum mathematical accuracy.
Multi-Timeframe Anchors: View Daily, Weekly, and Monthly VWAPs simultaneously.
Dynamic Color Logic: The Daily VWAP turns Green when the price is above and Red when below for instant trend bias.
Triple SD Bands: 3 fully customizable Standard Deviation bands for each timeframe to identify exhaustion zones.
Smart Alerts: Fully programmable notifications for price crosses on all levels.
Clean Labels: Real-time labels on the price scale for a professional, organized look.
📈 Trading Strategy: The Power of Confluence
Using three different VWAP anchors allows you to see the market through multiple lenses. Here is how to use this tool:
1. The Institutional Confluence
The strongest setups occur when two or more VWAP lines overlap.
The Setup: If the Daily VWAP clusters with the Weekly VWAP, it creates a "Hard Floor/Ceiling."
The Trade: Look for high-probability bounces in these zones where institutions defend their average price.
2. Mean Reversion with SD3 Bands
The 3rd Standard Deviation (SD3) represents price extremes.
The Trade: When price pierces a Daily SD3, look for a reversal back toward the VWAP (Mean Reversion), especially if it aligns with a Weekly or Monthly SD2 band.
3. Trend Confirmation
Bullish Bias: If the Daily VWAP is Green, prioritize "Buy the Dip" on lower SD bands.
Bearish Bias: If the Daily VWAP is Red, prioritize "Sell the Rip" on upper SD bands.
💡 Pro Tip for my Followers
"Alignment is king. When the Daily, Weekly, and Monthly VWAPs all slope in the same direction, you have a high-conviction trend. Follow me for more high-precision tools and market insights!"
🛠 Settings & Customization
Visibility: Toggle any VWAP or SD band on/off.
Full Color Control: Pick your own colors for Weekly and Monthly lines.
Adjustable Multipliers: Fine-tune the volatility bands (SD1, SD2, SD3) for any asset.
Tradingstrategy

Trend Cloud with Buy/Sell Text [wjdtks255]Indicator Title: Trend Cloud with Buy/Sell Signal Pro
Short Description
A high-probability trend-following indicator based on Supertrend dynamics, enhanced with a Volume Filter to pinpoint explosive entries while minimizing false breakouts.
Detailed Description (Overview)
The Trend Cloud with Buy/Sell Text is designed for traders who prioritize clarity and momentum. It visualizes market trends through a "Trend Cloud" system and generates real-time BUY/SELL signals only when price action is backed by significant trading volume.
Key Technical Pillars
Dynamic Trend Cloud: Fills the area between the price and the Supertrend line, providing immediate visual feedback on trend strength and potential support/resistance zones.
Smart Volume Filter: A unique logic that compares current volume against a 20-period moving average. Labels only appear when a trend shift occurs with above-average volume, filtering out weak "fakeouts."
No-Repaint Labels: Signals are calculated and fixed at the close of the candle, ensuring that the BUY/SELL text remains permanent for reliable historical backtesting and live execution.
The Alpha Hunter Strategy (How to Trade)
1. Long Entry (Buy)
Condition: The cloud turns Aqua and a "BUY" label appears below the candle.
Confirmation: Ensure the price remains above the Aqua Trend Line.
Volume Check: The indicator automatically verifies if the volume is higher than the 20-period average before displaying the label.
Exit: Exit when a "SELL" signal appears or the price closes below the Aqua line.
2. Short Entry (Sell)
Condition: The cloud turns Red and a "SELL" label appears above the candle.
Confirmation: Price should stay below the Red Trend Line.
Exit: Exit when a "BUY" signal appears or the price closes above the Red line.
Input Parameters & Optimization
ATR Period (Default: 10): Determines the sensitivity to price volatility.
ATR Factor (Default: 3.0): Controls the distance of the trend line. Increase to 3.5 - 4.0 to reduce noise in choppy markets.
Volume Filter (Toggle): When enabled, only high-momentum signals are shown.
Recommended Usage
Best Timeframes: 15m, 1h, 4h.
Asset Classes: Highly effective for Crypto (BTC/ETH) and high-volume stocks.

HMA Trend Scalper V1[wjdtks255]
Overview
This indicator is a high-performance trend-following system optimized for crypto futures trading. It provides clear entry signals and dynamic, real-time risk management tools to help traders stay on the right side of the market.
Key Features
Dynamic Trend Tracking: Uses a specialized HMA (Hull Moving Average) to filter market noise and identify the core trend.
Real-time TP/SL Extension: Unlike static indicators, the Take Profit (TP) and Stop Loss (SL) lines extend candle-by-candle along with the price action.
Clean Chart UI: Lines only exist from the entry point to the current candle, preventing chart clutter.
Automatic Completion: Once the price hits a target, the line stops extending and marks the result (Target Hit or Stop Out).
Trading Strategy (How to Trade)
1. Long Entry (🚀 LONG)
Condition: The price must be above the trend line, and a breakout of the recent 5-candle high must occur with significant volume.
Action: Enter a Long position when the "🚀 LONG" label appears.
Exit: Hold until the price reaches the Cyan (Aqua) TP line or hits the Yellow SL line.
2. Short Entry (💀 SHORT)
Condition: The price must be below the trend line, and a breakdown of the recent 5-candle low must occur with significant volume.
Action: Enter a Short position when the "💀 SHORT" label appears.
Exit: Hold until the price reaches the Cyan (Aqua) TP line or hits the Yellow SL line.
3. Risk Management
Stop Loss: The indicator automatically calculates the optimal SL based on recent volatility (ATR) and swing points.
Take Profit: The TP is set at a calculated ratio to ensure a positive risk-to-reward setup.
Settings
Trend Sensitivity: Adjust the HMA length to match your preferred timeframe (Scalping vs. Swing).
Volume Multiplier: Filter out weak moves by increasing the volume breakout requirement.
Custom Styles: Fully customize line colors, widths, and styles (Solid, Dashed, Dotted) in the settings menu.

Trading Discipline Mirror How deciplined you are?
Trading Discipline Journal – Smart Feedback helps traders stay disciplined and emotionally controlled. Select your winning or losing reasons, and the indicator automatically calculates scores, evaluates your behavior, and gives clear feedback on whether you’re trading in a safe mindset or a risky one.

Extremum Range MA Crossover Strategy1. Principle of Work & Strategy Logic ⚙️📈
Main idea: The strategy tries to catch the moment of a breakout from a price consolidation range (flat) and the start of a new trend. It combines two key elements:
Moving Average (MA) 📉: Acts as a dynamic support/resistance level and trend filter.
Range Extremes (Range High/Low) 🔺🔻: Define the borders of the recent price channel or consolidation.
The strategy does not attempt to catch absolute tops and bottoms. Instead, it enters an already formed move after the breakout, expecting continuation.
Type: Trend-following, momentum-based.
Timeframes: Works on different TFs (H1, H4, D), but best suited for H4 and higher, where breakouts are more meaningful.
2. Justification of Indicators & Settings ⚙️
A. Moving Average (MA) 📊
Why used: Core of the strategy. It smooths price fluctuations and helps define the trend. The price (via extremes) must cross the MA → signals a potential trend shift or strengthening.
Parameters:
maLength = 20: Default length (≈ one trading month, 20-21 days). Good balance between sensitivity & smoothing.
Lower TF → reduce (10–14).
Higher TF → increase (50).
maSource: Defines price source (default = Close). Alternatives (HL2, HLC3) → smoother, less noisy MA.
maType: Default = EMA (Exponential MA).
Why EMA? Faster reaction to recent price changes vs SMA → useful for breakout strategies.
Other options:
SMA 🟦 – classic, slowest.
WMA 🟨 – weights recent data stronger.
HMA 🟩 – near-zero lag, but “nervous,” more false signals.
DEMA/TEMA 🟧 – even faster & more sensitive than EMA.
VWMA 🔊 – volume-weighted.
ZLEMA ⏱ – reduced lag.
👉 Choice = tradeoff between speed of reaction & false signals.
B. Range Extremes (Previous High/Low) 📏
Why used: Define borders of recent trading range.
prevHigh = local resistance.
prevLow = local support.
Break of these levels on close = trigger.
Parameters:
lookbackPeriod = 5: Searches for highest high / lowest low of last 5 candles. Very recent range.
Higher value (10–20) → wider, stronger ranges but rarer signals.
3. Entry & Exit Rules 🎯
Long signals (BUY) 🟢📈
Condition (longCondition): Previous Low crosses MA from below upwards.
→ Price bounced from the bottom & strong enough to push range border above MA.
Execution: Auto-close short (if any) → open long.
Short signals (SELL) 🔴📉
Condition (shortCondition): Previous High crosses MA from above downwards.
→ Price rejected from the top, upper border failed above MA.
Execution: Auto-close long (if any) → open short.
Exit conditions 🚪
Exit Long (exitLongCondition): Close below prevLow.
→ Uptrend likely ended, range shifts down.
Exit Short (exitShortCondition): Close above prevHigh.
→ Downtrend likely ended, range shifts up.
⚠️ Important: Exit = only on candle close beyond extremes (not just wick).
4. Trading Settings ⚒️
overlay = true → indicators shown on chart.
initial_capital = 10000 💵.
default_qty_type = strategy.cash, default_qty_value = 100 → trades fixed $100 per order (not lots). Can switch to % of equity.
commission_type = strategy.commission.percent, commission_value = 0.1 → default broker fee = 0.1%. Adjust for your broker!
slippage = 3 → slippage = 3 ticks. Adjust to asset liquidity.
currency = USD.
margin_long = 100, margin_short = 100 → no leverage (100% margin).
5. Visualization on Chart 📊
The strategy draws 3 lines:
🔵 MA line (thickness 2).
🔴 Previous High (last N candles).
🟢 Previous Low (last N candles).
Also: entry/exit arrows & equity curve shown in backtest.
Disclaimer ⚠️📌
Risk Warning: This description & code are for educational purposes only. Not financial advice. Trading (Forex, Stocks, Crypto) carries high risk and may lead to full capital loss. You trade at your own risk.
Testing: Always backtest & demo test first. Past results ≠ future profits.
Responsibility: Author of this strategy & description is not responsible for your trading decisions or losses.

Liquidity mark-out indicator(by Lumiere)This indicator marks out every High that has a bullish candle followed by a bearish one, vice versa for lows.
Once the price reaches the marked-out liquidity, the line is removed automatically.
This indicator only shows the current liquidity of the time frame you are at.
(To get it look like the picture just chance the length to 30-50)
Key Features of the Liquidity Mark-Out Indicator:
🔹 Identifies Liquidity Zones – Marks highs and lows based on candlestick patterns.
🔹 Customizable Settings – Toggle highs/lows visibility 🎚️, adjust line colors 🎨, and set line length (bars) 📏.
🔹 Smart Clean-Up – Automatically removes swept levels (when price breaks through) for a clean chart 🧹.
🔹 Pattern-Based Detection –
Highs: Detects two-candle reversal patterns (🟢 bullish close → 🔴 bearish close).
Lows: Detects two-candle reversal patterns (🔴 bearish close → 🟢 bullish close).
🔹 Dynamic Lines – Projects liquidity levels forward (adjustable length) to track key zones 📈.
Perfect For Traders Looking To:
✅ Spot potential liquidity grabs 🎯
✅ Identify key support/resistance levels 🛑
✅ Clean up their chart from outdated levels 🖥️

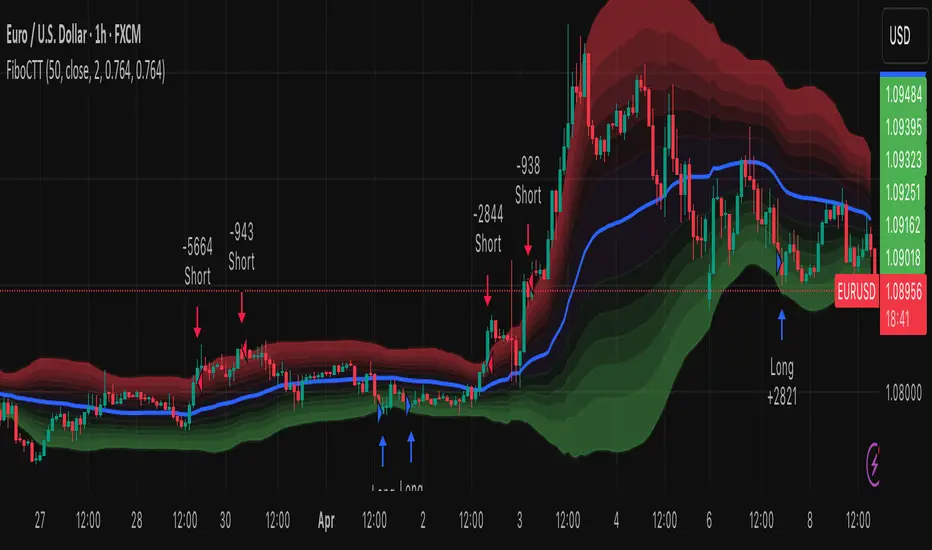
Fibonacci Counter-Trend TradingOverview:
The Fibonacci Counter-Trend Trading strategy is designed to capitalize on price reversals by utilizing Fibonacci levels calculated from the standard deviation of price movements. This strategy opens a sell order when the closing price crosses above a specified upper Fibonacci level and a buy order when the closing price crosses below a specified lower Fibonacci level. By leveraging the principles of Fibonacci retracement and volatility, this strategy aims to identify potential reversal points in the market.
How It Works:
Fibonacci Levels Calculation:
The strategy calculates upper and lower Fibonacci levels based on the standard deviation of the price over a specified moving average length. These levels are derived from the Fibonacci sequence, which is widely used in technical analysis to identify potential support and resistance levels.
The upper levels are calculated by adding specific Fibonacci ratios (0.236, 0.382, 0.5, 0.618, 0.764, and 1.0) multiplied by the standard deviation to the basis (the volume-weighted moving average).
The lower levels are calculated by subtracting the same Fibonacci ratios multiplied by the standard deviation from the basis.
Trade Entry Rules:
Sell Order: A sell order is triggered when the closing price crosses above the selected upper Fibonacci level. This indicates a potential reversal point where the price may start to decline.
Buy Order: A buy order is initiated when the closing price crosses below the selected lower Fibonacci level. This suggests a potential reversal point where the price may begin to rise.
Trade Management:
The strategy includes stop-losses based on the Fibonacci levels to protect against adverse price movements.
How to Use:
Users can customize the moving average length and the multiplier for the standard deviation to suit their trading preferences and market conditions.
The strategy can be applied to various financial instruments, including stocks, forex, and cryptocurrencies, making it versatile for different trading environments.
Pros:
The Fibonacci Counter-Trend Trading strategy combines the mathematical principles of the Fibonacci sequence with the statistical measure of standard deviation, providing a unique approach to identifying potential market reversals.
This strategy is particularly useful in volatile markets where price swings can lead to significant trading opportunities.
The use of Fibonacci levels can help traders identify key support and resistance areas, enhancing decision-making.
Cons:
The strategy may generate false signals in choppy or sideways markets, leading to potential losses if the price does not reverse as anticipated.
Relying solely on Fibonacci levels without considering other technical indicators or market conditions may result in missed opportunities or increased risk.
The effectiveness of the strategy can vary depending on the chosen parameters (e.g., moving average length and standard deviation multiplier), requiring users to spend time optimizing these settings for different market conditions.
As with any counter-trend strategy, there is a risk of significant drawdowns during strong trending markets, where the price continues to move in one direction without reversing.
By understanding the mechanics of the Fibonacci Counter-Trend Trading strategy, along with its pros and cons, traders can effectively implement it in their trading routines and potentially enhance their trading performance.
Multiple MAsHere's a well-written description in English for your "Multiple MAs" indicator that you can use when publishing on TradingView. It’s concise, professional, and highlights the key features of the indicator while explaining its purpose for traders.
---
### Multiple MAs Indicator
#### Overview
The **Multiple MAs** indicator is a versatile and straightforward tool designed to help traders visualize price trends using multiple Simple Moving Averages (SMAs) on a single chart. By plotting six SMAs with customizable lengths (MA5, MA10, MA20, MA50, MA100, and MA200), this indicator provides a clear view of short-term, medium-term, and long-term trends, making it ideal for trend-following strategies, crossover analysis, and identifying potential support/resistance levels.
#### Features
- **Customizable MA Lengths**: Adjust the periods of all six moving averages (MA5, MA10, MA20, MA50, MA100, MA200) to suit your trading style and timeframe.
- **Distinct Visuals**: Each MA is plotted with a unique color and line width for easy identification:
- MA5 (Dodger Blue, 1px)
- MA10 (Green, 1px)
- MA20 (Red, 2px)
- MA50 (Purple, 3px)
- MA100 (Gray, 3px)
- MA200 (White, 3px)
- **Overlay on Price Chart**: The indicator overlays directly on the price chart, allowing for seamless integration with other technical analysis tools.
- **High Precision**: Displays values with 8-decimal precision, ensuring accuracy for assets with small price movements (e.g., forex pairs or cryptocurrencies).
#### How to Use
1. **Trend Identification**: Use the longer MAs (e.g., MA100, MA200) to determine the overall trend direction. If the price is above these MAs, the trend is likely bullish; if below, it’s likely bearish.
2. **Crossover Signals**: Look for crossovers between shorter MAs (e.g., MA5 crossing MA20) for potential entry or exit signals. For example:
- A bullish signal occurs when a shorter MA crosses above a longer MA.
- A bearish signal occurs when a shorter MA crosses below a longer MA.
3. **Support and Resistance**: MAs often act as dynamic support or resistance levels. Watch for price reactions around these lines, especially the MA50, MA100, and MA200.
4. **Divergence Analysis**: Compare the slope of different MAs to identify potential trend reversals or weakening momentum.
#### Settings
- **MA5 Length**: Default is 5 bars.
- **MA10 Length**: Default is 10 bars.
- **MA20 Length**: Default is 20 bars.
- **MA50 Length**: Default is 50 bars.
- **MA100 Length**: Default is 100 bars.
- **MA200 Length**: Default is 200 bars.
#### Best Practices
- **Timeframe**: This indicator works on any timeframe but is particularly effective on daily, 4-hour, and 1-hour charts for swing trading or trend-following strategies.
- **Combine with Other Tools**: Pair the Multiple MAs with other indicators like RSI, MACD, or volume analysis to confirm signals and avoid false breakouts.
- **Adjust for Volatility**: For highly volatile assets, consider increasing the MA lengths to reduce noise and focus on broader trends.
#### Notes
- The indicator is lightweight and optimized for performance, ensuring it runs smoothly even on lower timeframes.
- Colors and line widths are pre-set for clarity but can be customized in the indicator settings if needed.
#### Credits
Created by kosar_v. Feedback and suggestions are welcome to improve this tool for the TradingView community!

Iron Bot Statistical Trend Filter📌 Iron Bot Statistical Trend Filter
📌 Overview
Iron Bot Statistical Trend Filter is an advanced trend filtering strategy that combines statistical methods with technical analysis.
By leveraging Z-score and Fibonacci levels, this strategy quantitatively analyzes market trends to provide high-precision entry signals.
Additionally, it includes an optional EMA filter to enhance trend reliability.
Risk management is reinforced with Stop Loss (SL) and four Take Profit (TP) levels, ensuring a balanced approach to risk and reward.
📌 Key Features
🔹 1. Statistical Trend Filtering with Z-Score
This strategy calculates the Z-score to measure how much the price deviates from its historical mean.
Positive Z-score: Indicates a statistically high price, suggesting a strong uptrend.
Negative Z-score: Indicates a statistically low price, signaling a potential downtrend.
Z-score near zero: Suggests a ranging market with no strong trend.
By using the Z-score as a filter, market noise is reduced, leading to more reliable entry signals.
🔹 2. Fibonacci Levels for Trend Reversal Detection
The strategy integrates Fibonacci retracement levels to identify potential reversal points in the market.
High Trend Level (Fibo 23.6%): When the price surpasses this level, an uptrend is likely.
Low Trend Level (Fibo 78.6%): When the price falls below this level, a downtrend is expected.
Trend Line (Fibo 50%): Acts as a midpoint, helping to assess market balance.
This allows traders to visually confirm trend strength and turning points, improving entry accuracy.
🔹 3. EMA Filter for Trend Confirmation (Optional)
The strategy includes an optional 200 EMA (Exponential Moving Average) filter for trend validation.
Price above 200 EMA: Indicates a bullish trend (long entries preferred).
Price below 200 EMA: Indicates a bearish trend (short entries preferred).
Enabling this filter reduces false signals and improves trend-following accuracy.
🔹 4. Multi-Level Take Profit (TP) and Stop Loss (SL) Management
To ensure effective risk management, the strategy includes four Take Profit levels and a Stop Loss:
Stop Loss (SL): Automatically closes trades when the price moves against the position by a certain percentage.
TP1 (+0.75%): First profit-taking level.
TP2 (+1.1%): A higher probability profit target.
TP3 (+1.5%): Aiming for a stronger trend move.
TP4 (+2.0%): Maximum profit target.
This system secures profits at different stages and optimizes risk-reward balance.
🔹 5. Automated Long & Short Trading Logic
The strategy is built using Pine Script®’s strategy.entry() and strategy.exit(), allowing fully automated trading.
Long Entry:
Price is above the trend line & high trend level.
Z-score is positive (indicating an uptrend).
(Optional) Price is also above the EMA for stronger confirmation.
Short Entry:
Price is below the trend line & low trend level.
Z-score is negative (indicating a downtrend).
(Optional) Price is also below the EMA for stronger confirmation.
This logic helps filter out unnecessary trades and focus only on high-probability entries.
📌 Trading Parameters
This strategy is designed for flexible capital management and risk control.
💰 Account Size: $5000
📉 Commissions and Slippage: Assumes 94 pips commission per trade and 1 pip slippage.
⚖️ Risk per Trade: Adjustable, with a default setting of 1% of equity.
These parameters help preserve capital while optimizing the risk-reward balance.
📌 Visual Aids for Clarity
To enhance usability, the strategy includes clear visual elements for easy market analysis.
✅ Trend Line (Blue): Indicates market midpoint and helps with entry decisions.
✅ Fibonacci Levels (Yellow): Highlights high and low trend levels.
✅ EMA Line (Green, Optional): Confirms long-term trend direction.
✅ Entry Signals (Green for Long, Red for Short): Clearly marked buy and sell signals.
These features allow traders to quickly interpret market conditions, even without advanced technical analysis skills.
📌 Originality & Enhancements
This strategy is developed based on the IronXtreme and BigBeluga indicators,
combining a unique Z-score statistical method with Fibonacci trend analysis.
Compared to conventional trend-following strategies, it leverages statistical techniques
to provide higher-precision entry signals, reducing false trades and improving overall reliability.
📌 Summary
Iron Bot Statistical Trend Filter is a statistically-driven trend strategy that utilizes Z-score and Fibonacci levels.
High-precision trend analysis
Enhanced accuracy with an optional EMA filter
Optimized risk management with multiple TP & SL levels
Visually intuitive chart design
Fully customizable parameters & leverage support
This strategy reduces false signals and helps traders ride the trend with confidence.
Try it out and take your trading to the next level! 🚀

Gold Friday Anomaly StrategyThis script implements the " Gold Friday Anomaly Strategy ," a well-known historical trading strategy that leverages the gold market's behavior from Thursday evening to Friday close. It is a backtesting-focused strategy designed to assess the historical performance of this pattern. Traders use this anomaly as it captures a recurring market tendency observed over the years.
What It Does:
Entry Condition: The strategy enters a long position at the beginning of the Friday trading session (Thursday evening close) within the defined backtesting period.
Exit Condition: Friday evening close.
Backtesting Controls: Allows users to set custom backtesting periods to evaluate strategy performance over specific date ranges.
Key Features:
Custom Backtest Periods: Easily configurable inputs to set the start and end date of the backtesting range.
Fixed Slippage and Commission Settings: Ensures realistic simulation of trading conditions.
Process Orders on Close: Backtesting is optimized by processing orders at the bar's close.
Important Notes:
Backtesting Only: This script is intended purely for backtesting purposes. Past performance is not indicative of future results.
Live Trading Recommendations: For live trading, it is highly recommended to use limit orders instead of market orders, especially during evening sessions, as market order slippage can be significant.
Default Settings:
Entry size: 10% of equity per trade.
Slippage: 1 tick.
Commission: 0.05% per trade.

TechniTrend: Advance Custom Candle Finder (CCF)🟦 Description:
The TechniTrend: Advanced Custom Candle Finder (CCF) is a versatile tool designed to help traders identify custom candlestick patterns using various configurable criteria. This indicator provides a flexible framework to filter and highlight specific candles based on volume, volatility, candle characteristics, and other important metrics. Below is a detailed explanation of each filter and its customization options:
🟦 Volume-Based Filters
🔸Volume Spike Filter:
Enable filtering based on volume spikes. Use the Volume Spike Multiplier to define what constitutes a significant increase in volume compared to the average. A spike indicates unusually high trading interest.
🔸Volume Range Filter:
Filter candles based on specific volume ranges. Set Minimum Volume and Maximum Volume thresholds to isolate candles with trading volumes within your desired boundaries.
🟦 Candle Body & Wick Filters
🔸Body Size Filter:
Filter candles based on the size of their body. A Body Size Multiplier determines what is considered a large body relative to historical averages.
🔸Body Percentage Filter:
Filter based on the proportion of the body to the entire candle size. Use the Body Percentage Threshold to highlight candles where the body makes up a certain percentage of the total candle range.
🔸Wick-to-Body Ratio Filter:
Identify candles with specific wick-to-body ratios. A higher Wick-to-Body Ratio can indicate indecision or reversals.
🟦 Volatility & Range Filters
🔸Volatility Filter:
Highlight candles based on price changes relative to volume. The Volatility Multiplier sets the threshold for what is considered a volatile candle.
🔸Candle Range Filter:
Filter based on the range (High - Low) of each candle. Use Minimum Candle Range and Maximum Candle Range to specify your desired candle size in points or pips.
🔸Short-Term and Long-Term Volatility Filters:
Analyze volatility over different periods. Enable Short-Term Volatility or Long-Term Volatility filters to compare recent volatility against historical averages, helping you detect sudden market shifts.
🟦 Candle Color & Open/Close Filters
🔸Candle Color Filter:
Filter based on the candle's color. Choose between Bullish (close > open) or Bearish (close < open) to focus on specific market sentiments.
🔸Open/Close Price Range Filter:
Filter based on the difference between the open and close prices. Use Minimum Open/Close Range and Maximum Open/Close Range to specify your acceptable range in price movements.
🟦 Core Functionality
The CCF indicator combines these filters to provide a final signal whenever a candle meets all the enabled criteria. By default, it highlights any qualifying candle directly on the chart and changes the background color for added visibility.
🟦 Key Features:
🔸Highly Customizable Filters: Adjust the parameters for each filter to tailor the indicator to your specific needs.
🔸Multiple Conditions: Combine several conditions to identify complex candlestick patterns.
🔸Real-Time Alerts: Receive instant notifications when a matching candle pattern is found based on your custom criteria.
🟦 How to Use:
🔸Enable the filters you wish to apply (e.g., Volume Spike, Candle Body Size, Volatility).
🔸Adjust the thresholds for each filter to fine-tune the pattern recognition criteria.
🔸Observe the chart to see visual cues for candles that match your specified conditions.
🟦 Notes:
🔸Ensure that you clearly understand each filter’s role. Over-filtering with very strict criteria may reduce the number of signals.
🔸This indicator is designed to be a customizable tool, not providing buy or sell recommendations.
🔸Use in combination with other analysis tools and indicators for the best results.

Fibonacci Retracements & Trend Following Strategy V2This Pine Script strategy generates trading signals using Fibonacci levels and trend-following indicators.
1. Strategy Summary
This strategy analyzes price movements using a combination of Fibonacci levels and trend-following indicators, providing potential trading signals. The strategy includes Fibonacci levels as well as EMA (Exponential Moving Average) and ADX (Average Directional Index) indicators.
2. Indicators and Parameters
Fibonacci Levels
Fibonacci Level 1, Level 2, Level 3, Level 4: Used as Fibonacci retracement levels. These levels are typically set at 0.236, 0.382, 0.618, and 0.786. Users can adjust these values according to their preferences.
Trend-Following Indicator
Trend Length: The period for calculating the EMA used as the trend-following indicator. For example, if set to 20, the EMA will be calculated over 20 periods.
ADX (Average Directional Index)
ADX Length: The period for calculating the ADX. ADX measures the strength of the price trend and is usually set to 14 periods.
ADX Threshold: A threshold value for the ADX. This value determines when trading signals will be activated.
3. Usage Steps
Displaying the Indicator on the Chart:
On the TradingView platform, paste the code into the Pine Editor and click the "Add to Chart" button to add it to the chart.
Analyzing the Indicators:
Fibonacci Levels: Show retracement levels of price movements. When the price reaches one of these levels, potential reversals may occur.
Trend-Following Indicator: EMAs determine the direction of the trend. Green EMA represents an uptrend, while red EMA represents a downtrend.
ADX: Measures the strength of the trend. When ADX surpasses the threshold value, it indicates a strong trend.
Trading Signals:
Long Signal: Generated when the price is above the second Fibonacci level and the trend is upward. Additionally, the ADX value must be above the set threshold.
Short Signal: Generated when the price is below the second Fibonacci level and the trend is downward. Additionally, the ADX value must be above the set threshold.
Target Prices:
Long Targets: Determines upward targets based on Fibonacci levels. These targets indicate expected prices if the price reverses from Fibonacci levels.
Short Targets: Determines downward targets based on Fibonacci levels. These targets indicate expected prices if the price reverses from Fibonacci levels.
4. Chart Displays
Trend Up (Green Line): Shows the rising EMA.
Trend Down (Red Line): Shows the falling EMA.
Fibonacci Levels (Blue Lines): Shows Fibonacci retracement levels.
Long Targets (Green Circles): Shows targets for long positions.
Short Targets (Red Circles): Shows targets for short positions.
Long Signal (Green Label): Buy signal.
Short Signal (Red Label): Sell signal.
5. Important Notes
Retracement and Target Levels: Fibonacci levels can act as potential retracement or support/resistance levels. However, they should always be used in conjunction with other technical analysis tools.
Trend and ADX: ADX is used to determine the strength of the trend. Be aware that when ADX is low, trends may be weak.
6. Example Scenarios
Example 1: If the trend is upward (green EMA) and the price is above the second Fibonacci level, you may receive a long position signal. If the ADX value is above the threshold, the signal may be stronger.
Example 2: If the trend is downward (red EMA) and the price is below the second Fibonacci level, you may receive a short position signal. If the ADX value is above the threshold, the signal may be stronger.
This updated version contains significant improvements in both technical aspects and user experience. Innovations such as ADX calculations and dynamic Fibonacci levels make the strategy more robust and flexible. The code's readability and comprehensibility have been enhanced, and errors have been corrected.
This guide will help you understand the basic operation of the strategy. It is always recommended to conduct your own research and test the strategy before using it.
GOOD LUCK. // halilvarol

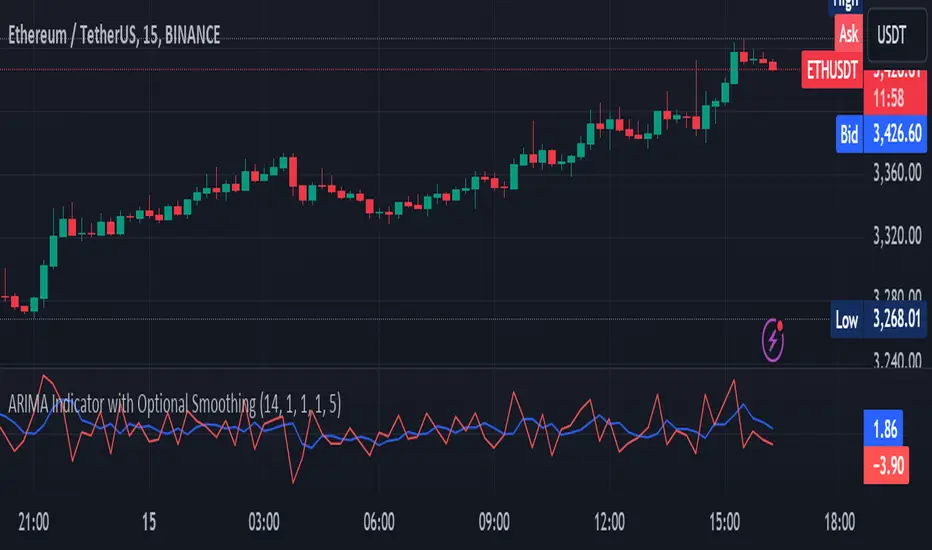
ARIMA Indicator with Optional SmoothingOverview
The ARIMA (AutoRegressive Integrated Moving Average) Indicator is a powerful tool used to forecast future price movements by combining differencing, autoregressive, and moving average components. This indicator is designed to help traders identify trends and potential reversal points by analyzing the historical price data.
Key Features
AutoRegressive Component (AR): Utilizes past values to predict future prices.
Moving Average Component (MA): Averages past price differences to smooth out noise.
Differencing: Reduces non-stationarity in the time series data.
Optional Smoothing: Applies EMA to the ARIMA output for a smoother signal.
Customizable Parameters: Allows users to adjust AR and MA orders, differencing periods, and smoothing lengths.
Concepts Underlying the Calculations
Differencing: Subtracts previous prices from current prices to remove trends and seasonality, making the data stationary.
AutoRegressive Component (AR): Predicts future prices based on a linear combination of past values.
Moving Average Component (MA): Uses past forecast errors to refine future predictions.
Exponential Moving Average (EMA): Applies more weight to recent prices, providing a smoother and more responsive signal.
How It Works
The ARIMA Indicator first calculates the differenced series to achieve stationarity. Then, it computes the simple moving average (SMA) of this differenced series. The indicator uses the AR and MA components to adjust the SMA, creating an approximation of the ARIMA model. Finally, an optional smoothing step using EMA can be applied to the ARIMA approximation to produce a smoother signal.
How Traders Can Use It
Traders can use the ARIMA Indicator to:
Identify Trends: Detect emerging trends by observing the direction of the ARIMA line.
Spot Reversals: Look for divergences between the ARIMA line and the price to identify potential reversal points.
Generate Trading Signals: Use crossovers between the ARIMA line and the price to generate buy or sell signals.
Filter Noise: Enable the optional smoothing to filter out market noise and focus on significant price movements.
Example Usage Instructions
Add the ARIMA Indicator to your chart.
Adjust the input parameters to suit your trading strategy:
Set the SMA Length (e.g., 14).
Choose the Differencing Period (e.g., 1).
Define the AR Order (p) and MA Order (q) (e.g., 1).
Configure the Smoothing Length if smoothing is desired (e.g., 5).
Enable or disable smoothing as needed.
Observe the ARIMA line (blue) and compare it to the price chart.
Use the ARIMA line to identify trends and potential reversals.
Implement trading decisions based on the ARIMA line’s behavior relative to the price.
TSI w SuperTrend decision - Strategy [presentTrading]This strategy aims to improve upon the performance of Traidngview's newly published "Trend Strength Index" indicator by incorporating the SuperTrend for better trade execution and risk management. Enjoy :)
█ Introduction and How it is Different
The "TSI with SuperTrend Decision - Strategy" combines the Trend Strength Index (TSI) with SuperTrend indicators to determine entry and exit points. Unlike traditional strategies that rely solely on one indicator, this method leverages the strengths of both TSI and SuperTrend to provide a more nuanced and adaptive trading strategy.
This dual approach allows for capturing trends more effectively, especially in volatile markets.
BTCUSD 8h LS Performance
█ Strategy, How it Works: Detailed Explanation
🔶 Trend Strength Index (TSI)
The TSI is a momentum oscillator that shows both the direction and strength of a trend. It is calculated by comparing the price movement with the bar index over a specified period. The formula for TSI is as follows:
```
TSI = (PC / |PC|)
where:
PC = Change in price over the period
```
In this strategy, TSI is calculated using the closing prices and a default period of 64 bars. The TSI values help identify overbought and oversold conditions, providing signals for potential market reversals.
🔶 SuperTrend Indicator
The SuperTrend is a trend-following indicator based on the average true range (ATR). It helps in identifying the direction of the market trend. The SuperTrend calculation involves:
```
SuperTrend = HLC3 ± (Factor * ATR)
where:
HLC3 = (High + Low + Close) / 3
Factor = User-defined multiplier
ATR = Average True Range over a period
```
The SuperTrend settings in this strategy include a length of 10 bars and a factor of 3.0.
Last Bull Cycle of BTC
🔶 Entry and Exit Conditions
The strategy uses the TSI and SuperTrend together to determine entry and exit points:
- Long Entry: When the SuperTrend indicates a downward trend (st.d < 0) and the TSI is above the oversold level (-0.241).
- Long Exit: When the SuperTrend indicates an upward trend (st.d > 0) and the TSI is below the overbought level (0.241).
- Short Entry: When the SuperTrend indicates an upward trend (st.d > 0) and the TSI is below the overbought level (0.241).
- Short Exit: When the SuperTrend indicates a downward trend (st.d < 0) and the TSI is above the oversold level (-0.241).
█ Trade Direction
The strategy allows users to select the trade direction through the `tradeDirection` input. The options are:
- Both: Enables both long and short trades.
- Long: Enables only long trades.
- Short: Enables only short trades.
█ Default Settings
- TSI Length: 64
- SuperTrend Length: 10
- SuperTrend Factor: 3.0
- Trade Direction: Both
- Take Profit (%): 30.0
- Stop Loss (%): 20.0
Impact of Default Settings
- TSI Length: A longer TSI period smooths out noise but may lag in identifying trends. A shorter period is more responsive but can generate false signals.
- SuperTrend Length: A shorter length provides quicker signals but can be prone to whipsaws. A longer length is more reliable but may delay entries and exits.
- SuperTrend Factor: A higher factor increases the distance of the SuperTrend from the price, reducing sensitivity to minor price fluctuations.
- Trade Direction: Allows flexibility in trading strategies by enabling both long and short trades based on market conditions.
- Take Profit and Stop Loss: These settings manage risk by automatically closing trades at predefined profit or loss levels. Higher percentages provide larger potential gains but also higher risk.

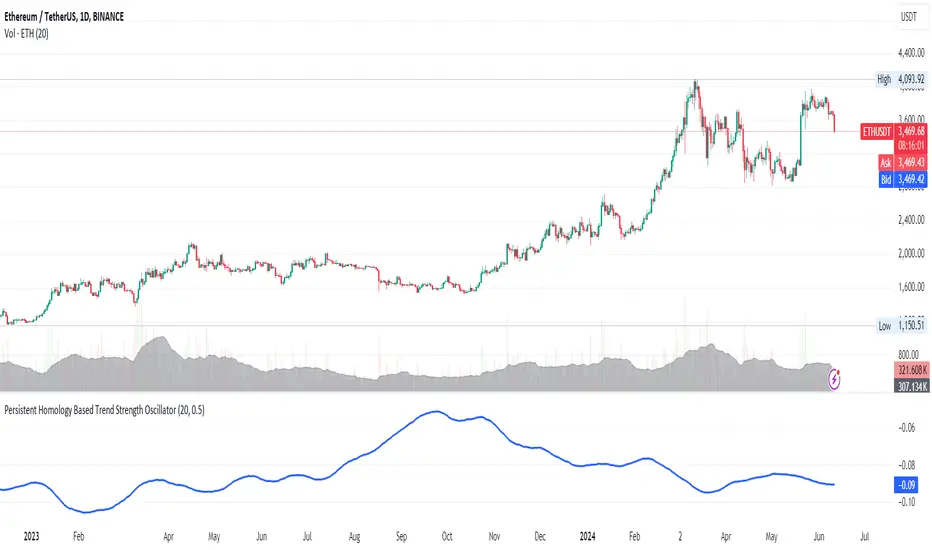
Persistent Homology Based Trend Strength OscillatorPersistent Homology Based Trend Strength Oscillator
The Persistent Homology Based Trend Strength Oscillator is a unique and powerful tool designed to measure the persistence of market trends over a specified rolling window. By applying the principles of persistent homology, this indicator provides traders with valuable insights into the strength and stability of uptrends and downtrends, helping to inform better trading decisions.
What Makes This Indicator Original?
This indicator's originality lies in its application of persistent homology , a method from topological data analysis, to financial markets. Persistent homology examines the shape and features of data across multiple scales, identifying patterns that persist as the scale changes. By adapting this concept, the oscillator tracks the persistence of uptrends and downtrends in price data, offering a novel approach to trend analysis.
Concepts Underlying the Calculations:
Persistent Homology: This method identifies features such as clusters, holes, and voids that persist as the scale changes. In the context of this indicator, it tracks the duration and stability of price trends.
Rolling Window Analysis: The oscillator uses a specified window size to calculate the average length of uptrends and downtrends, providing a dynamic view of trend persistence over time.
Threshold-Based Trend Identification: It differentiates between uptrends and downtrends based on specified thresholds for price changes, ensuring precision in trend detection.
How It Works:
The oscillator monitors consecutive changes in closing prices to identify uptrends and downtrends.
An uptrend is detected when the closing price increase exceeds a specified positive threshold.
A downtrend is detected when the closing price decrease exceeds a specified negative threshold.
The lengths of these trends are recorded and averaged over the chosen window size.
The Trend Persistence Index is calculated as the difference between the average uptrend length and the average downtrend length, providing a measure of trend persistence.
How Traders Can Use It:
Identify Trend Strength: The Trend Persistence Index offers a clear measure of the strength and stability of uptrends and downtrends. A higher value indicates stronger and more persistent uptrends, while a lower value suggests stronger and more persistent downtrends.
Spot Trend Reversals: Significant shifts in the Trend Persistence Index can signal potential trend reversals. For instance, a transition from positive to negative values might indicate a shift from an uptrend to a downtrend.
Confirm Trends: Use the Trend Persistence Index alongside other technical indicators to confirm the strength and duration of trends, enhancing the accuracy of your trading signals.
Manage Risk: Understanding trend persistence can help traders manage risk by identifying periods of high trend stability versus periods of potential volatility. This can be crucial for timing entries and exits.
Example Usage:
Default Settings: Start with the default settings to get a feel for the oscillator’s behavior. Observe how the Trend Persistence Index reacts to different market conditions.
Adjust Thresholds: Fine-tune the positive and negative thresholds based on the asset's volatility to improve trend detection accuracy.
Combine with Other Indicators: Use the Persistent Homology Based Trend Strength Oscillator in conjunction with other technical indicators such as moving averages, RSI, or MACD for a comprehensive analysis.
Backtesting: Conduct backtesting to see how the oscillator would have performed in past market conditions, helping you to refine your trading strategy.
Advanced Fractal and Hurst IndicatorAdvanced Fractal and Hurst Indicator (AFHI)
Description:
The Advanced Fractal and Hurst Indicator (AFHI) is a custom technical analysis tool designed to identify market trends and potential reversals by leveraging the concepts of Fractal Dimension and the Hurst Exponent . These advanced mathematical concepts provide insights into the complexity and persistence of price movements, making this indicator a powerful addition to any trader's toolkit.
How It Works:
Fractal Dimension (FD) :
The Fractal Dimension measures the complexity of price movements. A higher Fractal Dimension indicates a more complex, choppy market, while a lower value suggests smoother trends.
The FD is calculated using the log difference of price movements over a specified length.
Hurst Exponent (HE) :
The Hurst Exponent indicates the tendency of a time series to either regress to the mean or cluster in a direction. Values below 0.5 indicate a tendency to revert to the mean (mean-reverting), while values above 0.5 suggest a trending market.
The HE is calculated using the rescaled range method, comparing the range of price movements to the standard deviation.
Composite Indicator :
The Composite Indicator combines the smoothed Fractal Dimension and Hurst Exponent to provide a single value indicating market conditions. This is done by normalizing the FD and HE values and combining them into one metric.
A positive Composite Indicator suggests an uptrend, while a negative value indicates a downtrend.
Smoothing :
Both FD and HE values are smoothed using a simple moving average to reduce noise and provide clearer signals.
Trend Confirmation :
A 50-period moving average (MA) is used to confirm the trend direction. The price being above the MA indicates an uptrend, while below the MA indicates a downtrend.
Background Shading :
The indicator pane is shaded green during uptrend conditions (positive Composite Indicator and price above MA) and red during downtrend conditions (negative Composite Indicator and price below MA).
How Traders Can Use It:
Identifying Trends :
Traders can use the AFHI to identify current market trends. The background shading in the indicator pane provides a visual cue for trend direction, with green indicating an uptrend and red indicating a downtrend.
Trend Confirmation :
The Composite Indicator line, plotted in purple, helps confirm the trend. Positive values suggest a strong uptrend, while negative values indicate a strong downtrend.
Entry and Exit Signals :
Traders can use the transitions of the Composite Indicator and the background shading to time their entry and exit points. For instance, a shift from red to green shading suggests a potential buy opportunity, while a shift from green to red suggests a potential sell opportunity.
Alerts :
The script includes alert conditions that can notify traders when the Composite Indicator signals a new trend direction. Alerts can be set up for both uptrends and downtrends, helping traders stay informed of key market changes.
Strategy Development :
By integrating AFHI into their trading strategies, traders can develop more robust systems that account for market complexity and persistence. The indicator can be used alongside other technical tools to enhance decision-making and improve trade accuracy.

Heikin Ashi ROC Percentile Strategy**User Guide for the "Heikin Ashi ROC Percentile Strategy"**
This strategy, "Heikin Ashi ROC Percentile Strategy", is designed to provide an easy-to-use framework for trading based on the Heikin Ashi Rate of Change (ROC) and its percentiles.
Here's how you can use it:
1. **Setting the Start Date**: You can set the start date for the strategy in the user inputs at the top of the script. The variable `startDate` defines the point from which the script begins executing trades. Simply input the desired date in the format "YYYY MM DD". For example, to start the strategy from March 3, 2023, you would enter `startDate = timestamp("2023 03 03")`.
2. **Adjusting the Midline, Lookback Period, and Stop Loss Level**: The `zerohLine`, `rocLength`, and `stopLossLevel` inputs allow you to adjust the baseline for ROC, the lookback period for the SMA and ROC, and the level at which the strategy stops the loss, respectively. By tweaking these parameters, you can fine-tune the strategy to better suit your trading style or the particular characteristics of the asset you are trading.
3. **Understanding the Trade Conditions**: The script defines conditions for entering and exiting long and short positions based on crossovers and crossunders of the ROC and the upper and lower "kill lines". These lines are defined as certain percentiles of the ROC's highest and lowest values over a specified lookback period. When the ROC crosses above the lower kill line, the script enters a long position; when it crosses below the upper kill line, it exits the position. Similarly, when the ROC crosses below the upper kill line, the script enters a short position; when it crosses above the lower kill line, it exits the position.
In my testing, this strategy performed best on a day and hour basis. However, I encourage you to experiment with different timeframes and settings to see how the strategy performs under various conditions. Remember, there's no one-size-fits-all approach to trading; what works best will depend on your specific circumstances, goals, and risk tolerance.
If you find other useful applications for this strategy, please let me know in the comments. Your feedback is invaluable in helping to refine and improve this tool. Happy trading!
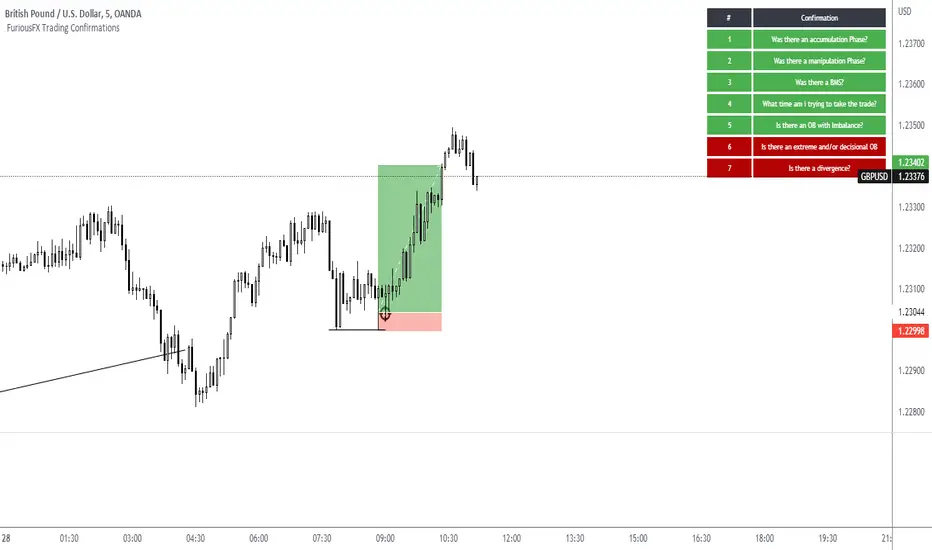
FuriousFX Trading Confirmation ListThis is a simple script that allows user to define the confirmations, position them (pin them) to the top middle bottom left or right on the screen and check them off
Once the user checks the confirmation it changes from red or any other default color to green (indicating it has played out).
There are similar script out there but what makes this script unique is one how it is generated and more importantly the mechanism of changing color.. You also have the option to pick from a pick list in the options of how many (up to 10) confirmations you want to generate and you can define change them at any time..
To use this script simply do the following :
1) add it to your chart, double click on the default table
2)select the desired number of confirmations
3)Select the desired position and default colors (default is top right and dark red)
4)Define your criteria for confirmations in appropriate boxes by writing over the default values
5)Start using it, when you see your desired confirmation, double click on the table again and select "Confirmed?" check box.. Once selected the color of that confirmation will turn green...
This script is done to keep people disciplined and enter only according to their trading strategy, as we all know that the biggest reason why people lose in trading is impatience fear and greed...
This script attemps to solve problems of overtrading, entering too early or too late..
Hope you guys enjoy it..
Feel free to write comments for improvements or copy it for your needs.
SP IndicatorSP Indicator - One of the best indicators for scalping trading on any timeframes. The best readings are given on 5, 15 and 30 minute frames.
For readings, several indicators are combined into one, which allows you to get a more accurate forecast, which is more than 90%.
Instruction.
The indicator is easy to use. Just install it and follow the arrows to go long or short. Stop loss set small, about 1-2%. In most cases, this is sufficient.
Good luck in bidding!
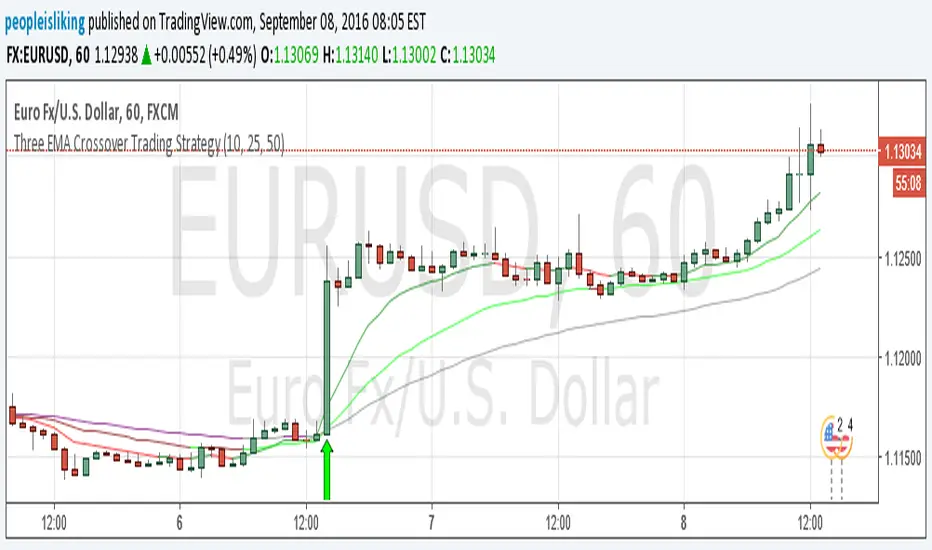
Three EMA Crossover Trading StrategyUse it with any forex currency pair or any stock with any timeframe.
It is a trend following trading strategy so works best in trending market.
So once you identify the market is trading you just simply use this trading strategy.
Video Explanation : Youtube
Detail Explanation : www.peopleisliking.com