Tailwind.(BTC)Imagine the price of Bitcoin is like a person climbing a staircase.
The Steps (Grid): Instead of watching every single price movement, the strategy divides the market into fixed steps. In your configuration, each step measures **3,000 points**. (Examples: 60,000, 63,000, 66,000...).
The Signal: We buy only when the price climbs a full step decisively.
The "Expensive Price" Filter: If the price jumps the step but lands too far away (the candle closes too high), we do not buy. It is like trying to board a train that has already started moving too fast; the risk is too high.
Rigid Exits: The Take Profit (TP) and Stop Loss (SL) are calculated from the edge of the step, not from the specific price where you managed to buy. This preserves the geometric structure of the market.
The Code Logic (Step-by-Step)
A. The Math of the Grid (`math.floor`)
pinescript
level_base = math.floor(close / step_size) * step_size
This is the most important line.
What does it do? It rounds the price down to the nearest multiple of 3,000.
Example: If BTC is at 64,500 and the step size is 3,000:
1. Divide: $64,500 / 3,000 = 21.5$
2. `math.floor` (Floor): Removes the decimals $\rightarrow$ remains $21$.
3. Multiply: $21 * 3,000 = 63,000$.
Result: The code knows that the current "floor" is **63,000**, regardless of whether the price is at 63,001 or 65,999.
B. The Strict Breakout (`strict_cross`)
pinescript
strict_cross = (open < level_base) and (close > level_base)
Most strategies only check if `close > level`. We do things slightly differently:
`open < level_base`: Requires the candle to have "born" *below* the line (e.g., opened at 62,900).
`close > level_base`: Requires the candle to have *finished* above the line (e.g., closed at 63,200).
Why? This avoids entering on gaps (price jumps where the market opens already very high) and confirms that there was real buying power crossing the line.
C. The "Expensive Price" Filter (`max_dist_pct`)
pinescript
limit_price_entry = level_base + (step_size * (max_dist_pct / 100.0))
price_is_valid = close <= limit_price_entry
Here you apply the percentage rule:
-If the level is 63,000 and the next is 66,000 (a difference of 3,000).
-If `max_dist_pct` is **60%**, the limit is $63,000 + (60\% \text{ of } 3,000) = 64,800$.
-If the breakout candle closes at **65,000**, the variable `price_is_valid` will be **false** and it will not enter the trade. This avoids buying at the ceiling.
D. TP and SL Calculation (Anchored to the Level)
pinescript
take_profit = level_base + (step_size * tp_mult)
stop_loss = level_base - (step_size * sl_mult)
Note that we use `level_base` and not `close`.
-If you entered because the price broke 63,000, your SL is calculated starting from 63,000.
-If your SL is 1.0x, your stop will be exactly at 60,000.
This is crucial: If you bought "expensive" (e.g., at 63,500), your real stop is wider (3,500 points) than if you bought cheap (63,100). Because you filter out expensive entries, you protect your Risk/Reward ratio.
E. Visual Management (`var line`)
The code uses `var` variables to remember the TP and SL lines and the `line.set_x2` function to stretch them to the right while the operation remains open, providing that visual reference on the chart until the trade ends.
Workflow Summary
Strategy Parameters:
Total Capital: $20,000
We will use 10% of total capital per trade.
Commissions: 0.1% per trade.
TP: 1.4
SL: 1
Step Size (Grid): 3,000
We use the 200 EMA as a trend filter.
Feel free to experiment with the parameters to your liking. Cheers.
تحليل الاتجاه

Estrategia Momentum Seguro (EMS) Entry and exit signals, this indicator helps or suggests where to enter, exit, or place a stop loss.

Session Volume Profile Sniffer: HVN & Rejection ZonesA simple tool built for traders who rely on intraday volume structure.
What this script does
This script tracks volume distribution inside a selected session and highlights two key price levels:
High Volume Nodes (HVNs) — areas where price spent time building heavy participation.
Low Volume Nodes (LVNs) — thin zones where price moved quickly with very little interest.
Instead of plotting a full profile, this tool gives you the exact rejection-level lines you usually hunt manually.
Why these levels matter
HVN → price tends to react, stall, or flip direction
LVN → price often rejects strongly since liquidity is thin
Rejection patterns around these areas give clean entry signals
Positioning trades around HVN/LVN helps filter noise in choppy sessions
This script removes the trouble of drawing profiles, counting bins, or guessing node levels. Everything is calculated inside the session you choose.
How the detection works
Inside your session window, the script:
1. Tracks each tick-based price bucket
2. Accumulates raw volume for every bucket
Identifies:
HVNs = buckets with volume above a tier
LVNs = buckets with volume below a tier
3. Prints each level as a single clean line
4. Generates:
Long signal → bounce from LVN
Short signal → rejection from HVN
Built-in exits use ATR-based conditions for quick testing.
Features
Session-based volume mapping
HVN + LVN levels drawn automatically
Entry triggers based on rejection
ATR exits for experimental backtests
Clean, minimal visual output
Best use cases
Intraday futures
Index scalping
FX sessions (London / NY)
Crypto sessions (user-timed)
Anyone who trades around volume structure
Adjustable settings
Session window
Volume bin size
HVN multiplier
LVN multiplier
Enable/disable zone lines
This keeps it flexible enough for both scalpers and slow-paced intraday setups.
Important note
This script is built for study + idea testing.
It is not intended as a final system.
Once you identify how price behaves around these nodes, you can blend this tool into your own setup.

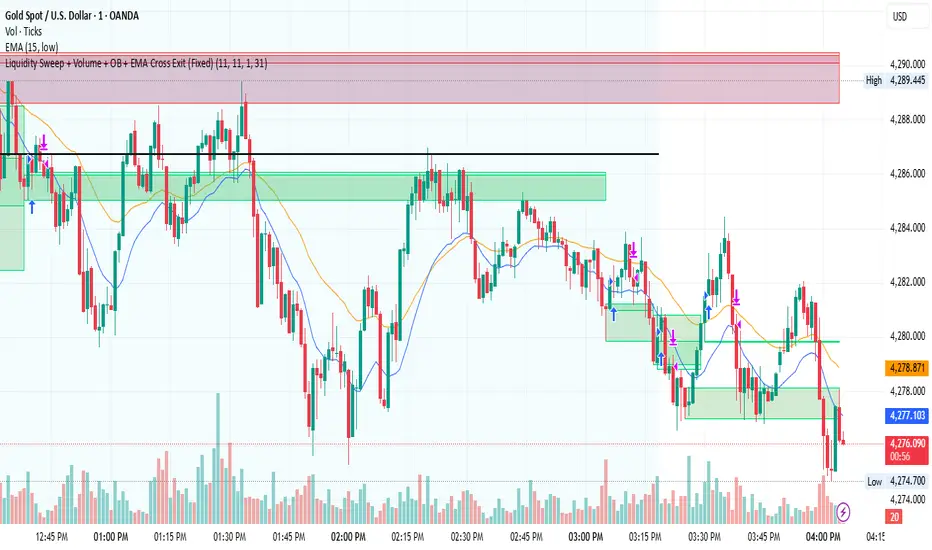
Liquidity Sweep + Volume + OB + EMA Cross Exit This strategy is a smart-money–inspired trading system designed to capture high-probability reversals after liquidity is taken from the market.
It combines liquidity sweeps, volume confirmation, order block validation, and a dynamic EMA-based exit to control risk and let profits run.
Core Concept
Institutions first take liquidity, then move price in the real direction.
This strategy aims to enter after liquidity is swept and price shows confirmation.
1️⃣ Liquidity Sweep Detection
2️⃣ Volume Confirmation
3️⃣ Order Block Identification
4️⃣ EMA Trend Filter (Optional Entry Bias)
5️⃣ Trade Entry Logic
6️⃣ Exit Strategy – EMA Cross Exit
Benefits:
Lets strong trends run
Exits automatically when momentum weakens
Adapts to different market conditions
🛡 Risk & Trade Management
One trade at a time (anti-overtrading logic)
Early exit if trade moves against position after a few bars
Opposite signal forces exit
EMA cross provides trend-based exit
Wavelet Candlestick Slope Follower-Master Edition Here is a short description of this script:
This is a **Trend Following strategy** that utilizes advanced mathematics—the **Wavelet Transform**—to filter out market noise.
**Key Features:**
1. **Synthetic Candles:** The script does not analyze raw prices. Instead, it constructs "Wavelet Candles"—smoothed candles created through mathematical convolution of prices with a specific wavelet "kernel" (e.g., Mexican Hat, Morlet, Haar).
2. **Auto-Correction (Normalization):** This is the most critical technical feature of this code. The script automatically normalizes the weights. This ensures that even when using complex mathematical shapes (like the Mexican Hat), the output price remains accurate to the real chart scale and is not distorted.
3. **Strategy Logic:** The logic is very straightforward—the system enters a **Long** position when the smoothed closing price (`w_close`) is rising, and closes the position when it starts to fall.
4. **Visualization:** It draws new, cleaner candles (green/red) on the chart, revealing the "true" trend structure after filtering out temporary fluctuations.
This is a example of use idea of wavelet candle

80% win-rate 30 second NASDAQ ES 5 micros HIGH-PROFIT-FACTORLong term back testing shows 1.3 profit factor over years of data! Best used on 30 second chart for scalping strategy. Although it works on 1min for free access it is less accurate. 30 second chart has high win rate, big profit factor, tight ATR filtered profit target that is trailing the price as it goes in profit and stoploss is static 2.5 ATR (14 period) on 30 second chart. longer period RSI + EMA CROSS has proven to work well with the algorithms. If you follow the strategy and trade NQ/ES, you will be pleasantly surprised. Be patient and if there is no signal don't take any trades that day! This has a lot of potential to be the best strategy I have ever made. Long term back testing shows 1.3 profit factor over years of data! It is resilient to choppy markets so don't be afraid of false signals. Expect some losses but they are all within reason if you size accordingly. On fresh prop accounts with 2000 drawdown use 5 micros until you scale your account to 5000 worth of capital. I have worked tirelessly to make sure there are minimal number of false signals by utilizing quad RSIs and 3 EMAs with short and long periods so that the strategy utilizes higher time frames for higher probability trades. If the day is choppy the strategy might not take any trades that day saving you capital. If you use this strategy with a trading bot, be aware that there still can be out of norm volatility spikes during news events that can blow your trading account if you don't size properly. This strategy is best if utilized with 2000 drawdown prop accounts and 5 micros max. USE AT YOUR OWN RISK. If you found this strategy useful please keep it for yourself as this can be a blessing if it doesn't experience huge exposure and algorithm get accosted to it as with any other strategy that experiences decay. HIGH VOLOTILITY DAYS IS WHERE THIS STRATEGY SHINES. CHOPPY RANGEY DAYS, ON THE OTHER HAND, THE STRAT CAN BE LESS ACURATE OR NOT TAKE ANY TRADES AT ALL.

Relative Outperformance + EMA Trend Filter (Long Only)Relative Outperformance based on underlying and EMA based trend filtering

SaLaSaLa V6 5m By Aleem MubarakThis strategy uses RSI-MA, Multi-timeframe crossing of RSI, Multi-timeframe crossing of MA and the Crossing of RSI with MA itself on the baseline timeframe (5 minutes), while the alignment timeframes are 15m, 1hr, 4hr.
It uses Bolinger Bands to filter out false breakouts and uses an adjustable step-wise trailing as the exit conditions, so for this reason the strategy has a trailing take profit.
This strategy works best on 5 minutes timeframe for scalpers.
You may find the backtesting result using the tester option on trading view.
Just Integrate your broker on Trading View and make the strategy pick trades automatically and watch your investment grow.
Credit to
Lux Algo, Techno Bloom for their indicators which was used as vision during checks

Trend Core Strategy v1.0 - GUMROADLog Regression Channel Pro Strategy
This is a trend-following pullback strategy built for TradingView (Pine Script v6).
It uses logarithmic regression channels to define the market’s primary trend, and looks for low-risk pullback entries within strong trending conditions.
Momentum and trend strength filters are applied to avoid ranging or weak markets.
This strategy is designed to be used when the market is clearly trending, not during choppy or sideways price action.
Best Used When
Strong uptrend or downtrend is present
Price is pulling back toward the regression channel
Volatility is sufficient (ADX confirms trend strength)
Suitable for 1H / 4H timeframes
Commonly used on BTC, ETH, and major crypto pairs
Key Characteristics
Non-repainting logic
Volatility-based risk management (ATR)
Designed for realistic backtesting
No martingale, no grid, no over-optimization
Gumroad Disclaimer (3 Lines)
This strategy is provided for educational purposes only and is not financial advice.
Trading involves risk, and losses may occur.
You are fully responsible for your own trading decisions.

Ace Algo [Anson5129]🏆 Exclusive Indicator: Ace Algo
📈 Works for stocks, forex, crypto, indices
📈 Easy to use, real-time alerts, no repaint
📈 No grid, no martingale, no hedging
📈 One position at a time
----------------------------------------------------------------------------------------
Ace Algo
A trend-following TradingView strategy using a confluence of technical indicators and time-based rules for structured long/short entries and exits:
----------------------------------------------------------------------------------------
Parameters Explanation
Moving Average Length
Indicates the number of historical data points used for the average price calculation.
Shorter = volatile (short-term trends); longer = smoother (long-term trends, less noise).
Default: 20
Entry delay in bars
After a trade is closed, delay the next entry in bars. The lower the number, the more trades you will get.
Default: 4
Take Profit delay in bars
After a trade is opened, delay the take profit in bars. The lower the number, the more trades you will get.
Default: 3
Enable ADX Filter
No order will be placed when ADX < 20
Default: Uncheck
Block Period
Set a block period during which no trading will take place.
----------------------------------------------------------------------------------------
Entry Condition:
Only Long when the price is above the moving average (Orange line).
Only Short when the price is below the moving average (Orange line).
* Also, with some hidden parameter that I set in the backend.
Exit Condition:
When getting profit:
Trailing Stop Activates after a position has been open for a set number of bars (to avoid premature exits).
When losing money:
In a long position, when the price falls below the moving average, and the conditions for a short position are met, the long position will be closed, and the short position will be opened.
In a short position, when the price rises above the moving average, and the conditions for a long position are met, the short position will be closed, and the long position will be opened.
----------------------------------------------------------------------------------------
How to get access to the strategy
Read the author's instructions on the right to learn how to get access to the strategy.

Daily High/Low Breakout Strategy v2Long and Short trade signal strategy, connects via API key to any exchange, can be used as an indicator. Based on the break of maximum and minimum levels. preferred timeframe 5 minutes.

Daily High Breakout Strategy v2Long trade signal strategy, connects via API key to any exchange, can be used as an indicator. Based on breakout, rebound from daily highs.

Gann High Low Strategy## Trend & Structure Strategy — Overview
This strategy is designed to follow directional market moves by using a **dynamic price reference** to identify transitions between strength and weakness.
### Core concept
* It visually highlights when the market shifts from a **favorable phase** to an **unfavorable phase**, and vice versa.
* Signals are generated only when price behavior shows **minimum structural consistency**, helping to avoid random or low-quality conditions.
### Entries & trade management
* Entries aim to align with moments where price shows a **renewed directional intent**.
* Trade management is based on **technical price references**, allowing risk and objectives to adapt naturally to the current market context.
* Key directional and operational areas are clearly displayed on the chart to keep decision-making simple and visual.
### Best use cases
* Performs best in markets with **clear directional movement** and readable transitions.
* In very tight or choppy conditions, a more selective approach may be required.
*This content is for educational purposes only. Always test on different markets and timeframes before live use.*

Momentum Quality Index Strategyfiles.fm
Welcome to the Momentum Quality Index Strategy!
This is a fairly conservative strategy with a sharp criteria for entries and taking profits. This strategy has been tested amongst the top 50 stocks with volatility over 2%, and the verdict was that the profitability was often times over 85% profitability, often times reaching over 90% profitability. This strategy thrives in more volatile environments, often times beating the buying and holding strategy YTD performance by large margins.
This strategy is highly optimized for the 30 minute chart, giving insights into shorter term movements. It is based on cash trades of $1,000 per position, with a maximum of 4 trades being placed at once.
This strategy is optimized for common stock trading in more liquid markets, and not yet optimized for options trading (however I plan on developing highly profitable strategies for this purpose soon). The take profit is customizable.
I would refer to the image link I have posted at the top of this article for the strategy's effectiveness. The strategy report on this article isn't accurate, as this strategy is based on trading $1,000 per trade, therefore over longer term periods of time will not be as successful due to the fact that there is no compounding. However, over the course of smaller time frames (such as one year), it beats buying and holding of many assets.
This strategy is meant for day trading and short term swing trading, and is not meant to beat buying and holding of successful assets over the course of long periods of time.

Monarch Strategies Altcoin Optimized Cycle & Trend Strategy (1W)The Altcoin Optimized Cycle & Trend Strategy (1W) is a professional, long-term cycle and trend trading strategy designed specifically for altcoins such as Stellar (XLM). It is built for traders and investors who want to systematically capture explosive altcoin cycles while avoiding emotional decision-making and excessive trading.
The strategy operates on the weekly timeframe (1W) and focuses on identifying major accumulation zones, breakout phases, and distribution tops that typically define altcoin market behavior.

PMax - Asymmetric MultipliersDescription: This script is an enhanced version of the popular PMax (Profit Maximizer) indicator, originally developed by KivancOzbilgic. It has been converted into a full strategy with advanced customization options for backtesting and trend following.
Key Features & Modifications:
Asymmetric ATR Multipliers: Unlike the standard version, this script allows you to set different ATR multipliers for Upper (Short/Resistance) and Lower (Long/Support) bands.
Default Upper: 1.5 (Tighter trailing for Short positions)
Default Lower: 3.0 (Wider trailing for Long positions to avoid whipsaws)
Expanded MA Types: Added HULL (HMA) and VAR (Variable Index Dynamic Average) options.
VAR is highly recommended for filtering out noise in ranging markets.
HULL is ideal for scalping and faster reactions.
Built-in Risk Management: A fixed 5% Stop Loss mechanism is integrated into the strategy. It protects your capital by closing positions if the price moves 5% against you, even if the trend hasn't reversed yet.
Visibility Fix: Solved the issue where the PMax line would disappear or start at zero in the initial bars.
How to Use:
Use the VAR MA type for trend following in volatile markets.
Adjust the "Stop Loss Percent" input to fit your risk appetite.
The strategy employs an "Always In" logic (Long/Short) but respects the hard Stop Loss.
Credits: Original PMax logic by KivancOzbilgic.

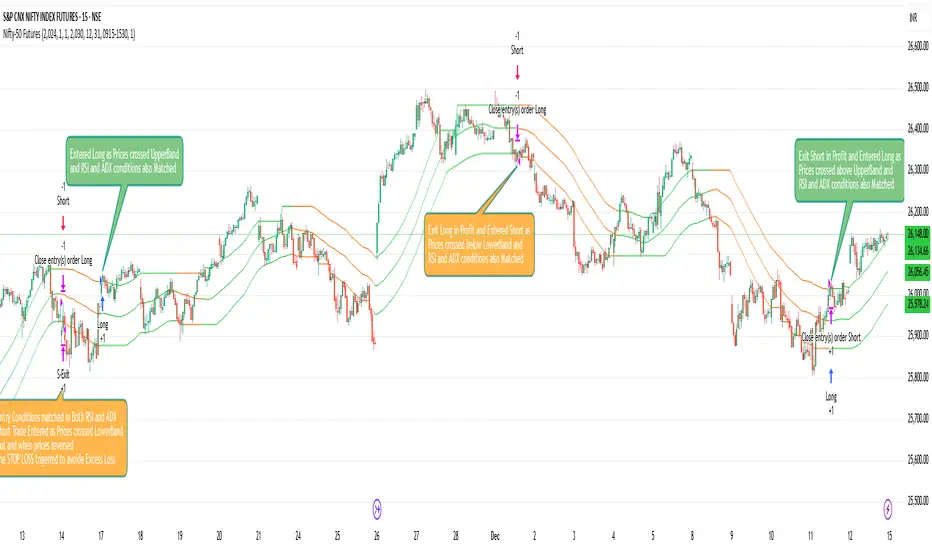
Nifty-50 Futures Trading Ideas/ Strategyb]Nifty-50 Futures Trading Ideas is a trend-following strategy designed for study and backtesting .
The strategy identifies directional bias using a structured price-based approach and applies ADX + DI and RSI filters to validate trend strength.
It includes inbuilt risk-management logic such as Stop-Loss, Take-Profit, ATR-based exits, separate maximum loss per trade (₹) for long and short positions, and optional date/session filters.
This script is provided for educational and analytical purposes only and is not a trading signal or investment recommendation.
Quantum X StrategyQuantum X Strategy is a structured market-behavior based trading model developed for Midcap Nifty on the 15-minute timeframe.
It focuses on identifying directional strength, momentum alignment, and price participation using a multi-factor confirmation approach.
Rather than relying on a single indicator, the strategy evaluates multiple dimensions of price movement to determine whether the market environment is favorable for participation. This helps in avoiding random entries during low-quality or sideways conditions.
🔍 Conceptual Framework
The strategy dynamically observes:
Momentum expansion and contraction
Trend participation strength
Directional consistency over recent price action
Each market condition contributes to an internal decision process, allowing trades only when sufficient alignment is present. This approach helps filter out noise and improves trade selectivity.
📊 Trade Execution Philosophy
Trades are initiated only when market structure shows clear directional intent
Both bullish and bearish opportunities are evaluated independently
Positions are exited when momentum balance weakens or returns to a neutral state
No over-trading during indecisive phases
The system is designed to stay inactive during uncertain market conditions, which is a key part of its risk-aware behavior.
🕒 Backtesting Scope
For consistency and reliability, the strategy logic is activated only from January 2024 onward, ensuring analysis is focused on recent market behavior rather than outdated volatility patterns.
⚙️ Usage Guidelines
Instrument: MIDCAPNIFTY
Timeframe: 15 Minutes
Suitable for intraday and short-term positional observation
Works best when combined with disciplined risk management
⚠️ Disclaimer
This strategy is provided strictly for educational and research purposes.
Market conditions change, and past performance does not guarantee future results. Users should always forward-test and apply their own risk management before live use.

Nifty-50 Futures trading ideas with RSI and ADX FilterNifty Futures @15M is a trend-following strategy derived from the Savitzky Flow Bands methodology by ChartPrime , adapted into a complete strategy with structured trade execution and risk controls.
The strategy identifies directional bias using a Savitzky-smoothed price structure and executes trades based on trend changes or continuation, depending on the selected entry mode.
Configurable Entry Modes are : 1. Change Only (trend reversal based) 2.Continuation Allowed (trend follow-through).
Optional ADX + DI and RSI filters help validate trend strength and avoid unfavorable market conditions.
Risk management features include configurable Stop-Loss and Take-Profit, ATR-based exits, trailing stop, and separate maximum loss per trade (₹) for long and short positions.
Date and session filters are provided for controlled backtesting.
This script is published for educational and analytical purposes only and is intended for research and backtesting, not as a trading signal or investment recommendation.
Credits:
Original indicator concept: Savitzky Flow Bands by ChartPrime
Strategy conversion & enhancements: @Alpha_Trinity

Range Strategy (kasatura84)Winning Range Strategy (Set Heikin Ashi Candles)
Incredible winning strategy. You have to set Heikin Ashi Candles to activate strategy! It works both long and short trades.

Scalping EMA + Pinbar Strategy (London & NY only, BE @ 1R)The scalping trading system uses two types of indicators:
EMA 10, EMA 21, EMA 50
Pinbar Indicator
Rules for entering a buy order:
If the closing price is above the EMA 50, the trend is uptrend and only buy orders should be considered.
The EMA 10 and EMA 21 lines must simultaneously be above the EMA 50.
The price must correct down at least 50% of the area created by the EMA 10 and EMA 21, or correct further down.
A Type 1 Pinbar candle (marked by the Pinbar indicator) must appear; this Pinbar candle must react to at least one of the three EMA lines (EMA 10, EMA 21, EMA 50) and close above the EMA 50.
This Pinbar candle must have a Pinbar strength value (marked by the Pinbar indicator) less than 2 to be considered valid. Check if the closing price of this pinbar candle is higher than the 50-day EMA and if the 10-day and 21-day EMAs are also higher than the 50-day EMA. If so, the conditions have been met and you can begin trading.
Place a buy stop order 0.1 pip higher than the highest price of the pinbar candle, and a stop loss order 0.1 pip lower than the lowest price of the pinbar candle. Set the take profit at 3R.
If the price moves past the previously set stop loss, cancel the pending order.
When the price moves 1R, move the stop loss back to the entry point.
The next trade can only be executed after the previous trade has moved the stop loss back to the entry point.
Rules for placing sell orders:
If the closing price is below the 50-day EMA, the trend is bearish, and only sell orders should be considered. The 10-day and 21-day EMAs must both be below the 50-day EMA.
The price must correct downwards by at least 50% of the area formed by the 10-day and 21-day EMAs, or even further.
A Type 1 pinbar candle (marked by the Pinbar indicator) must appear. This pinbar candle must react to at least one of the three EMAs (EMA 10, EMA 21, EMA 50) and close below the EMA 50.
This pinbar is valid if its strength (indicated by the Pinbar indicator) is less than 2. Verify that the closing price of this pinbar candle is below the EMA 50 and that both the EMA 10 and EMA 21 are below the EMA 50. If all conditions are met, the trade can be executed.
(This appears to be a separate entry rule and not part of the previous text.) Place a sell stop order 0.1 pip below the lowest point of the pinbar candle, and a stop loss order 0.1 pip above the highest point of the pinbar candle. Set the take profit point at 3R.
If the price moves past the previously set stop-loss point, cancel the pending order.
When the price moves 1R, move the stop-loss point back to the entry point.
The next trade can only be executed after the previous trade has moved the stop-loss point back to the entry point.

AlphaGen ME V.15.12AlphaGen ME V.15.10 is an ATR-based trend-following strategy with dynamic trailing stops and EMA filter, designed for automated Crypto perpetual trading.
Core Logic:
• ATR Trailing Stops: Dynamically adjusts stop-loss using ATR(10) × 3.0 multiplier
• 200 EMA Trend Filter: Optional Only takes longs above EMA, shorts below EMA
• Reversal System: Flips positions when trend changes (filter-aware)
• MACD Acceleration Exit: Optional momentum-based profit taking
Position Sizing Modes:
• Simple % of Equity (default 90%) - Safe leverage control
• Risk % of Equity - Fixed risk per trade
• Fixed Contract Size - Consistent lot sizing
Webhook Integration:
Routes signals directly to AlphaGen-AI for execution on:
• Hyperliquid DEX
• AsterDEX
Requirements:
• AlphaGen-AI Pro subscription for webhook routing
• Hyperliquid or AsterDEX Wallets
• TradingView alerts configured with passphrase
Risk Disclosure: Trading involves substantial risk. Past performance does not guarantee future results. Only trade with capital you can afford to lose.

DAX-30 ATRXVersion 1 of DAX-30 ATRX algo.
Revised versions may be available in future.
To be used on the 45 minute timeframe only.
Algorithm is also profitable on the NAS100 - but use with caution.
Optimized Settings:
Higher-TF for trend bias - 4 hours
HTF EMA length - 5
Min HA body size (pts) - 0.5
RSI length - 14
RSI threshold for longs - 40
Fisher length - 11
Volume MA length - 20
Volume spike multiplier - 1.2
ATR length - 14
ATR-mean length - 80
Min ATR / ATR_mean multiplier - 0.8
Max ATR / ATR_mean multiplier - 2.5
SL = ATR x - 0.9
TP = ATR x - 2.1
NY Session ON
Max trades per day - 1
