Larry Williams Qualified Trend Break Signals [tradeviZion]Larry Williams Qualified Trend Break Signals - Description
📖 Introduction
Welcome to the Larry Williams Qualified Trend Break Signals indicator. This description explains how the indicator works, its settings, and how to use it.
This indicator demonstrates Larry Williams' Qualified Trend Line Break technique - his preferred method for timing precise entries on daily charts when you already have a confirmed market setup.
---
🎯 About This Script
This indicator implements the Qualified Trend Line Break system - an entry technique that qualifies trend line breaks for better timing.
Important: This is NOT a signal generator. It's an entry timing tool for traders who already have a market setup and confirmation. Use it only after establishing weekly bias and daily confirmation.
Why We Made This Indicator:
This indicator demonstrates Larry Williams' favorite entry technique for daily timeframe trading. It's designed to be used as part of his complete methodology:
How To Use It Properly:
First, establish your setup: Check weekly chart for overall market bias (bullish/bearish)
Then confirm on daily: Look for confirmation signals on daily timeframe
Finally, use trend breaks: Enter trades only when trend breaks align with your setup direction
Important Warning: This is NOT a standalone buy/sell signal indicator. Using trend breaks without proper setup and confirmation will likely produce poor results. It's a timing tool for entries, not a signal generator.
---
About The Qualification Rules
The system improves on qualification methodology with these key changes:
For BUY signals (breaking above downtrend lines):
Break is usually bad if previous bar closed higher
But can still be good if:
Previous bar was inside the prior bar AND that prior bar closed lower
Price gaps above trend line and moves up at least one tick
Previous bar closed below its own opening price
For SELL signals (breaking below uptrend lines):
Break is usually bad if previous bar closed lower
But can still be good if:
Previous bar was inside the prior bar AND that prior bar closed higher
Price gaps below trend line and moves down at least one tick
Previous bar closed above its own opening price
---
📐 How The Qualification System Works
The trend break system is based on qualification methodology as developed by Larry Williams . It solves the problem where trend line breaks often fail and price goes back.
Trend Line Setup:
For BUY signals: Connect the two most recent declining swing highs to make a downtrend line
For SELL signals: Connect the two most recent rising swing lows to make an uptrend line
Inside Bar Rule:
A key principle: Trend breaks that occur on inside bars are completely ignored. The system only evaluates breaks that occur on regular bars, making signals more reliable.
How It Works In The Code
The indicator follows these steps:
Finds swing points: Identifies highs and lows in the price action
Draws trend lines: Connects 2 recent swing points to make trend lines
Checks inside bars: Ignores breaks that happen on inside bars
Qualifies signals: Uses the rules to check if breaks are good or bad
Shows signals: Only displays qualified BUY/SELL signals
Optional feature: Can show disqualified signals
⚙️ Settings
The indicator has 3 groups of settings to customize how it works.
---
📊 Signal Settings
Show Signals
Default: ON
ON: Displays green/red labels when trend breaks qualify for entry
OFF: Hides entry labels (trend lines still show for analysis)
Remember: These are entry TIMING signals, not standalone buy/sell signals
Signal Selection
Default: Both | Options: Buy Only, Sell Only, Both
Buy Only: Shows only BUY signals
Sell Only: Shows only SELL signals
Both: Shows both BUY and SELL signals
Break Validation
Default: Close | Options: Break Level, Close
Break Level: Signal when price touches the trend line (more signals)
Close: Signal when bar closes beyond trend line (fewer signals)
Tip: Try "Close" first for better signals
Show Disqualified
Default: OFF | Options: ON/OFF
What it does: Shows bad breaks
ON: Shows gray ❌ labels with explanations
OFF: Hides bad signals
👁️ Display Settings
Show Trend Lines
Default: ON
What it does: Shows trend lines on the chart
Looks like: Dashed blue lines connecting swing points
Goes to: Extends into future bars
Why: Shows where breakouts are expected
Show Swing Points
Default: ON
What it does: Marks highs/lows used for trend lines
Looks like: Shape markers at swing locations
Shows: How trend lines are constructed
Marker Style
Default: Circle | Options: Circle, Triangle, Square, Diamond, Cross
What it does: Choose shape for swing markers
Options: Circle, Triangle, Square, Diamond, Cross
Best choice: Circle is clear without being busy
Marker Size
Default: 3 | Range: 1-10
What it does: Controls marker size
Range: 1 (tiny) to 10 (large)
Show Inside Bars
Default: ON
What it does: Highlights inside bars
Looks like: Light orange background on inside bars
Note: These bars are ignored for break qualification
Important: Inside bars are ignored for break qualification
🎨 Colors
Signal Colors
Buy Signal (Default: Green) - Color for good BUY signals
Sell Signal (Default: Red) - Color for good SELL signals
Disqualified (Default: Gray) - Color for bad signals
Display Colors
Trend Line (Default: Blue) - Color for trend lines and markers
Inside Bar (Default: Light Orange) - Background for inside bars
💡 How To Use It In Larry Williams Methodology
Step 1 - Weekly Setup: Identify market bias on weekly chart (clear bullish/bearish trend)
Step 2 - Daily Confirmation: Find confirmation signals on daily timeframe
Step 3 - Trend Break Entry: Use qualified trend breaks only in setup direction
Important: Never enter based on trend breaks alone - always require setup + confirmation first
⚠️ Important Notice
This indicator implements Larry Williams' trend break entry technique. It should NOT be used as standalone buy/sell signals. Only use trend breaks for entry timing after you have established a proper market setup and confirmation. Poor results will occur if using signals without the complete Larry Williams methodology.
Credits: Based on Larry Williams' trading approach and qualification methodology. Swing detection logic adapted from "Larry Williams: Market Structure" by Smollet.
Trendbreak

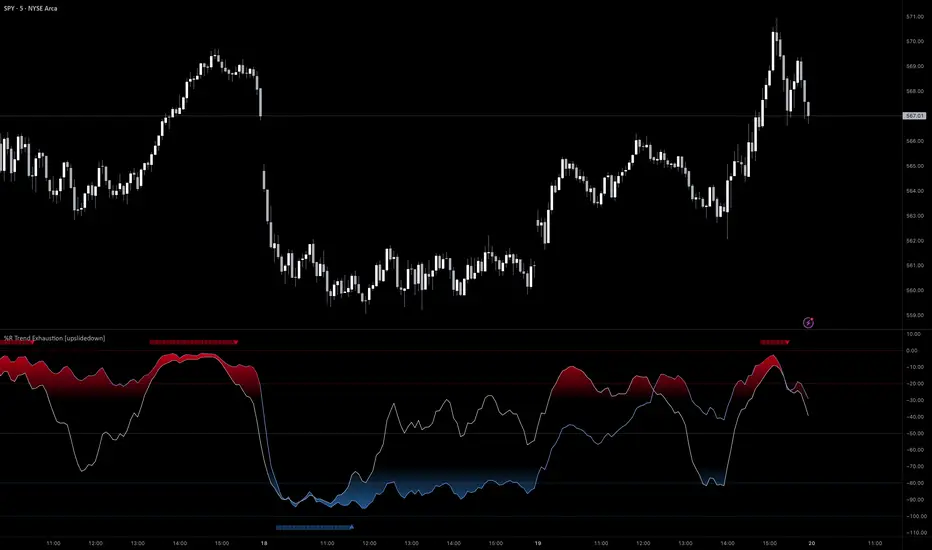
%R Trend Exhaustion [upslidedown]I love Williams %R! This indicator mixes two %R periods... a standard %R with a longer period %R. The longer period of 112 has interesting results for trend following strategies in the crypto market through backtesting.
Alone these are fairly ordinary but together they provide a very interesting trend exhaustion/reversal system while filtering out some noise. I have highlighted key areas of interest with filled boxes. An "area of interest" is when there is confluence between the short and long period %R values along with being overbought or oversold. Once there is a break in the overbought or oversold trend, an arrow will print.
This is one of my odder ideas that appears to have some merit and detects interesting tops or bottoms (or confirms a trend reversal) so I'm publicly publishing for the community to find. If you find this useful please reach out and let me know how you use it as it's fairly unique... and thus different than anything I've ever seen or used.
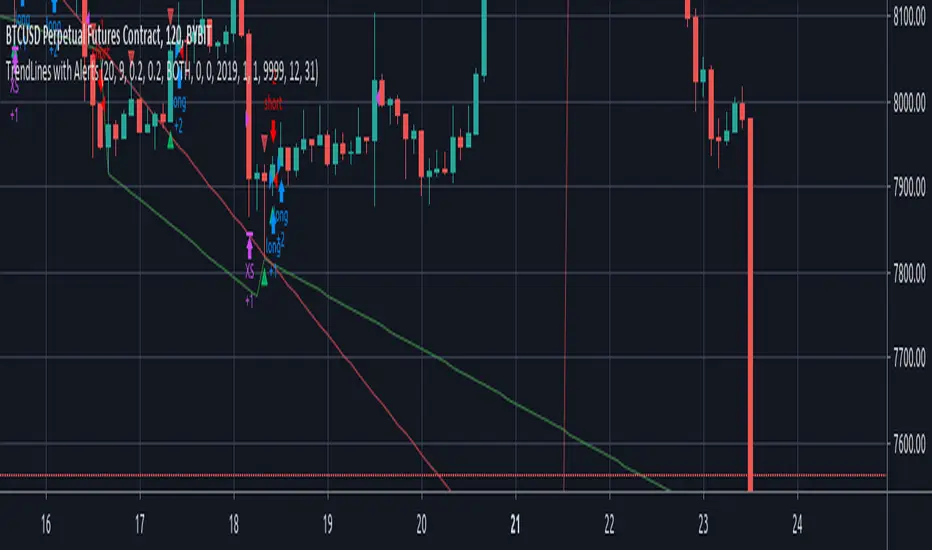
TrendLines with AlertsThis isn't my own work, hence giving it in Open Source library for others to benefit from it too.
I have tried to refin the output of trendlines in this Strategy
The original Code is available at
The script needs some modifications, so I'll be making further updates in future, but for now I'm publishing this because most people don't know how to track trandlines, moreover, some use Line.New() by tradingview Pinescript, which again is a bit difficult to deal with.
This script is a basic version of trendlines on a certain angle (anglecheck was provided by the original author in his script).
Nothing fancy in this script.
Also Converted the original Script to Pinescript v4.
ADX Di+ Di- [Gu5]Fill indicates Strong Trend
Cross indicates End of Trend
--
El relleno indica una fuerte tendencia cuando el Di supera "Level Trend"
El cruce de Di+ con Di- indica el fin de la tendencia
Cuando el valor del ADX es menor a "Level Range", estamos en Rango
