ATR Trend Run - Signals Alerts SL and TP by Tech Store OnThe script uses several ATR formulas for entering/exiting trades, support/resistance lines to take TP1 (take profit 1) and another ATR formula for TP2 (take profit 2). Everything is fully configurable to your preference, and you can back-test it via TradingView. You can also configure the indicator for signals during US trading sessions (with or without power hour), as well as taking profits/stop-loss session time(s), as well as to close a position at the end of the trading session no matter what. Also, you can turn all of that off, so there are no trading session/end of day limits and each trade will run until it either hits SL, TP1, TP1 > back to entry, TP2. Note: indicator is set to skip consecutive/opposite signals, while you currently have a trade open > if you hit a trend – ride it to the end!
For example: If you will be day trading SPY and you wish to close your positions no matter what right before the market closes (3:45PM ET > 15min before closes): Make sure to checkbox “Intraday – Close Position Before Market Closes” in the strategy/indicator Settings, so that you are alerted soon before the market closes, if you wish to continue holding the position – leave this checkbox unchecked.
SL: SL is set to be slightly above/below the signal candle, which is best suited for this strategy.
Strategy Take Profit Approach
While the initial position open and SL hit is always based on a closed candle bar (can’t do otherwise, as otherwise you will have 10s of fake signal alerts), there are 2 ways on trading this strategy in terms of TP1 and TP1 taken > back to Entry, which is based off Alert type.
You can switch this as you like within the indicator settings, “Checked: TP1 taken > back to Entry per Price Touch | Unchecked: per Candle Close”.
Candle Close vs Price Touch: with the Default method - Candle Close for an alert for TP1 or if price comes back to Entry after TP1 is taken will only be triggered once candle bar fully closes crossing the area, while Price Touch will alert when price touches the area before candle bar closes.
For example: your trade is running well, you grab TP1 and the price reverses and hits your trade Entry area. With Price Touch – you are immediately alerted to close your trade with no loss and with TP1 profit. With Candle Close - you will receive an alert only once candle bar fully closes on top of the Entry crossing it backwards, meaning it may lower your TP1 profit or even completely reverse the trade into loss in case it will be a huge candle bar for any reason. However, it may touch the Entry area, looking like the price is reversing, but then continue per initial trade direction, sometimes becoming a trend. So, while Price Touch seem like a more conservative approach, Candle Close can give you much bigger profits if you catch a trend, but you can always change it via the Settings.
Note: TradingView back-testing engine does not have a feature to open/close orders IMMEDIATELY via Price Touch trigger, but only when the candle closes after price touches the scripted area/line/etc., so you for the most accurate results, test your strategy out via Candle Close setting. Otherwise, decide yourself. I personally like more Candle Close since I can test it out via back-testing with the most accurate results.
TP2 is set per Candle Close as often the ATR trailing stop line will be hit and bounced off, so it’s best to wait until candle actually breaks it/closes through it.
Note: If you will be observing the strategy LIVE, during LIVE candle bar movement – it will look weird, like it’s placing an order after order during any trigger – this seem like a TradingView bug, but is only observational, once the candle bar is closed and you refresh TradingView it will all look correct.
Back-Testing
If you wish to do some back-testing, just modify the strategy/indicator Settings:
-----1) STRATEGY: This is for back-testing/experimenting with the script inputs.
----------a. You can setup a start date (date, month, year) from which it will start opening back-test trades, select a position size and select TP1 size, the idea here is to close half (or whatever you choose) portion of the trade once you hit your TP1, then to either close at small profit or to catch a trend and close the second portion of the position long way ahead from Entry, otherwise it will alert you to close the position at TP2, if price comes back to Entry, at reversal signal or at the end of US trading session if the option for it is checked. If you wish to close the whole position at TP1, just enter the same amount for TP1 to match backtest position size. Otherwise you can experiment with TP1 sizing – try it out!
-----2) Feel free to experiment with ATR settings and with S&R Left/Right bars, you may be amazed how results will differ and find some really cool combinations!
-----3) Make sure you select/de-select “Intraday – Close Position Before Market Closes” setting depending on what you are back-testing and on which conditions
-----4) Note: If you wish to do some deep back-testing (1+ years), use the “Deep Backtesting” feature within Strategy Tester on the TradingView as otherwise it may show wrong results or even fail to compute the results
Add the alerts
-----Right-click anywhere on the TradingView chart
-----Click on Add alert
-----Condition: ATR Trend Run - Signals Alerts SL and TP, by Tech Store On
----------o Right underneath the condition click on the drop-down menu and select “alert() function calls only”
-----Expiration time: Whatever you wish
-----Alert actions: Whatever notifications you wish
-----Alert name: DO NOT TOUCH THIS
-----Hit “Create”
-----Note: If you change ANY Settings within the indicator – you must DELETE the current alert and create a new one per steps above, otherwise it will continue triggering alerts per old Settings!
- Note: If you add the alert while the script is currently “In Position” it will not know that. So either wait when there will be no position open at all or close your position partially if the bot opens it twice bigger or so in case per script the bot will think it is already in position.
Note: Because of the slippage and the order processing time between TradingView, AutoView and the Broker (it’s usually about a second or so), it is suggested to not use a timeframe lower than 1min. The script is working really well with 1M/3M/5M/H1/H4 timeframes per my back-testing, but feel free to explore via Strategy Back-testing what’s best for the instrument you wish to trade.
If you wish to try this out for a week or so – please reach out and I will give you access.
Trendtrading

Keltner Channel Volatility FilterOVERVIEW
The Keltner Channel Volatility Filter indicator is a technical indicator that gauges the amount of volatility currently present in the market. The purpose of this indicator is to filter out with-trend signals during ranging/non-trending/consolidating conditions.
CONCEPTS
This indicator assists traders in capitalizing on the assumption that trends are more likely to start during periods of high volatility compared to periods of low volatility . This is because high volatility indicates that there are bigger players currently in the market, which is necessary to begin a sustained trending move.
So, to determine whether the current volatility in the market is low, the KCVF will grey out all bars whose average price is within the Keltner Channels.
If the average price breaks out of the Keltner Channels , it is reasonable to assume we are in a high-volatility period. Thus, this is the ideal time to enter a trending trade due to the assumption that trends are more likely to start during these high-volatility periods.
HOW DO I READ THIS INDICATOR
When the candles are greyed out, don't take any trend trades since the current volatility is less than the usual volatility experienced in the market.
When the candles aren't greyed out, take all valid with-trend trades since the current volatility is greater than the usual volatility experienced in the market.

Qube [AstrideUnicorn]Qube is an indicator that shows market regimes. It is able to detect medium and long term trends and ranging markets. If the indicator bars are colored blue and are between the two blue lines, it means that the market is in sideways movement or consolidation. If indicator bars cross the upper boundary and are colored green, it means that the market is in an uptrend. Red bars crossing the lower blue line indicate a downward trend. The red or green columns are further referred as signal bars.
The indicator is based on the normalized momentum oscillator raised to the third power. This is done to increase the sensitivity of the indicator and to emphasize the difference between the market modes.
The indicator can be used in different ways. One of them is determining the trend direction based on the last signal bar. Even if the current indicator bar is blue (showing range or consolidation), the user should consider the longer-term market mode as upward if the last signal bar is green. And vice versa, if the last signal bar is red, the current market bias is downward. One other way to use the indicator is to catch active price impulses, when columns of the same color (red or green) appear consecutively.

Mastering Market Structure"Market structure first, always" - Mr. Anderson aka TrueCrypto28 right before he went on to master Kung-Fu
Understanding and identifying market structure is essential for successful and consistent profitability. No system is perfect, but trading in the direction of the prevailing market structure can reduce the likelihood of being caught severely offsides and can yield trades with tighter invalidations and greater risk-to-reward potential.
This script will automatically identify and plot the following:
Market Structure
Pivot highs and lows using the lookback left and right lengths are analyzed to identify major swing highs and lows to identify the current trading range.
Bullish structure is characterized by a series of higher highs and higher lows.
Bearish Structure is characterized by lower highs and lower lows.
Structure breaks when a bar closes outside the current trading range. Major swing highs and lows will update following these breaks to continue following the current price action
Current market structure bias, bullish or bearish, can be displayed in a table in the location of your choosing.
Structure is fractal, so seeing low time frame structure shift against the high time frame structure can identify the beginning of a pullback. When it realigns with the high timeframe structure, it can identify the beginning of the high time frame trend continuation. You can choose to analyze structure on any timeframe with this script and even add multiple copies of it to your chart each analyzing different a timeframes to easily find high quality trade opportunities.
Fibonacci Levels of the current trading range
These are included to help identify areas of interest for trade execution and profit levels.
We want to buy at a discount and sell at a premium. The "Wholesale Zone" can be considered below the 50% retracement level in bullish structure, or above it in a bearish structure.
When in a bullish structure, "discount" buy opportunities can be found below the 50% retracement level with the expectation of trend continuation.
In a bearish structure, more ideal "premium' sell opportunities can be found above the 50% retracement with the expectation of trend continuation.
Optimal trade entry (OTE) zone, between the 61.8% and 78.6% retracement can offer a great risk-to-reward ratio for execution of a new position in trending environments.
When trading sideways in a range, opening new buy positions near the bottom of the range or new sell positions from the top of the range are preferred. Midrange 50% level commonly sees some reaction and can be used as a primary target with further targets either being the opposite end of the range or lower support levels (see order block section).
Order Blocks
New Bullish and bearish order blocks are created and plotted with every respective market structure break. They identify the price level from which the most recent leg of price action that yielded the structure break began.
In strong trending environments, these levels should continue to support or resist price. They are great areas to look to enter new positions.
Order blocks can also be used as targets for your trades to avoid giving back unrealized profits as price tends to react off of these levels.
To keep your chart clean and the order blocks relevant, an order block will be automatically deleted if price trades through and closes beyond it. Otherwise, printed order blocks will remain on your chart until either it's origin bar is out of TradingView's maximum bar history allowance or their maximum box count allowance.
Pairing these with fibonacci levels, retracements into order blocks that are in the Wholesale Zone or even the OTE zone offer higher probability trades with more favorable risk-to-reward potential.
Swing Failure
Swing failure patterns (SFPs) arise when a candle takes out a swing high or low, but fails to close beyond it.
Again, pairing these with other features of this script like range boundaries, wholesale zones, OTE zones, and order blocks can help traders identify the best times to actually execute their trade as SFPs are commonly seen at points of inflection in price action.
Moving Averages
Up to 4 moving averages from the current time frame are available. MA type and lengths can be adjusted to your preference.
Up to 4 MTF MAs. By Default this is an EMA 200 as it is commonly used for trend identification and support/resistance.
These are included for confluence of trend direction and strength.
They can also act as dynamic support and resistance and so can be useful for trade execution if price bounces or rejects off of them or targets as price may do so when it reaches them.
Additionally, alerts have been coded for the following scenarios:
MS Break alerts will trigger on bar close when a break in market structure has been confirmed.
SFP alerts will trigger on bar close when the swing failure pattern has been confirmed.
Entering OB alerts will trigger as soon as price touches the closest order block.
Entering Wholesale Zone alerts will trigger as soon as price cross the 50% retracement level. This can be used as an early alert to identify assets that have undergone a significant pullback before potential continuation in the direction of the main trend.
Entering OTE Zone alerts will trigger as soon as price crosses into the Optimal Trade Entry zone between the 61.8% and 78.6% retracement.
This script is unique in the way that it tracks market structure, automatically updates as price action continues to develop, presents high quality areas of interest, and SFPs for trend reversal and continuation. Traders will no longer need to constantly monitor their charts or exhaustively update their alerts to find good trade opportunities. This script takes care of all of it automatically. Collectively, all of the included features can be used to build a complete trading system.

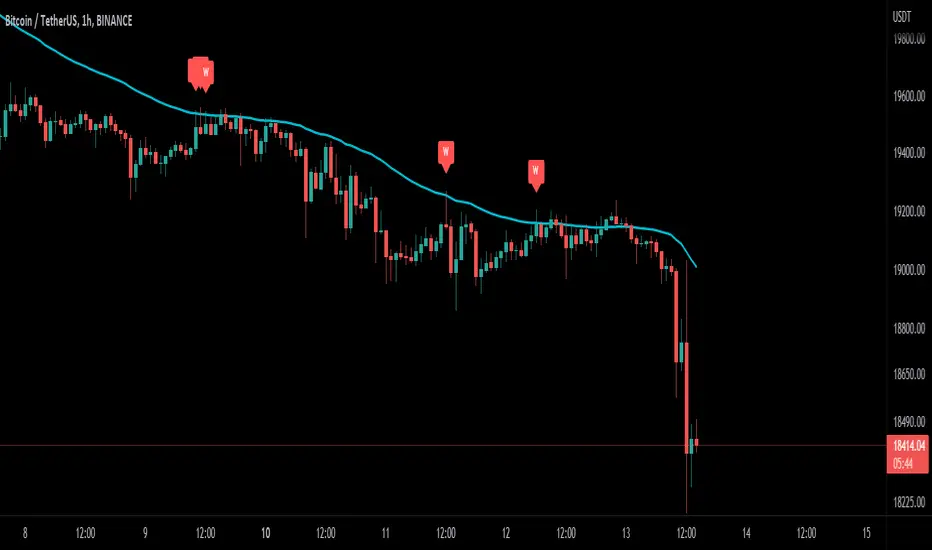
Wick-off Check Moving Average [Misu]█ This Indicator shows a wick-off check pattern applied to a moving average.
This pattern appears when a candle opens below the moving average and closes above it, or when it opens above a moving average and closes below it. This causes a wick to go through the moving average: a wick-off check moving average.
█ Usages:
This indicator detects small pullbacks in a trend. This is mainly used for trading continuation strategies.
It can also be used to validate a resistance or support level .
█ Features:
> Average Wick Validation: You can validate a wick-off check pattern depending on the average wick size. This is configured with parameters "Lenght Avg Wick Validation" and "Factor Wick Validation".
> Trend Validation: A trend is taken into account when detecting a "continuation pattern". A trend is validated if X candles close above (up trend) or under (down trend) the moving average. This "X" is defined by "Length Bar - Trend Validation" parameter.
> Buy and Sell: Labels are showing wick-of check patterns but can be interpreted as a buy & sell signal.
> Multi Moving Average.
> Alerts.
█ Parameters:
Method Multi MA : The method for calculating the moving average.
Multi MA Length : The length used to calculate the moving average.
Length Bar - Trend Validation : Define the number of bar needed to validate a trend. When price is above the MA, trend is up. When price is under MA, trend is down.
Wickoff Mode : Mode used to detect Wickoff check pattern.
> continuation pattern: only shows wick-off check pattern in a confirmed trend.
> no trend in progress: only shows wick-off check pattern in a not confirmed trend.
> both: shows both.
Lenght Avg Wick Validation : Lenght used to calculate the average wick size.
Factor Wick Validation : Factor used to validate the length of a wick when a wick-off check is detected.
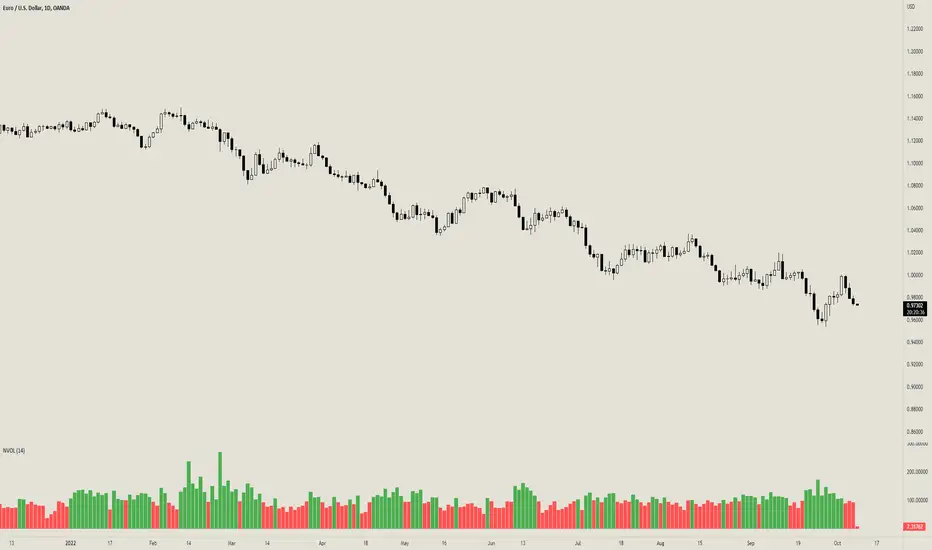
Normalized VolatilityOVERVIEW
The Normalized Volatility indicator is a technical indicator that gauges the amount of volatility currently present in the market, relative to the average volatility in the market. The purpose of this indicator is to filter out with-trend signals during ranging/non-trending/consolidating conditions.
CONCEPTS
This indicator assists traders in capitalizing on the assumption that trends are more likely to start during periods of high volatility compared to periods of low volatility. This is because high volatility indicates that there are bigger players currently in the market, which is necessary to begin a sustained trending move.
So, to determine whether the current volatility is "high", it is compared to an average volatility for however number of candles back the user specifies.
If the current volatility is greater than the average volatility, it is reasonable to assume we are in a high-volatility period. Thus, this is the ideal time to enter a trending trade due to the assumption that trends are more likely to start during these high-volatility periods.
HOW DO I READ THIS INDICATOR
When the column's color is red, don't take any trend trades since the current volatility is less than the average volatility experienced in the market.
When the column's color is green, take all valid with-trend trades since the current volatility is greater than the average volatility experienced in the market.
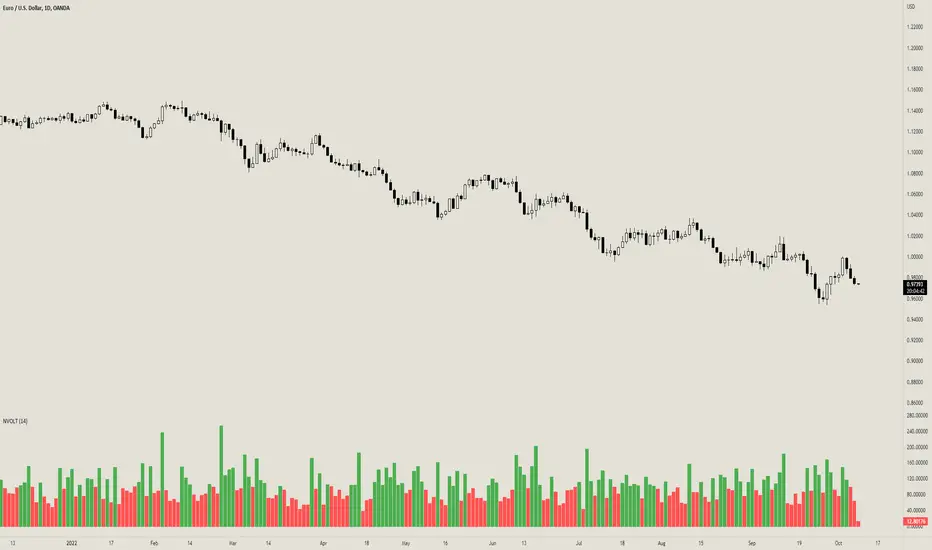
Normalized VolumeOVERVIEW
The Normalized Volume indicator is a technical indicator that gauges the amount of volume currently present in the market, relative to the average volume in the market. The purpose of this indicator is to filter out with-trend signals during ranging/non-trending/consolidating conditions.
CONCEPTS
This indicator assists traders in capitalizing on the assumption that trends are more likely to start during periods of high volume compared to periods of low volume. This is because high volume indicates that there are bigger players currently in the market, which is necessary to begin a sustained trending move.
So, to determine whether the current volume is "high", it is compared to an average volume for however number of candles back the user specifies.
If the current volume is greater than the average volume, it is reasonable to assume we are in a high-volume period. Thus, this is the ideal time to enter a trending trade due to the assumption that trends are more likely to start during these high-volume periods.
More information on this indicator can be found on NNFX's video on it in his Indicator Profile series and on Stonehill Forex's blog post on it .
HOW DO I READ THIS INDICATOR
When the column's color is red, don't take any trend trades since the current volume is less than the average volume experienced in the market.
When the column's color is green, take all valid with-trend trades since the current volume is greater than the average volume experienced in the market.
Linear Average PriceWhat is "Linear Average Price"?
"Linear Average Price" is both a trend and an overbought oversold indicator .
What it does?
it creates a trendline and trading zones.
How it does it?
To create the trend line, it averages the difference between each data and chooses it as the slope of the line it creates. then it positions this line so that it passes right through the middle of the data at hand. It uses standard deviation to create trading zones.
How to use it?
It can be used both to have an idea about the trend direction and to determine buy-sell zones. You can choose how many candles the indicator will calculate from the "lenght" section. The "range" part is the coefficient of the standard deviation and can be used to expand or collapse zones.

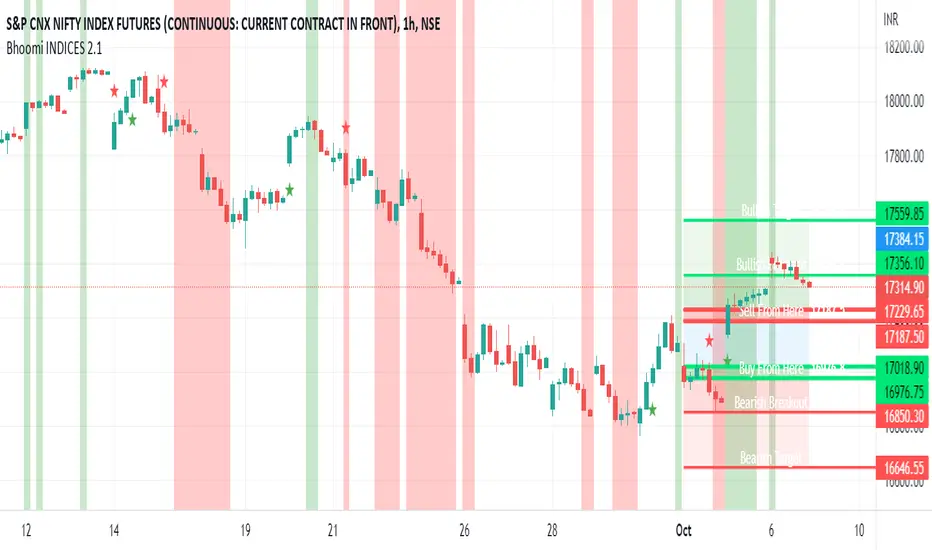
Bhoomi INDICES 2.1Bhoomi 2.0 is a Market Directional Indicator. It predicts the same by plotting respective zones and Labels.
To request access and to know more Information please contact us here.
Bhoomi 2.0 INDICES works on the Major World Indices as listed on tradingview. More to come in future, but please find the current list below. If you do not see the INDEX you trades, please comment below and we will add that for you.
"SPCFD:SPX"
"TVC:IXIC"
"DJCFD:DJI"
"TVC:NI225"
"CBOE:VIX"
"TSX:TSX"
"TVC:UKX"
"XETR:DAX"
"EURONEXT:PX1"
"EURONEXT:PX1GR"
"EURONEXT:PX1NR"
"TVC:FTMIB"
"TVC:NI225"
"TVC:KOSPI"
"TVC:SHCOMP "
"SZSE:399001"
"HSI:HSI"
"TVC:STI"
"ASX:XJO"
"NZX:NZ50G"
"TWSE:TAIEX"
"FTSEMYX:FBMKLCI"
"IDX:COMPOSITE"
"TVC:SX5E"
"BME:IBC"
"SIX:SMI"
"GPW:WIG20"
"EURONEXT:AEX"
"EURONEXT:BEL20"
"INDEX:BEL20"
"MOEX:IMOEX"
"OMXHEX:OMXH25"
"OMXICE:OMXI10"
"OMXSTO:OMXS30"
"OMXCOP:OMXC25"
"BELEX:BELEX15"
"OMXRSE:OMXRGI"
"OMXTSE:OMXTGI"
"OMXVSE:OMXVGI"
"BIST:XU100"
"TASE:TA35"
"TVC:SA40"
"NSE:NIFTY"
"BSE:SENSEX"
"DFM:DFMGI"
"TADAWUL:TASI"
"QSE:GNRI"
"BAHRAIN:BSEX"
"NSENG:NSE30"
"EGX:EGX30"
"BMFBOVESPA:IBOV"
"BMV:ME"
"BYMA:IMV"
"BVC:ICAP"
"BCS:SP_IPSA"
"BVL:SPBLPGPT"
"CURRENCYCOM:US500"
"CURRENCYCOM:US300"
"CURRENCYCOM:US100"
"CURRENCYCOM:US30"
"INDEX:DEU30"
"CBOE:VXD"
INDEX:DE40
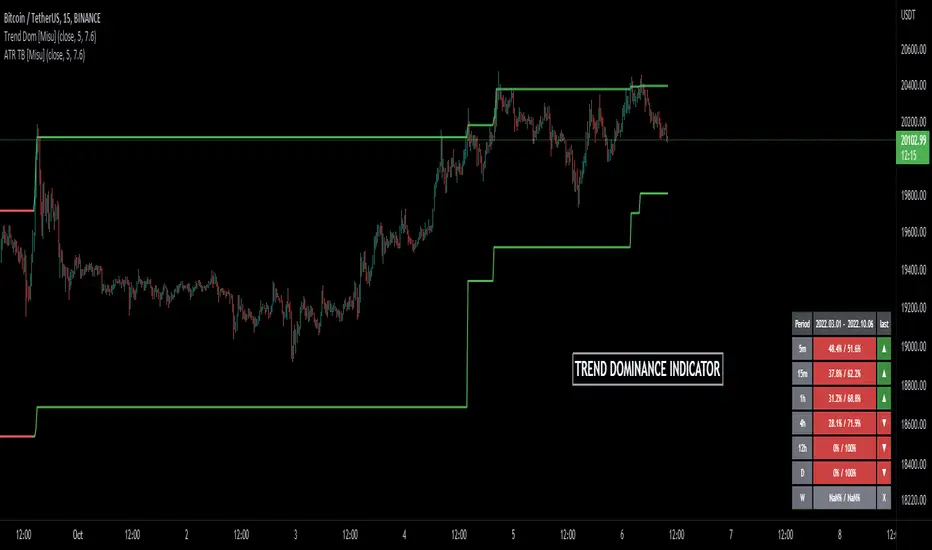
Trend Dominance Multi Timeframe [Misu]█ This indicator shows the repartition of bullish and bearish trends over a certain period in multiple timeframes. It's also showing the trending direction at the time.
█ Usages:
Trend dominance is expressed with two percentages: left is downtrend and right is uptrend. Cell colors turn green if dominance is up and red if it is down.
Knowing the trend dominance allows you to have a better overview of the market conditions.
You can use it to your advantage to favor long or short trades, reversal or breakout strategies, etc.
█ Features:
> Table colors
> Instant Trend Multitimeframe
> Trend Dominance Multitimeframe
█ Parameters:
> Length: Length is used to calculate ATR.
> Atr Multiplier: A factor used to balance the impact of the ATR on the Trend Bands calculation.
> UI Settings
Crypto-DX Crypto Directional Index [chhslai]Crypto-DX can be used to help measure the overall strength and direction of the crypto market trend.
Furthermore, it can be used as a screener to find out cryptocurrencies which are accumulating momentum and tends to potentially pump or dump.
How this indicator works :
If the Crypto-DX cross above the zero-level, it could be an indication that there is a trend reversal into upward. You should close your short position or place a long order right away.
If the Crypto-DX cross below the zero-level, it could be an indication that there is a trend reversal into downward. You should close your long position or place a short order right away.
If the Crypto-DX is consolidated around the zero-level, it could be an indication that the trend may be ended and followed by a sideway market. You are suggested not to place any order and wait for the market moves.
Divergence based trading strategy is fully applicable, just like the MACD.
Screener features :
Plot "Crypto Index" and "5 Custom Crypto"
Plot "Crypto Index" and "Top 30 Crypto"

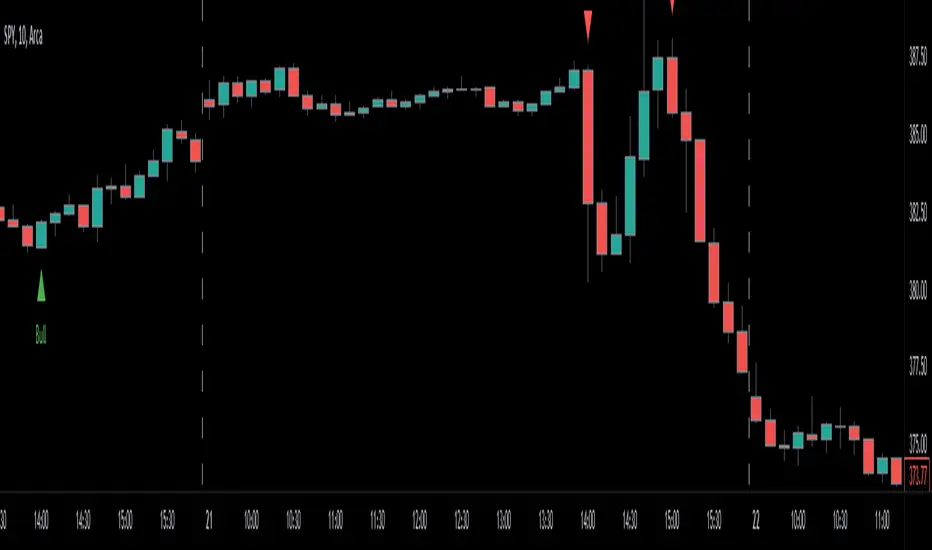
Engulfing Candles (Bullish and Bearish) + Trend | by Octopu$⛳ Engulfing Candles (Bullish and Bearish ) with Trend Recognition | by Octopu$
This Indicator identifies and plots Engulfing Candlestick Patterns.
Engulfing Candles are a combination of two bars on a price chart.
They are used to indicate/anticipate a market reversal.
The second candlestick must be bigger than the first, so it 'engulfs' the previous bar.
This indicator identifies both Price Movements:
Bullish stands for Upside
Bearish stands for Downside
These are NOT entry/exit signals to buy or sell securities*
(*The combination of your understanding and analysis as well as other Indicators and Factors as Confluence, you can improve your Charting Analysis.)
www.tradingview.com
SPY
ANY Ticker. ANY Timeframe.
( SPY 5m as an example only.)
Features:
• Engulfing Candles
• Bullish Setups
• Bearish Setups
• Symbol Signals
Options:
• Color Picker
• Symbol Selector
• Toggle On/Off
• Show name
• Trend Direction
Notes:
v1.0
Indicator release.
Changes and updates can come in the future for additional functionalities or per requests. Follow and Stay Tuned!
Did you like it? Please Support and Shoot me a message! I'd appreciate if you dropped by to say thanks! Thank you.
- Octopu$
🐙
Range Detector Indicator [Misu]█ This indicator shows an upper and lower band based on Highs and Lows.
Depending on this, the indicator interprets a ranging market, an uptrend or a downtrend.
█ Usages:
The purpose of this indicator is to identify when the price is ranging.
It's also used to identify changes in trends, breaking points, and trend reversals.
But it can also be used to show resistance or support levels.
█ Features:
> Price Action Change Alerts
> Price Action Change Labels
> Color Bars
> Show Bands
█ Parameters:
Deviation: A parameter used to calculate pivots.
Depth: A parameter used to calculate pivots.
Activate Range Detection: Check the box to activate range detection.
Band% Offset: A factor that is used to vary the bands offset.

MACD strategy + Trailstop indicatorWelcome traveler !
Here is my first indicator I made after 3 days of hardlearning pine code (beginner in coding).
I hope it will please you, if you have any suggestion to enhance this indicator, do not hesitate to give me your thoughts in the comments section or by Private message on trading View !
How does it works ?
It's a simple MACD strategy as describe here :
Uses of EMA 200 as a trend confirmer,
For sells :
When above Zero line (MACD) and under EMA200, we go on sell (background color is red)
For buys:
When under Zero line (MACD) and above EMA 200, we go on Buy (back ground color is green)
FILTERS !
I haded one filter to reduce noise on the indicator :
Signals aren't taken if one of the 14 last candles closed on the other side of the EMA 14.
What are the green and red lines ?
The green line is equivalent of a potential stop loss as a buyer side, same for the red one on seller side !
To make the space with the price bigger, please use "ATR multiplier" in the input options of the indicator while on your chart !
Is it timeframe specific ?
Hell no it is not timeframe specific ! You can try to use it on every timeframe !
As usual, I like to remind you that the best way to test an indicator is to go backtest it or to paper trade before using it on real market conditions !
If you find an idea of filter for a specific timeframe, do not hesitate to contact me ! I'll try to do my best to enhance this indicator as the time goes !
Is there repainting ?
There is no repainting on confirmation !
There's only a movement that I don't know how to ignore on the current open candle for the trail stop indicator I built, it should not be a problem if you place alerts to automatise your trading on the close of the candle, and not the high or low !
If you know how to resolve this problem with my code, I would be glad to get your tips to enhance the script ! :)
Example of the indicator in market (backtest, as said, no repaint on confirmation) :

SuperTrend Support & Resistance(My goal creating this indicator) : Provide a way to categorize and label key structures on multiple time frames so I can create a plan based on those observable facts.
The Underlying Concept / What is Momentum?
The Momentum shown is derived from a Mathematical Formula, SUPERTREND. When price closes above Supertrend Its bullish Momentum when its below Supertrend its Bearish Momentum. On the first bar bearish momentum is detected a resistance Level is made at the highest point of the previous bullish condition. On the first bar bullish momentum is detected a support Level is made at the lowest point of the previous bearish condition. As I become a better analyst I will find better techniques and this source code may become open-source, but as of now it remains protected. This indicator scans for bullish & bearish Momentum on the Timeframes selected by the user and when there is a shift in momentum on any of those time frames (price closes below or above SUPERTREND ) it notifies the trader with a Supply or Demand level with a unique color and Size to signify the severity of said level.
What is Severity?
Severity is How we differentiate the importance of different Highs and Lows. If Momentum is detected on a higher timeframe the Supply or Demand Level is updated. The Color and Size representing that higher timeframe will be shown. Demand and Supply Levels made by higher Timeframes are more SEVERE then a demand level made by a lower Timeframe.
Technical Inputs
- If you want to optimize the rate of signals to better fit your trading plan you would change the Factor input and ATR Length input. Increase factor and ATR Length to decrease the frequency of signals and decrease the Factor and ATR Length to increase the frequency of signals.
- to ensure the correct calculation of Support and Resistance levels change BAR_INDEX. BAR_INDEX creates a buffer at the start of the chart. For example: If you set BAR_INDEX to 300. The script will wait for 300 bars to elapse on the current chart before running. This allows the script more time to gather data. Which is needed in order for our dynamic lookback length to never return an error(Dynamic lookback length cant be negative or zero). The lower the timeframe the greater the amount of bars need. For Example if I open up a 30 sec chart I would enter 5000 as my BAR_INDEX since that will provide enough data to ensure the correct calculation of Support and Resistance levels.
Time Frame Inputs
- The indicator has 3 Time Frame Displays where you can choose how SEVERE You want the Supply and Demand Levels. For Example: 1min, 3min, 5min, 15 min Levels, 60 min levels Weekly Levels, etc.....The higher the Timeframe Selected the more SEVERE the Level.
- Use the Amount of time Frames input to increase or limit the amount of time frames that will be displayed onto the chart.
Display Inputs
- The toggle (Trend or Basic) option Lets the trend determine the colors of the Support and Resistance Levels or Basic where the color is strictly based on if its a high or a low ( Trend = HH,HL,LL,LH)
- Toggle options (Close) and (High & Low) creates Support and Resistance Levels using the Lowest close and Highest close or using the Lowest low and Highest high.
Toggle on both or toggle off both in order to use both these values when determining the trend of your chart. For Example this would mean (Price has to close higher then the highest high. Not only make a higher high or a
higher close) and the inverse (Price has to close lower then the lowest low. Not only make a lower low or a lower close)
How Trend Is being Determined ?
(Previous Supply Level > Current Supply Level ) if this statement is true then its s LH so the trend is bearish if this statement is false then its a HH so the trend is bullish
(Previous Demand Level > Current Demand Level ) if this statement is true then its a LL so the trend is bearish if this statement is false then its a HL so the trend is bullish
(Close > Current Supply Level ) if this statement is true technically price made a HH so the trend is bullish
(Close < Current Demand Level ) if this statement is true technically price made a LL so the trend is bearish
- Fully customize how you display and label Market Structure in specific timeframes. Line Length, Line Width, Line Style, Label Distance, Label Size, Label Background Size, and Background Color can all be customized.
- Lastly Is the Trend Chart. To Easily verify the current trend of any timeframes displayed by this indicator toggle on Chart On/Off . You also get the option to change the Chart Position and the size of the Trend Chart
*****The Current charts timeframe has to lower then a month to ensure correct calculation of Supply and Demand Levels*****
How it can be used ?
(Examples of Different ways you can use this indicator) : Easily categorize the severity of each and every Supply or Demand Level in the market (The higher the time frame the stronger the level)
: Quickly Determine the trend of any Timeframe
: Get a consistent view of a market and how different time frames are behaving but just use one chart.
: Take the discretion from hand drawing support and resistance lines out of your trading
: Find and categorize strong levels for potential breakouts
: Trend Analysis, Use multiple time frames to create a narrative based on observable facts from these time frames
: Different Targets to take money off the table
: Use labels to differentiate between different trend line setups
: Find Great places to move your stop loss too.

SuperTrend Momentum Chart(My goal creating this indicator) : Provide a quick way to check the current momentum of multiple timeframes. The Smart Momentum Chart was intended to be a live trading tool that should be used when a trader has already defined his edge and no longer needs the past Momentum data.
The Underlying Concept
What is Momentum ?
The Momentum shown is derived from a Mathematical Formula SUPERTREND , when price is above SUPERTREND its bullish Momentum and when its below SUPERTREND its Bearish Momentum. This indicator scans for candle closes on the timeframes you've selected and when there is a shift in momentum it notifies the trader with a color change and an alert if one was set up.
Technical inputs
- If you want to optimize the rate of signals to better fit your trading plan you would change the Factor input and ATR Length input. Increase factor and ATR Length to decrease the frequency of signals and decrease the Factor and ATR Length to increase the frequency of signals.
Quick TIP! : You can Sync all VFX SuperTrend Indicators together! All VFX SuperTrend indicators display unique information but its all derived from that same Momentum Formula. Keep the Factor input and ATR Length the same on other VFX SuperTrend indicators to have them operating on the same data.
Time Frame Inputs
- Your able to fill the chart with up to 8 timeframes
- If You don't need all 8 you can limit the amount to display by changing the "Time Frame Amount"
Display Inputs
- You can change the size of the chart and the color of the text
- You can toggle ON if you want to be signaled when a momentum switch occurs ( bullish to bearish or bearish to bullish )
- Your able to pick the Bullish and Bearish Colors of the Momentum switch
How it can be used ?
- Easily check the momentum of other Timeframes and use that information as a variable in your trading plan.
- quickly glance and know the momentum of any time frame before you enter any trade
- always know the momentum of the higher time frames
- Eliminate the need to switch from current chart
- Get an abundance of information in one location
- Have clear variables to structure your trades around

Simple and Profitable Scalping Strategy (ForexSignals TV)Strategy is based on the "SIMPLE and PROFITABLE Forex Scalping Strategy" taken from YouTube channel ForexSignals TV.
See video for a detailed explaination of the whole strategy.
I'm not entirely happy with the performance of this strategy yet however I do believe it has potential as the concept makes a lot of sense.
I'm open to any ideas people have on how it could be improved.
Strategy incorporates the following features:
Risk management:
Configurable X% loss per stop (default to 1%)
Configurable R:R ratio
Trade entry:
Based on stratgey conditions outlined below
Trade exit:
Based on stratgey conditions outlined below
Backtesting:
Configurable backtesting range by date
Trade drawings:
Each entry condition indicator can be turned on and off
TP/SL boxes drawn for all trades. Can be turned on and off
Trade exit information labels. Can be turned on and off
NOTE: Trade drawings will only be applicable when using overlay strategies
Debugging:
Includes section with useful debugging techniques
Strategy conditions
Trade entry:
LONG
C1: On higher timeframe trend EMAs, Fast EMA must be above Slow EMA
C2: On higher timeframe trend EMAs, price must be above Fast EMA
C3: On current timeframe entry EMAs, Fast EMA must be above Medium EMA and Medium EMA must be above Slow EMA
C4: On current timeframe entry EMAs, all 3 EMA lines must have fanned out in upward direction for previous X candles (configurable)
C5: On current timeframe entry EMAs, previous candle must have closed above and not touched any EMA lines
C6: On current timeframe entry EMAs, current candle must have pulled back to touch the EMA line(s)
C7: Price must break through the high of the last X candles (plus price buffer) to trigger entry (stop order entry)
SHORT
C1: On higher timeframe trend EMAs, Fast EMA must be below Slow EMA
C2: On higher timeframe trend EMAs, price must be below Fast EMA
C3: On current timeframe entry EMAs, Fast EMA must be below Medium EMA and Medium EMA must be below Slow EMA
C4: On current timeframe entry EMAs, all 3 EMA lines must have fanned out in downward direction for previous X candles (configurable)
C5: On current timeframe entry EMAs, previous candle must have closed above and not touched any EMA lines
C6: On current timeframe entry EMAs, current candle must have pulled back to touch the EMA line(s)
C7: Price must break through the low of the last X candles (plus price buffer) to trigger entry (stop order entry)
Trade entry:
Calculated position size based on risk tolerance
Entry price is a stop order set just above (buffer configurable) the recent swing high/low (long/short)
Trade exit:
Stop Loss is set just below (buffer configurable) trigger candle's low/high (long/short)
Take Profit calculated from Stop Loss using R:R ratio
Credits
"SIMPLE and PROFITABLE Forex Scalping Strategy" taken from YouTube channel ForexSignals TV

Accumulation Stage Identifier and Strategy around for TradingIn the psychology of trading at any market condition, there are four stage usually occurs on any tickers.
Stage 1 -> Neglect phase or consolidation phase
It occurs when the company does not produce the expected result and waiting for next result.
It can extend for days, weeks, months and years. Never give entry at this stage though that blue-chip told to be cheaper in price.
Stage 2 -> Accumulation
It occurs when the company's earning and sales consistently grows.
It can extend for days, weeks, months but should not expect the continues increase in price, as there will be potential pull-back which can be considered as opportunity to accumulate.
If the company fundamental is good, just give some space at the time of pullback.
Most of the time, the pullback volume will be low to compare to volume at the time of increase.
Usually, the stock that is going through accumulation stage will definitely trade above 200SMA and short term MA will be greater than long term moving average.
Continues the highest high and highest low along with volume.
Stage 3 -> Distribution
It occurs when the company's earning and sales stagnated due to certain reason.
It can extend for days, weeks while the price and volume highly volatile.
High volume while the price low
Typically, the stock that is going through distribution stage will certainly trade below 200SMA and short term MA will be lesser than long term moving average.
Continues the lowest high and lowest low along with volume.
Stage 4 -> Capitalization
Price reaches the 52W low while volume spikes on big down.
In each stage, the price & volume are perfect indicator to highlight the situation and the trader with proper discipline and patients can certainly reap the fruitful outcome of accumulation stage.
Based on this explanation, here is the strategy that is created with 50,90 & 200 Simple moving average and price volume trends (PVT) indicator applied on MACD to signal whenever the PVT convergence and divergence.
Note:
As the indicator designed to signal on the ticker that trade above 200 moving average, it is good to use this strategy on companies that are fundamental strong.
Whenever, there is pull back happens, the strategy might signal for exit, however, here comes the traders patient based on the conviction on the particular chosen stocks.
White being patient is good, disciplinary in following the strategy also important. Hence, consider the action when the stock goes opposite direction from your expectation.
Hope this strategy would help you find the profit.
Happy investing.

Koncorde PlusKONCORDE IS ONLY INTENDED TO BE APPLIED TO ASSETS WHERE VOLUME DATA IS PROVIDED.
This indicator is made up of 6 indicators: 4 trend (RSI, MFI, BB, Stochastic) and 2 volume. The 2's for volume are the PVI (positive volume index) and the NVI (negative volume index). These two indicators are the interesting ones as they are programmed to proportionally attribute the volume traded between the strong hands (sharks) and the weak hands (minnows).
As for what time period to use, the bigger the better, since after all what we are doing is data analysis and therefore the more data, the better.
When strong hands (blue histogram) are below zero, they are said to be selling while when they are above zero, they are said to be buying. The same goes for weak hands (green histogram).
Meaning of each zone:
Blue histogram: strong hand (sharks). If it is positive it indicates accumulation and if it is negative distribution.
Green histogram: weak hand (minnows). If it is positive it indicates buy and if it is negative it indicates sale.
Brown histogram: Indicates the trend and depends on previous values of weak hands and trend indicators (RSI, MFI, BB, Stochastic).
Red line: It is an average that smoothes the trend indicated by the brown histogram (default is the EMA).
Crossing Pattern
The pattern gives us a bullish entry signal when the trend (brown histogram) crosses above the average (red line) and is positioned bearish when the trend crosses below the average.
Zero Pattern
When the price trend (brown histogram) tends to zero, it means that there will be a change in its trend. This pattern is for trading in a bullish position.
Spring Pattern
When a cross between the average (red line) and the trend (brown histogram) has already occurred, and in addition the weak hands are above the price trend, that "spring on the mountain" is formed that gives us to understand that the upward trend will be more than evident.
Mirror Pattern
This pattern occurs when there is panic in the market and weak hands are selling (below zero). If at that moment the strong hands are buyers, the price tends to level off to begin the rise later.
This pattern is compatible with the Crossover Pattern, having more guarantees of success. If just after finishing the mirror pattern, the Crossover Pattern plus the Spring Pattern appears, then we have a good chance of winning.
Bear Hug Pattern
This pattern is for bearish positions only. It is the opposite figure to the mirror pattern. That is, we have strong hands clearly selling and weak hands clearly buying and above the price trend (brown histogram). It is the figure where you can see that the strong hands are distributing the assets to the weak hands.
Harpoon Pattern
If when the mirror pattern occurs, the red line crosses the blue histogram, a very strong bullish entry signal is produced.
Add an exit signal which occurs when we are in a spring pattern but the big hands start selling, mostly coinciding with the start of the bear hug pattern.
General rules for operating the Mirror Pattern:
a) Wait for the green histogram to start recovery, rise to positive values; if possible, until it crosses from bottom to top the brown line (brown histogram) and/or red average .
b) The blue histogram should be consistently positive. If it turns and goes towards negative values it can indicate a failed pattern at that same point.
c) Locate the low of the lower candle within the pattern and place the Stop Loss just below it for reference.
d) If we are not sure (we almost never will be) that there will be a turn or if it could finally be a bearish continuation we can use the SL to go short .
Additional:
A panel with performance statistics of the analyzed asset was added.
Added an indicator that shows the cumulative delta volume in the form of triangles at the top of the chart.
Added of user @DonovanWall
PS: Unofficial version, I was guided by the description of the BLAI5 author's website www.blai5.net
DISCLAIMER: For educational and entertainment purposes only. Nothing in this content should be interpreted as financial advice or a recommendation to buy or sell any sort of security or investment including all types of cryptos. DYOR, TYOB.

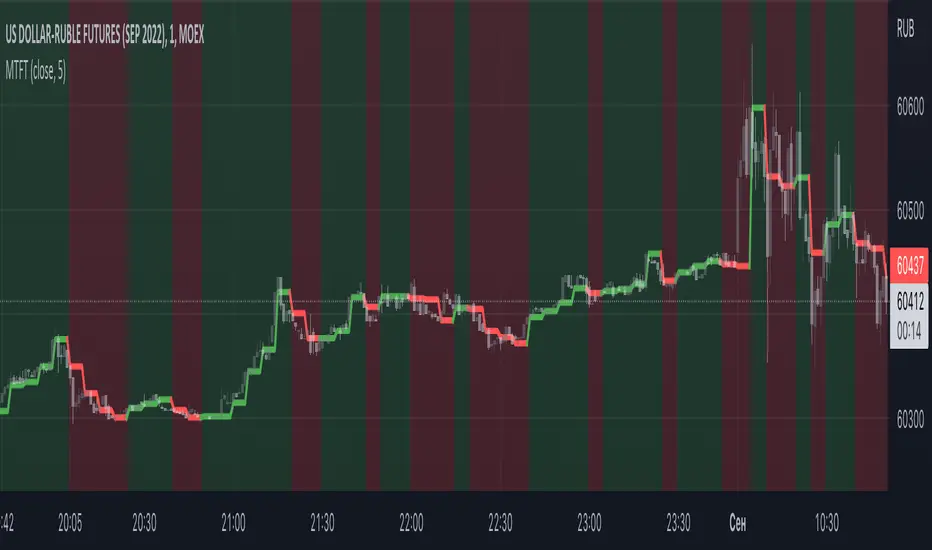
Multi TF Trend Indicator
...Mark Douglas in his book Trading in the Zone wrote
The longer the time frame, the more significant the trend, so a trending market on a daily bar chart is more significant than a trending market on a 30-minute bar chart. Therefore, the trend on the daily bar chart would take precedence over the trend on the 30-minute bar chart and would be considered the major trend. To determine the direction of the major trend, look at what is happening on a daily bar chart. If the trend is up on the daily, you are only going to look for a sell-off or retracement down to what your edge defines as support on the 30-minute chart. That's where you will become a buyer. On the other hand, if the trend is down on the daily, you are only going to look for a rally up to what your edge defines as a resistance level to be a seller on the 30-minute chart. Your objective is to determine, in a downtrending market, how far it can rally on an intraday basis and still not violate the symmetry of the longer trend. In an up-trending market, your objective is to determine how far it can sell off on an intraday basis without violating the symmetry of the longer trend. There's usually very little risk associated with these intraday support and resistance points, because you don't have to let the market go very far beyond them to tell you the trade isn't working.
The purpose of this indicator to show both the major and minor trend on the same chart with no need to switch between timeframes
Script includes
timeframe to determine the major trend
price curve, close price is default, but you can pick MA you want
type of coloring, either curve color or the background color
Implementation details
major trend is determined by the slope of the price curve
Further improvements
a variation of techniques for determining the major trend (crossing MA, pivot points etc.)
major trend change alerts
Thanks @loxx for pullData helper function
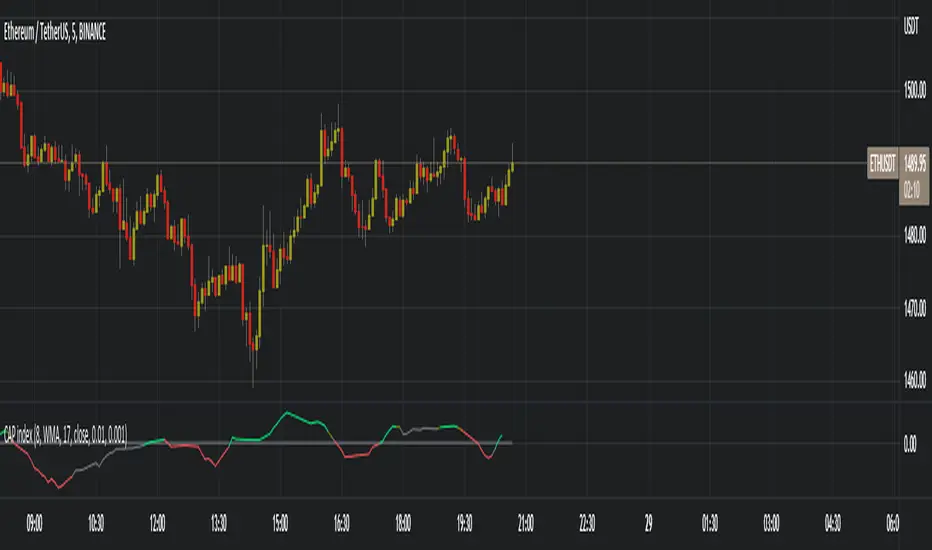
Constantly Applied Pressure Index (CAP index)BINANCE:ETHUSDT
The CAP index is my own homebrew trend indicator made to help traders see the slightly bigger picture, because we all know that as traders we can tend to hyper-focus in on a few candles and end up making a stupid trade because of it, or is it just me ? On a more serious note this indicator helps you find the short term trend by looking at bullish and bearish candles comparing their sizes, volumes and predominance.
The indicator has many technical settings for you to play around with but on the defaults it will render in a few colors which I will explain. Gray means no trend or that the current trend has died, bright green or red mean that a trend has formed, is playing out or that there is a good change a strong trend is about to form. Obviously green means bullish and red means bearish. Finally darker green and red mean a weak or weakening trend, this serves as a warning if you are about to take a trade in the trend direction.
The way I recommend using the indicator is the same way many trend indicators are used, as a filter to either a different indicator creating trading signals or to your own strategy's signals. I would add an illustration here that I prepared but I cannot because of tradingview's reputation rules
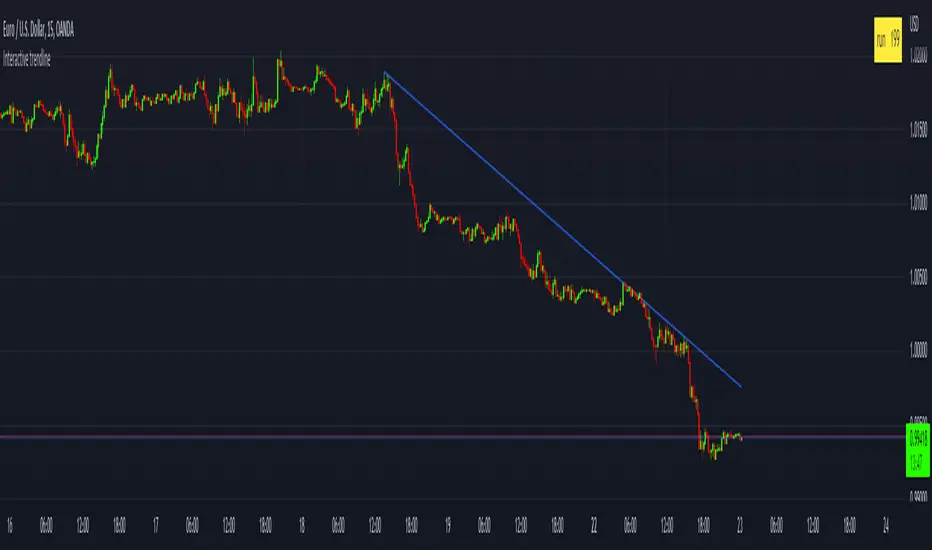
Interactive trendlineThis is a concept that I have been playing with
to make a manual trend line that has more then just two connecting dots
but that has sequential data connected on every bar between the
beginning an the end point that can then be used to determine a break of trend or
a bounce.
This is added in a few simple steps
1) add the indicator to your chart
2) set the x_1 time bar
3) set the y_1 price
4) set the x_2 time bar
5) set the y_2 price
6) check the table that calculated the run value and enter that value in the settings box in the "Run" input box
VXMA BotThis strategy is separated version of Cloud MA form VXD Cloud Edition, Let called it "VXMA".
what's changed?
renew TP/SL Work
Simplify code and clean look.
Risk:Reward Calculation
Risk of Ruin Setting can now selected between Fixed $ or %
if Buy your Stoploss will be Swing low
if Sell your Stoploss will be Swing high and can be setting at Pivot Setting
then Auto Position Sizing and TP line will be calculated form there and will show in Orange color line (Draw Position Box is available)
Alert Setting
{{strategy.order.alert_message}}
Python-Bot
github.com
There are 2 mode : one-way mode and hedge mode is different script on my Github profile.
read README. MD and there's video tutorial.
Pls study app.py and it's script before deploy for your own safty and your own risk, I'm NOT responsible for your loss.
GOODLUCK
