TKP T3 Trend With Psar BarcolorThis script is adapted from TKP's long/short indicator to initiate buy/sell indications when price crosses the T3 moving averages, and when the T3's themselves cross. Bars change colors based on price over/under T3 and T3 up or down or This allows for simple visual analysis of trend direction along with entries, exits, and stop loss values.
مؤشر القوى الحقيقية

Market Index Strength by Keiron RichieBy combining the true strength of the Nasdaq (NDX) and S&P500 (SPY) we can then compare that against the volatility /fear index (VIX). The true strength of the Volatility Index (VIX) is shown by the red area and the Nasdaq (NDX) and S&P500 (SPY) by the silver/teal areas.
The yellow EMA line shows the average difference between the VIX and the NDX/SPY indexes. When the yellow line crosses above the zero line and is climbing it means that the NDX/SPY are strengthening. When the yellow line is decreasing or crosses under the zero line it means the fear (VIX) is becoming stronger and NDX/SPY are weakening.
When looking at charts of companies/components listed on the Nasdaq and/or S&P 500 you will notice a frequent correlation between the movement of the yellow line depicting index health and the strength of the chart you are viewing. It’s a very quick and effective method of seeing the strength and fear within the market indexes and how they are effecting your chart.
The background color changes based on the market strength combined with the active symbol true strength. Green is a buy zone, Red is a sell zone.
It is tested and works well on all timeframes with Stocks listed on NASDAQ & S&P500. It does not include buy/sell alerts.

TSI CCI Hull with profit$$$$ , Alert versionThis is a modified version of @SeaSide420 TSI CCI Hull with profits exit on long and short order with alert as well
original script :
the strategy script:
/// feel free to edit/improve and comment

Forex Trend Buy Sell Signal by LukasHello,
This is Forex Buy and Sell indicator, Signal line cross up blue line = Buy, cross down = Sell
Above Yellow line = Uptrend, Looking for Buy only, vice versa.
Only works on Major Pairs.
Calculate price strength and momentum.
Hope you guys like it.
Cheers
Currency Strength Indicator by LukasA better way to trade major pairs.
Similar to RSI CSI, with less noise and real price action movement.
Some explanation. Set thickness of "Color 0" from each currency to know the strength.
Use on 30m timeframe and above to see the power of each currency.
Suggestion : Set timeframe 30m for 1h play (your timeframe : 2), so you can get early signal.
Always looking for upward movement from currency above 20 or 0
Vs. currency bellow 0 or -20.
--
Stay Profit.
Any feedback are welcome.

Linear True Strength Index[FinansPi]EN:The True Strength Index, reinforced using Linear Regression Curve. The True Strength Index (TSI) is a momentum oscillator that ranges between limits of -100 and +100 and has a base value of 0. Momentum is positive when the oscillator is positive (pointing to a bullish market bias) and vice versa. It was developed William Blau and consists of 2 lines: the index line and an exponential moving average of the TSI, called the signal line. Traders may look for any of the following 5 types of conditions: overbought, oversold, centerline crossover, divergence and signal line crossover. The indicator is often used in combination with other signals.
TR:Linear Regresyon Eğrisi kullanılarak güçlendirilmiş Gerçek Güç Endeksi. Gerçek Güç Endeksi (TSI), -100 ve +100 sınırları arasında değişen ve 0 taban değerine sahip bir momentum osilatörüdür. Osilatör pozitif olduğunda momentum pozitiftir (ayı piyasası önyargılarına işaret etmektedir) ve tersi. de geçerlidir. William Blau tarafından geliştirilmiştir ve 2 çizgiden oluşur: endeks çizgisi ve sinyal çizgisi olarak anılan TSI'nin üstel hareketli ortalaması. Analistler aşırı alım, aşırı satım, merkez çizgisi kesişmesi, ayrışma ve sinyal çizgisi kesişmesi gibi 5 durumdan birini ararlar. Gösterge genellikle diğer sinyallerle birlikte kullanılır.

TKP-True Relative MovementThis script uses a combination of modified TSI and RSI conditions produce Buy/Sell/Hold signals. Similar to Elder's Impulse, when a buy signal is met, bars turn blue. When a sell signal is met, bars turn Pink. When signals are mixed, bars turn grey. Depending on direction of trend, gray bars can be considered "Hold" or take profit signals. You can change the parameters of TSI or RSI to preference. Also embedded in the script is the ability to add exponential moving average filter for additional conditions if you have some know how with coding.

GMS: TSI Indicator (ROC)This is based on the original TSI Indicator that's already built in.
The PC is originally taken as the change between the current price - the previous price. I substituted that with Rate of Change. Using a 1 period ROC it's quite similar to the TSI Indicator and increasing the length results in a smoother TSI.
I hope it helps,
Andre
Mirror TSI-MACD by Trader JayI was playing around with the TSI-MACD and surprisingly it works quite well as a mirror.
There are 2 ways this can be used
1. Enter long when Blue line crosses up the Red
2. Exit long when Green line crosses the blue
or
1. Enter long when Blue line crosses up the Red
2. Exit long when Blue line crosses back down below the Red

TSI CCI HullThis is TSI and CCI combined. The CCI is customized and is using HullMA, but the TSI is default TSI
For use with the HMAv420 indicator, to form trading strategy based on the 3 indicators.
Best as all 3 indicators used on 3 timeframes at once, ie 1m 5m 1H

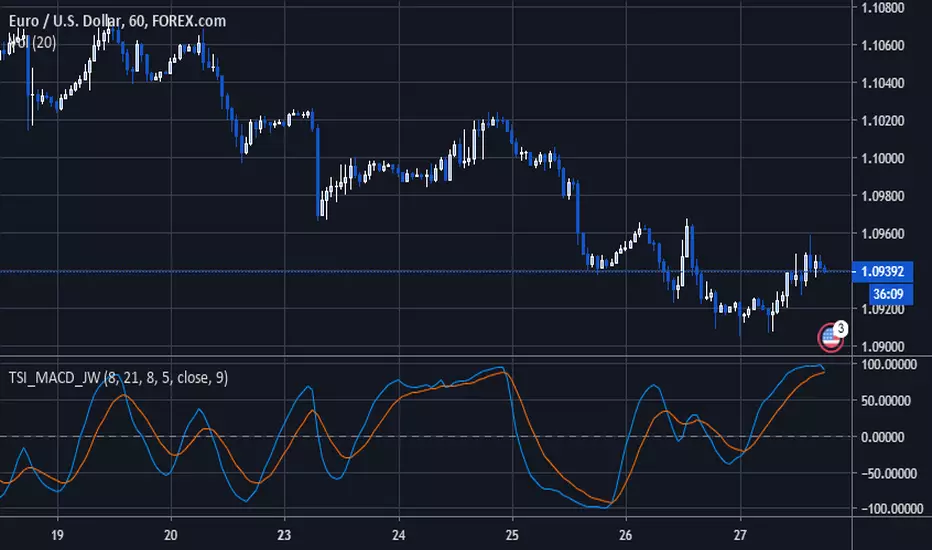
TSI MACD by Jwammo12The TSI MACD indicator is a combination of the TSI (True Strength Index) and MACD (Moving Average Convergence Divergence) technical indicators.
The TSI MACD indicator is a momentum indicator, considering that it comes from two momentum indicators.
Ultimately, the TSI MACD indicator is used to gauge the strength of a trend, as well as its accompanying momentum.
The indicator is shown to oscillate between -110 and +110, while its signal baseline is on the zero level (a level that determines the market bias).
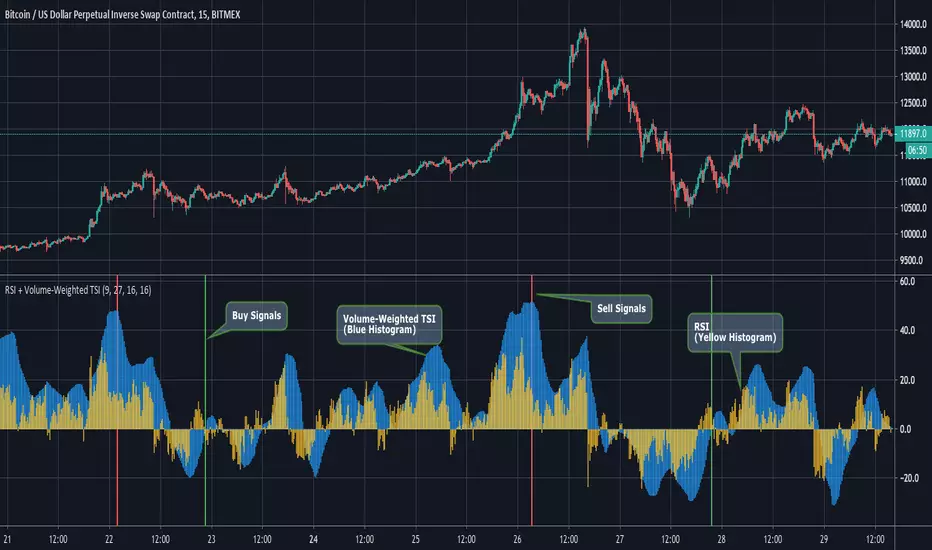
RSI + Volume-Weighted TSIThis indicator combines a standard RSI with a modified TSI.
Although a double smoothing process is already used in calculating the normal TSI, we decided to apply a volume weighted moving average of length (length_of_slow_TSI_EMA // 2) to it. This resulted in a smoother TSI that picked up on large-scale swings very nicely.
Entry Signals are generated when the Volume-Weighted TSI crosses above zero from negative into positive territory. Exit signals are generated when the TSI is above 40 and then begins its downward fall, along with a declining RSI value.
The Graph:
The Volume-Weighted TSI is plotted as the blue histogram, wile the RSI is plotted as the yellow histogram. We definitely wanted to go the simplicity route on this one's graphics, since the RSI and TSI are both classic and reliable indicators.
The green background highlights indicate an entry signal and red highlights signify an exit signal.
Input Options:
-length of Slow EMA for TSI
-length of Fast EMA for TSI
-Length of Volume Weighted MA of TSI.
-Length of RSI.
~Happy Trading~
RSI MomentumThis script represents Momentum's move in the RSI , So we expect to start moving faster than RSI and in this oscillator
When the line of histogram is under the neutral zone and it's color changes from red to maroon, The BUY Signal has been issued /
When the line of histogram is above the neutral zone and it's color changes from lime to green, The SELL Signal has been issued /
This script was written by Hamid Abdi (Teaching by Dr .A.Khodakarami)

Super True Strength IndicatorHere is the Super TSI. An indicator to use for bias (bull/bear) in addition for entry and possible exit signals.
The Super True Strength Index is only available to members in my private training.
The Super TSI takes 4 measures the strength in 4 different timeframes. It's designed to be used on either a Weekly, Daily, 4HR, or 1HR chart.
If you are in my training please watch training videos on how to use this indicator.

Minimal Godmode 1.0// Acknowledgements:
// Original Godmode Authors:
// @Legion, @LazyBear, @Ni6HTH4wK, @xSilas
// Drop a line if you use or modify this code.
// Godmode 3.1.4: @SNOW_CITY
// Godmode 3.2: @sco77m4r7in and @oh92
// Godmode3.2+LSMA: @scilentor
// Godmode 4.0.0-4.0.1: @chrysopoetics
// Jurik Moving Average: @everget
// Minimal Godmode v1.0:
// Removed BITSTAMP:BTCUSD, added presets for 9-26-13 and 17-6-4, added more exchanges + USDT and USDC pairs to multi-exchange option
// JMA smoothing - more responsive + less lag than SMA at equivalent length settings
// Minor cosmetic changes to account for pinescript 3 transparency and z-order

HMA_ATR_TSIA combination of signals trigger this strategy.
HMA crossovers (short period & long period) -Hull moving average-
ATR (smoothed with HMA ) -Average true range-
TSI -True strength index-
The final close price is not known until right at the end of the bar.
This means that the indicator is constantly “repainting” during the bar.
You will see that indicators are constantly moving with each tick received
Use Open instead, the value is set and does not change even after refreshing the page.
An attempt to reduce repainting.
INDICATOR VERSION FOR USE WITH ALERTS

Bottomed Out v1Bottomed Out - Heads Up
Indicators used internally
Bollinger Bands
Chaikin Money Flow
Money Flow Index
Stoch
Stoch RSI
True Strength Index
Chop Index
Fisher Transform
The main idea behind this indicator is let you know when market is bottoming out, it works on all time frames, higher time frames are recommended.
You can change the bottom value in the properties section this will give you a wider or tighter signal depending on the values.
*Notes:
If price goes lower after a signal, this is possible a bullish divergence, since indicators are going out of the bottomed zone but price is making a new lower low.

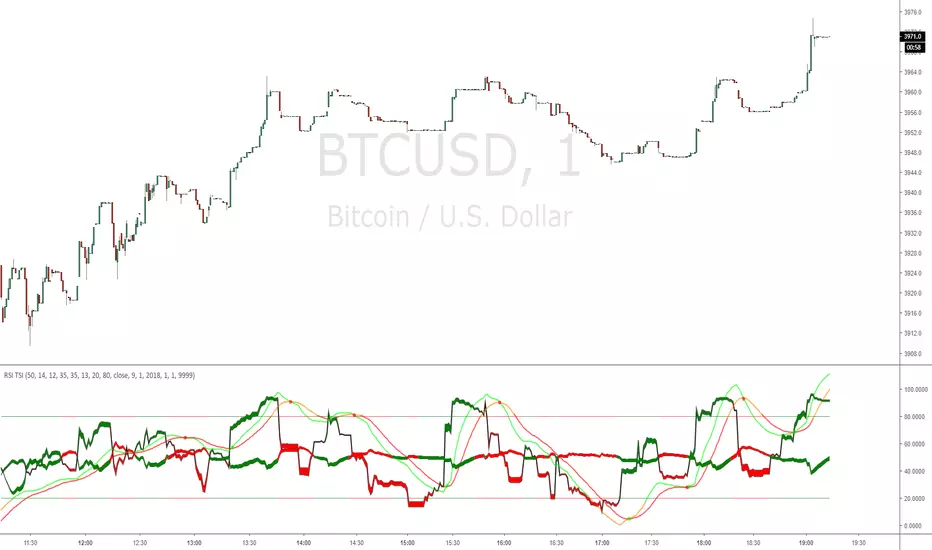
RSI TSIRSI & TSI combination, with Hull MA for a center Line.
Order entry with either RSI TSI or Hull MA
Experimental strategy for possible use as bot
Plots named for use with alerts
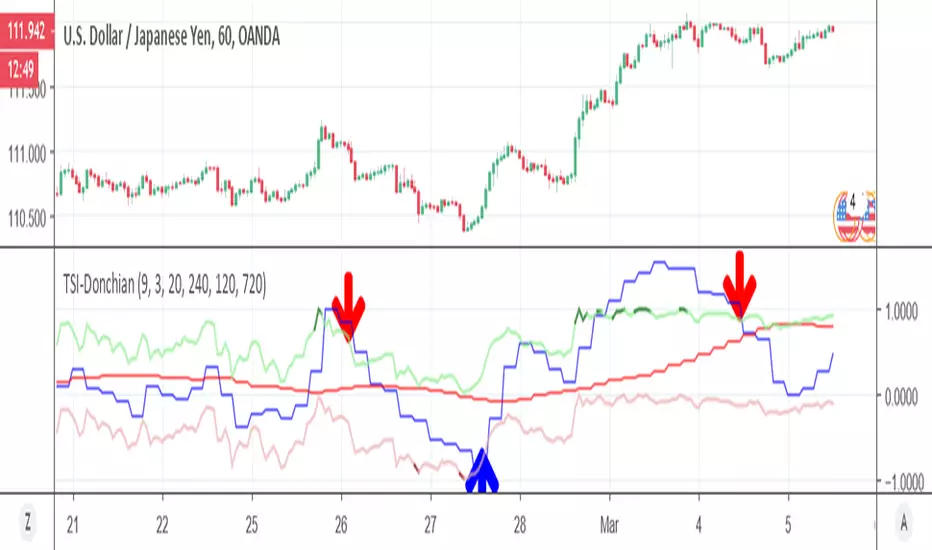
TSI-DonchianHere it a TSI with MTF function , together with Donchian high and low channel
the best entry and exit are shown in arrow