V-Max: Tactical Opening Range & Session Monitor🛡️ 【V-Max】Tactical Opening Range & Session Monitor
Overview The V-Max Tactical Session Monitor is a high-precision utility designed to capture and project the critical opening range of any market session (e.g., US Market Open). By defining the high, low, and equilibrium (mid) points of the initial volatility, traders can establish a tactical framework for the remainder of the trading day.
Technical Methodology & Logic This script employs a robust cross-day physical coordinate engine:
Opening Range Capture: Dynamically calculates the high, low, and midpoint (50% level) during a user-defined interval (e.g., the first 15 minutes of the US open).
Physical Coordinate Locking: Utilizes the box.new and line.new objects to render a visual "Tactical Box." The right boundary of the box is extended in real-time until the specified session_stop time, ensuring the range remains relevant throughout the session.
Precision Engine: Features a dedicated precision handler that automatically adjusts the price label formatting based on syminfo.mintick (detecting whether an asset requires 2 or 5 decimal places) to ensure visual clarity across all asset classes.
Day-of-Week Validation: Includes logic to exclude weekends, focusing strictly on active market weekdays for data integrity.
How to Use
Time Settings: Input the start and end of the opening range you wish to capture (Defaulted to GMT+8 for US Open).
Session Stop: Define the time when the projection should cease extending.
Execution: Use the High/Low levels as breakout boundaries and the Mid-line as a pivot for trend strength.
產品概述 V-Max 時效監控 Pro 是一款高精度的開盤區間捕捉工具。透過定義開盤初期(如美股開盤前 15 分鐘)的高點、低點與中軸平衡點,為交易者建立全天的戰術框架。
技術邏輯與功能 本腳本採用穩定的物理座標引擎:
開盤區間捕捉:在自定義的時間區間內,自動鎖定最高價、最低價與 50% 中軸價位。
物理座標鎖定:利用 box.new(區間盒)與 line.new(趨勢線)物件進行視覺化呈現。區間將實時延伸至設定的停止時間,確保戰術參考線在整個交易時段內有效。
精度處理引擎:自動根據標的物(如美股或加密貨幣)的最小跳動單位調整標籤顯示,確保價格資訊的清晰度。
跨日物理判定:內建工作日過濾邏輯,確保僅在市場交易日內啟動捕捉。
This is a free tactical utility from the V-Max strategic suite.
Premium Indicators: For L1-L3 professional trend navigation and momentum systems, please contact our authorized assistant: @VMax_Helper_bot.
Disclaimer: For technical analysis purposes only. Past performance does not guarantee future results.
Usmarkets

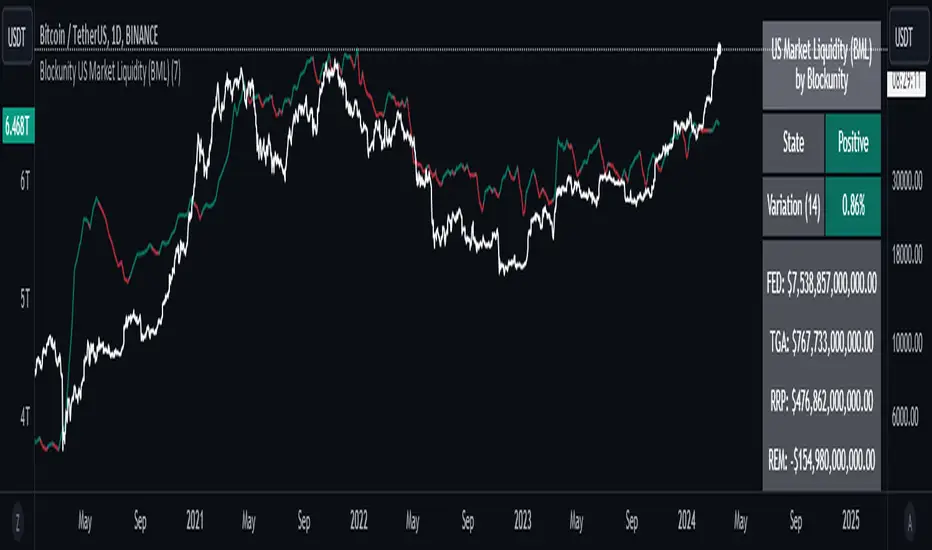
Blockunity US Market Liquidity (BML)Get a clear view of US market liquidity and monitor its status at a glance to anticipate movements on risky assets.
The Idea
The BML aggregates and analyzes total USD market liquidity in trillions of dollars. It is used to monitor the liquidity of the USD market. When liquidity is good, all is well. If liquidity is low, the US will maneuver and sell treasury bills (debt) to replenish its treasury, which can lead to bearish pressure on markets, particularly those considered risky, such as Bitcoin.
How to Use
The indicator is very easy to use, there's nothing special about it. This tool is mainly intended to be used as fundamental information, and not for active trading.
Elements
The US Market Liquidity has several distinct components:
FED Balance Sheet
The Fed credits member banks’ Fed accounts with money, and in return, banks sell the Fed US Treasuries and/or US Mortgage-Backed Securities. This is how the Fed “prints” money to juice the financial system.
US Treasury General Account
The US Treasury General Account (TGA) balances with the NY Fed. When it decreases, it means the US Treasury is injecting money into the economy directly and creating activity. When it increases, it means the US Treasury is saving money and not stimulating economic activity. The TGA also increases when the Treasury sells bonds. This action removes liquidity from the market as buyers must pay for their bonds with dollars.
Overnight Reverse Repurchase Agreements
A reverse repurchase agreement (known as Reverse Repo or RRP) is a transaction in which the New York Fed under the authorization and direction of the Federal Open Market Committee sells a security to an eligible counterparty with an agreement to repurchase that same security at a specified price at a specific time in the future.
Earnings Remittances Due to the Treasury
The Federal Reserve Banks remit residual net earnings to the US Treasury after providing for the costs of operations, payment of dividends, and the amount necessary to maintain each Federal Reserve Bank’s allotted surplus cap. Positive amounts represent the estimated weekly remittances due to the US Treasury. Negative amounts represent the cumulative deferred asset position, which is incurred during a period when earnings are not sufficient to provide for the cost of operations, payment of dividends, and maintaining surplus.
Settings
Several parameters can be defined in the indicator configuration. You can:
Choose the smoothing and timeframe to be used in the plot.
Set the EMA lookback period and display it or not. This affects the color of the main plot.
Set the period to be taken into account when calculating the variation rate in the table.
Select the data to be taken into account in the calculation.
Activate or not the barcolor.
Lastly, you can modify all table parameters.