Daily Dynamic Grid StrategyHi everyone,
This strategy is built around a dynamic daily grid concept, using an upper and lower daily range that is automatically divided into multiple grid levels.
The idea is to take advantage of daily volatility by executing DCA entries on specific grid levels, based on predefined conditions.
Key points of the strategy & feature:
I recommend using 1H or 2H timeframe for this strategy
Take profit by grid
When DCA is active (>1 entry), the exit condition switches to close above the average price
A hard stop loss is applied
Includes an optional Trailing TP / SL to help maximize profit during strong moves
Like most DCA-based strategies, it tends to have a high win rate, but during strong market dumps, losses can become relatively large
Can also be used for backtest on Forex markets such as Gold, where using the trailing option is generally more effective
And still trial for the webhook, may continue to improve and update this strategy in future versions.
Volatality

Clean CPR for Intraday, Swing trading✅ Clean CPR for Intraday & Swing Trading (NSE-Optimized)
Simple, Accurate, No-Clutter CPR levels for NIFTY, BANKNIFTY, FINNIFTY & Stocks
Perfect for Indian intraday & swing traders who want clean charts, reliable zones, and fast decision-making without overcomplicated indicators.
✅ 📌 Short Summary
This indicator plots Previous Day High/Low, CPR, Support & Resistance, and high-probability shaded zones (PH↔R1 & PL↔S1). It’s built specifically to help Indian traders identify reversal zones, breakout levels, and trend direction quickly — without chart noise or unnecessary lines.
✅ 🔍 What This CPR Indicator Does
A clean, beginner-friendly version of CPR built for practical trading in NSE markets.
1️⃣ Previous Day High & Low (PH / PL)
Plots yesterday’s high & low with price labels
These act as powerful reference levels used heavily in Indian intraday setups
Helps spot opening range breakouts, rejections, and pullback entries
2️⃣ Central Pivot Range (CPR)
CPR gives the market structure for the day
Price above CPR → Bullish bias
Price below CPR → Bearish bias
Narrow CPR → Possible trending day
Wide CPR → Likely sideways market
This is especially useful in NIFTY, BANKNIFTY, which reacts strongly to CPR width.
3️⃣ Support & Resistance Levels (R1 / S1)
Plots the first major resistance and support levels
You can plot R1 to R5, S1 to S5
Each Line can be same or different color as per your choice
4️⃣ Smart Shaded Zones (High-Probability Areas)
These shaded blocks highlight the most important reversal zones:
✅ Resistance Zone → Area between PH and R1
✅ Support Zone → Area between PL and S1
These zones often act as:
Bounce areas
Reversal regions
Ideal trade entry/exit points
Especially powerful when combined with opening range & volume spikes.
5️⃣ Current Day Open Line
Shows the opening price of today, a key reference for:
Trend confirmation
Intraday bias
Opening drive setups
6️⃣ Clean Design — No Clutter
Old historic zones are automatically removed
Only the useful previous session zones remain
All prices shown as whole numbers (no decimals)
Clear labels, clean zones, easy to read even on mobile
✅ Why This Is Perfect for Indian Traders
This indicator is optimized for:
NIFTY Futures / Options
BANKNIFTY Futures / Options
FINNIFTY
NSE Stocks
Index scalping & options trading
Indian intraday traders rely heavily on:
Previous Day High/Low
CPR width
R1/S1 reactions
Day Open behavior
PH↔R1 reversal zones
PL↔S1 support zones
This tool highlights all of them automatically, without crowding your chart.
✅ Who Should Use This
✔ New traders
✔ Intraday scalpers
✔ Swing traders
✔ Option buyers/sellers
✔ Anyone who wants a clean CPR layout without confusing extras
✅ Benefits
Clear bullish/bearish bias
High-precision reversal zones
Better entries/exits
Faster chart reading
No overthinking — the zones show themselves

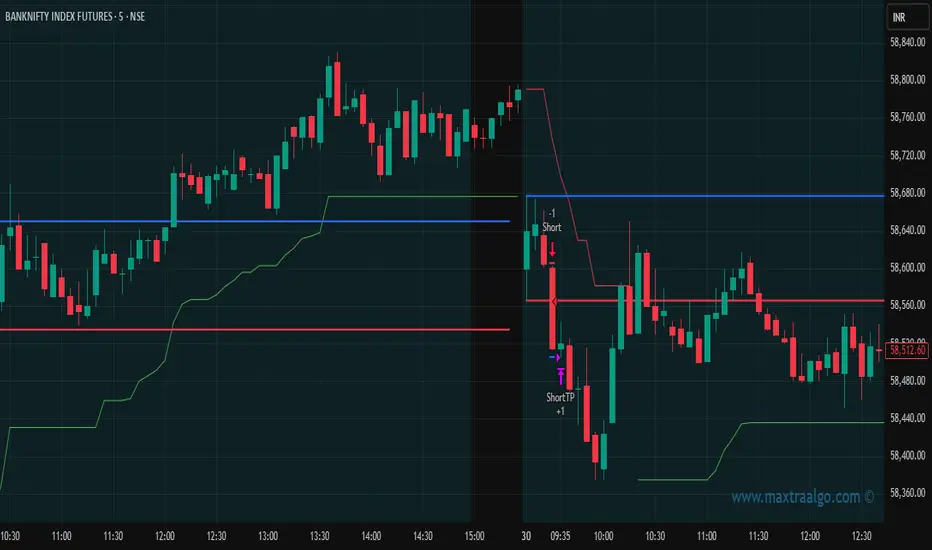
Maxtra Range Breakout StrategyRange Breakout Strategy
This strategy identifies periods of price consolidation (range) and enters trades when the price breaks above or below the defined range. A breakout above the range signals a potential uptrend (buy), while a breakout below indicates a potential downtrend (sell). It helps capture strong directional moves following low-volatility phases.
Cycle-Synced Channel Breakout📌 Cycle-Synced Channel Breakout – Detect Breakouts Confirmed by Candles and Momentum Cycles
📖 Overview
The Cycle-Synced Channel Breakout indicator is a precision breakout detection tool that combines the power of:
• Adaptive Keltner Channels
• Dominant Cycle Period Analysis (Ehlers-inspired)
• Candlestick Pattern Recognition (Engulfing)
This multi-layered approach helps identify true breakout opportunities by filtering out noise and false signals, making it ideal for swing traders and intraday traders seeking high-probability directional moves.
⚙️ How It Works
1. Keltner Channel Envelope
A dynamic volatility channel based on the EMA and ATR defines the upper and lower bounds of price movement.
2. Engulfing Candle Detection
The script detects strong bullish and bearish engulfing patterns, which often signal trend reversals or momentum continuations.
3. Dominant Cycle Momentum (Ehlers-inspired)
Using a smoothed power oscillator derived from a detrended price series, the indicator assesses whether momentum is accelerating during the breakout — filtering out weak moves.
4. Signal Confirmation Logic
A signal is only shown when:
• An engulfing pattern is detected, and
• Price breaks out of the Keltner Channel, and
• Momentum (cycle power) is rising
5. Visual Feedback
• Breakout signals are plotted with “BUY” or “SELL” labels
• Faded green/red background highlights confirmed breakouts
• Optional display of engulfing candles with triangle markers
⸻
🛠️ Key Features
• ✅ Adaptive Keltner Channels
• ✅ Bullish/Bearish Engulfing Candle Recognition
• ✅ Ehlers-style Cycle Momentum Confirmation
• ✅ Background highlights for confirmed breakouts
• ✅ Optional candle pattern visualization
• ✅ Lightweight and Pine v6 compatible
⸻
🧪 Inputs
• Keltner Length – EMA period for channel basis
• Multiplier – Multiplied with ATR to determine band width
• Cycle Lookback – Used to calculate smoothed cycle power
• Show Engulfing Candles? – Toggles candlestick signals
• Show Breakout Signals? – Toggles breakout labels and backgrounds
⸻
🧠 How to Use
• Look for “BUY” or “SELL” labels when:
• An engulfing candle breaks through the Keltner Channel
• Cycle momentum confirms strength behind the move
• The background color will faintly highlight the breakout direction.
• Use in combination with other trend or volume indicators for added confluence.
🔒 Notes
• This indicator is not repainting.
• It is designed for educational and research purposes only.
• Works across all timeframes and asset classes (stocks, crypto, forex, etc.)

US Market Strength IndexIntro:
It is quite a task to track multiple Indices and market internals to decide which way markets are going, especially when you are in a Trade. You may also get conflicting signals making it harder to confidently decide on your trade bias.
US Market Strength Index a.k.a. US MSI indicator aims to simplify decision-making by coloring the lower panel Green when a majority of market participants are bullish and Red when they are bearish. The code analyses the direction and strength of various US indices & market internal futures contracts to decide the color. The shade of color also changes from Dark to Bright when the momentum is relatively strong. A weighted score is assigned to individual contracts and the color (& shade) are selected based on average score in real-time, for changes in direction and momentum.
A Futures contract provides a proxy and generates price & volume data to analyze the direction and strength. Also, they are traded by sophisticated market participants for about 23 hours a day!
Trading with the general market sentiment in your favor can potentially improve a trade's edge. For example, if various market indices (DOW JONES, S&P 500, NASDAQ, etc.) are positive; bullish, or LONG trades might work out in individual stocks. This may occur due to the following reasons:
Seeing prices rise, Sellers may choose to Sell at Higher prices
Buyers might be attracted to buy into stocks, as the prices are trending higher
SHORT sellers might get cautious of rising prices and may not Open SHORT positions until the current bullish sentiment dies off
Existing SHORT sellers may close their positions due to margin squeeze, possibily fueling more buying
The same logic applies when the market indices are in the negative territory, SHORT trades may have a higher probability of working out.
Features:
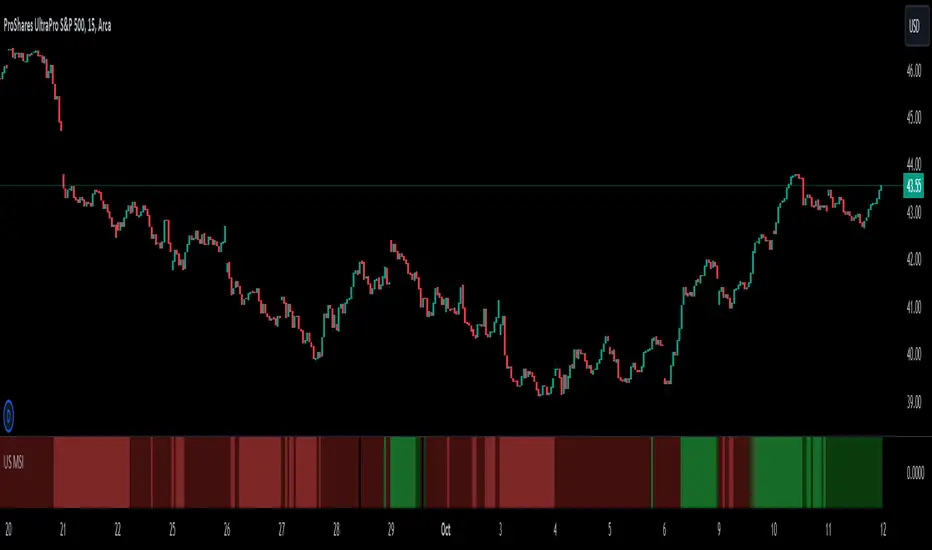
The bright Green color in the lower panel indicates a strong bullish market strength
The dark Green color in the lower panel indicates bullish market strength, but a relatively weaker
The bright Red color in the lower panel indicates a strong bearish market strength
The dark Red color in the lower panel indicates bearish market strength, but a relatively weaker
Basic Set-Up:
Add the Indicator to the chart
You can change the default colors for Market Bearish, Market Bullish, Market Bearish weak, and Market Bullish weak
Important Notes:
You should analyze the stock’s technical data and use prudent risk management for every trade. Trade entries and exits should always be based on the symbol you are trading.
Use the US Market Strength Index as one of the factors to decide your trade bias and filter symbols that support your analysis.
Just because Indices and Market Internals point in a certain direction, it does not guaranteed that a stock could behave the same way.
Also, since this script uses futures contracts, you would need real-time futures data subscription for real-time analysis. At the minimum, you need CME/ CBOE exchange data.
This tool is suited for US Regular Trading Session, but since the US MSI is using futures contracts, the tool tracks pre- and post-market sentiment as well.
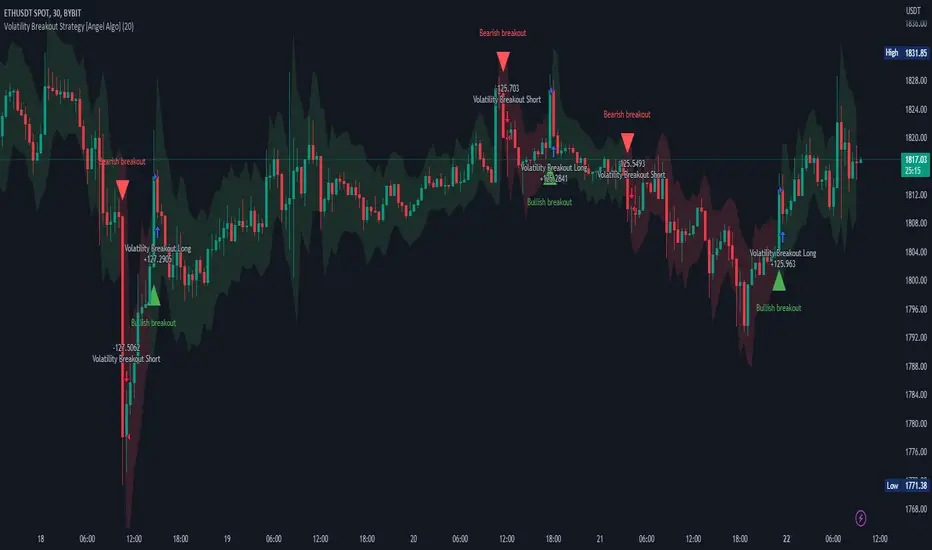
Volatility Breakout Strategy [Angel Algo]As traders, we're always looking for opportunities to profit from sudden price breakouts, and the Volatility Breakout Strategy aims to do just that.
This script is the perfect starting point for traders who want to experiment with capturing price movements resulting from increased volatility. The script plots the Average True Range (ATR) on the chart, which is a measure of the asset's volatility over a specified period. By setting the "Length" parameter, you can customize the period over which the volatility is measured.
Using the ATR, the strategy calculates upper and lower breakout levels and plots them on the chart. The signals for long and short positions are generated when the price crosses above the upper breakout level or below the lower breakout level, respectively. They are confirmed by checking the current bar state.
The strategy also fills the space between the upper and lower breakout levels with a color that indicates the latest signal direction. This feature helps traders quickly identify the prevailing trend.
The strategy uses the generated signals to enter trades. When a long or short signal is confirmed, and there is no open position in the direction of the signal, the strategy enters a long or short trade, respectively.
Choice of parameters.
Choosing the right value for the Length input parameter is crucial for tailoring the Volatility Breakout Strategy to suit your trading preferences. In general, a higher Length value implies a focus on capturing longer price moves. For instance, in this script, we have set the Length value to 20, resulting in trades that span approximately 100 candles. These trades encompass price trends consisting of multiple swings.
However, if your goal is to trade individual swings rather than longer trends, it's advisable to experiment with smaller values for the Length parameter. By reducing the Length, you can target shorter-term price movements and potentially increase the frequency of trades.
It's important to note that while a higher Length value tends to lead to longer trades, there is no strict correlation between the Length parameter and the average length of trades. This can vary across different markets. Therefore, it's essential to conduct thorough experimentation with various Length values and closely observe the length of trades they generate. Comparing these trade lengths with the average trend or swing length in the specific market can provide valuable insights.
Ideally, you should aim to select a Length value that aligns with the average trend or swing length observed in the market you are trading. This way, you can optimize the strategy to capture price movements that closely match the prevailing market conditions.
Remember, finding the optimal Length value is a process of trial and error, combined with careful observation of trade lengths and their correlation with market trends. So, don't be afraid to experiment and refine the Length parameter to maximize the effectiveness of the Volatility Breakout Strategy in your chosen market.
Disclaimer: This trading strategy is provided for educational and informational purposes only.Trading involves risk, and past performance is not indicative of future results.
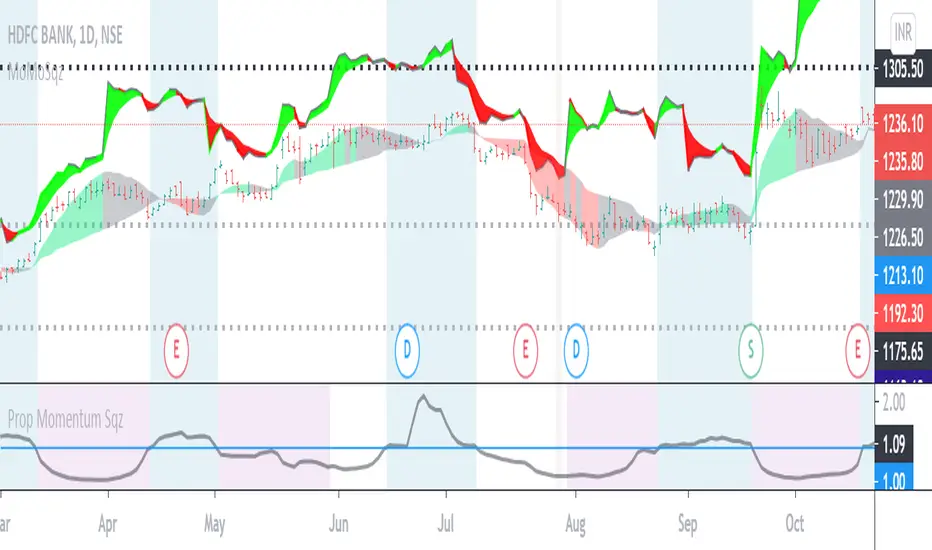
Volatility Squeeze Region IndicatorVolatility Squeeze Indicator conditions based on lowest ATR ,proportion of Bollinger and keltner channel upper and lower bands. Usage to identify and highlight Squeeze region when if indicator value <1 means Squeeze On and >1 means Squeeze off .
Additionally Background Highlights for Daily(Blue), Weekly(Brown) and Monthly(purple) Squeeze regimes for confluence check. For Breakouts and trades use appropriate Price Action and in conjunction other indicators.