Master Supertrend Strategy [Trendoscope]Here is the strategy version of the indicator - Master Supertrend
Options and variations are same throughout.
🎲 Variations
Following variations are provided in the form of settings.
🎯 Range Type
Instead of ATR, different types of ranges can be used for stop calculation. Here is the complete list used in the script.
Plus/Minus Range* - Calculates plus range and minus range for each candle and uses them for different sides of stop calculation
Ladder ATR - Based on the existing concept of Ladder ATR defined in Supertrend-Ladder-ATR
True Range - True range derived from standard function ta.tr
Standard Deviation - Standard deviation of close prices
🎯 Applied Calculation
In standard ATR, rma of TR is used for calculations. But, the application calculation provides option to users to use different mechanisms. It can be a type of moving average or few other types of calculations.
Available values are
sma
ema
hma
rma
wma
high
median
🎯 Other options
Few other options provided are
Use Close Price - If selected stops are calculated based on the close price instead of high/low prices
Wait for Close If selected, change of supertrend direction is calculated based on close price instead of high/low prices
Diminishing Stop Distance - When selected, stop distance for the trend direction can only reduce and cannot increase. This option is useful for keeping the tight stops on strong trends.
🎯 Plus Minus Range*
One of the range type used is Plus/Minus Range. What it means and how are these ranges calculated? Let's have a look.
Plus Range is an upward movement of a candle from its last price or open price whichever is lower.
Minus Range is a downward movement of a candle from its last price or open price whichever is higher.
This divides True Range into two separate range for positive and negative side.
Note : Effectiveness on daily charts are quire visible. However, if you want to use it for lower timeframes, please play around with settings before settling on suitable configuration.
التقلب

VWAP Trendfollow Strategy [wbburgin]This is an experimental strategy that enters long when the instrument crosses over the upper standard deviation band of a VWAP and enters short when the instrument crosses below the bottom standard deviation band of the VWAP. I have added a trend filter as well, which stops entries that are opposite to the current trend of the VWAP. The trend filter will reduce total false breakouts, thus improving the % profitable while maintaining the overall returns of the strategy. Because this is a trend-following breakout strategy, the % profitable will typically be low but the average % return will be higher. As a rule, be sure to look at the average winning trade % compared to the average losing trade %, and compare that to the % profitable to judge the effectiveness of a strategy. Factor in fees and slippage as well.
This strategy appears to work better with the lower timeframes, and I was impressed with its results. It also appears to work on a wide range of asset classes. There isn't a stop loss or take profit built-in (other than the reversal signals, which close the current trade), so I would encourage you to expand on the strategy based on your own trading parameters.
You can toggle off the bar colors and the trend filter if you so desire.
Future updates to this script (or ideas of improving on it) might include a take profit level set at one standard deviation past the current level and a stop loss level set at one standard deviation closer to the vwap from the current level - or applying a multiple to the two based off of your reward/risk ratio.
About the strategy results below: this is with commissions of 0.5 % per trade.

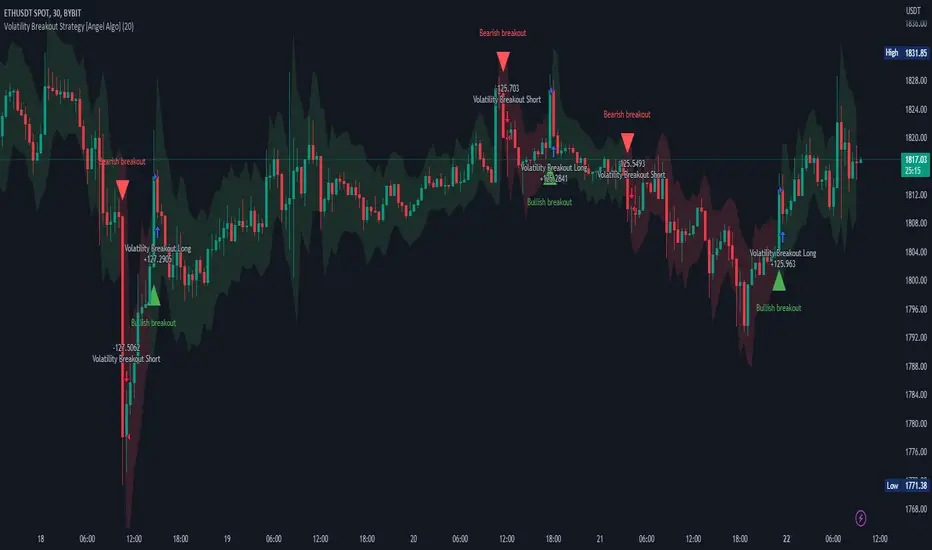
Volatility Breakout Strategy [Angel Algo]As traders, we're always looking for opportunities to profit from sudden price breakouts, and the Volatility Breakout Strategy aims to do just that.
This script is the perfect starting point for traders who want to experiment with capturing price movements resulting from increased volatility. The script plots the Average True Range (ATR) on the chart, which is a measure of the asset's volatility over a specified period. By setting the "Length" parameter, you can customize the period over which the volatility is measured.
Using the ATR, the strategy calculates upper and lower breakout levels and plots them on the chart. The signals for long and short positions are generated when the price crosses above the upper breakout level or below the lower breakout level, respectively. They are confirmed by checking the current bar state.
The strategy also fills the space between the upper and lower breakout levels with a color that indicates the latest signal direction. This feature helps traders quickly identify the prevailing trend.
The strategy uses the generated signals to enter trades. When a long or short signal is confirmed, and there is no open position in the direction of the signal, the strategy enters a long or short trade, respectively.
Choice of parameters.
Choosing the right value for the Length input parameter is crucial for tailoring the Volatility Breakout Strategy to suit your trading preferences. In general, a higher Length value implies a focus on capturing longer price moves. For instance, in this script, we have set the Length value to 20, resulting in trades that span approximately 100 candles. These trades encompass price trends consisting of multiple swings.
However, if your goal is to trade individual swings rather than longer trends, it's advisable to experiment with smaller values for the Length parameter. By reducing the Length, you can target shorter-term price movements and potentially increase the frequency of trades.
It's important to note that while a higher Length value tends to lead to longer trades, there is no strict correlation between the Length parameter and the average length of trades. This can vary across different markets. Therefore, it's essential to conduct thorough experimentation with various Length values and closely observe the length of trades they generate. Comparing these trade lengths with the average trend or swing length in the specific market can provide valuable insights.
Ideally, you should aim to select a Length value that aligns with the average trend or swing length observed in the market you are trading. This way, you can optimize the strategy to capture price movements that closely match the prevailing market conditions.
Remember, finding the optimal Length value is a process of trial and error, combined with careful observation of trade lengths and their correlation with market trends. So, don't be afraid to experiment and refine the Length parameter to maximize the effectiveness of the Volatility Breakout Strategy in your chosen market.
Disclaimer: This trading strategy is provided for educational and informational purposes only.Trading involves risk, and past performance is not indicative of future results.
Pure Morning 2.0 - Candlestick Pattern Doji StrategyThe new "Pure Morning 2.0 - Candlestick Pattern Doji Strategy" is a trend-following, intraday cryptocurrency trading system authored by devil_machine.
The system identifies Doji and Morning Doji Star candlestick formations above the EMA60 as entry points for long trades.
For best results we recommend to use on 15-minute, 30-minute, or 1-hour timeframes, and are ideal for high-volatility markets.
The strategy also utilizes a profit target or trailing stop for exits, with stop loss set at the lowest low of the last 100 candles. The strategy's configuration details, such as Doji tolerance, and exit configurations are adjustable.
In this new version 2.0, we've incorporated a new selectable filter. Since the stop loss is set at the lowest low, this filter ensures that this value isn't too far from the entry price, thereby optimizing the Risk-Reward ratio.
In the specific case of ALPINE, a 9% Take-Profit and and Stop-Loss at Lowest Low of the last 100 candles were set, with an activated trailing-stop percentage, Max Loss Filter is not active.
Name : Pure Morning 2.0 - Candlestick Pattern Doji Strategy
Author : @devil_machine
Category : Trend Follower based on candlestick patterns.
Operating mode : Spot or Futures (only long).
Trades duration : Intraday
Timeframe : 15m, 30m, 1H
Market : Crypto
Suggested usage : Short-term trading, when the market is in trend and it is showing high volatility .
Entry : When a Doji or Morning Doji Star formation occurs above the EMA60.
Exit : Profit target or Trailing stop, Stop loss on the lowest low of the last 100 candles.
Configuration :
- Doji Settings (tolerances) for Entry Condition
- Max Loss Filter (Lowest Low filter)
- Exit Long configuration
- Trailing stop
Backtesting :
⁃ Exchange: BINANCE
⁃ Pair: ALPINEUSDT
⁃ Timeframe: 30m
⁃ Fee: 0.075%
⁃ Slippage: 1
- Initial Capital: 10000 USDT
- Position sizing: 10% of Equity
- Start: 2022-02-28 (Out Of Sample from 2022-12-23)
- Bar magnifier: on
Disclaimer : Risk Management is crucial, so adjust stop loss to your comfort level. A tight stop loss can help minimise potential losses. Use at your own risk.
How you or we can improve? Source code is open so share your ideas!
Leave a comment and smash the boost button!
Thanks for your attention, happy to support the TradingView community.

JS-TechTrading: Supertrend-Strategy_Basic versionAre you looking for a reliable and profitable algorithmic trading strategy for TradingView? If so, you might be interested in our Supertrend basic strategy, which is based on three powerful indicators: Supertrend (ATR), RSI and EMA.
Supertrend is a trend-following indicator that helps you identify the direction and strength of the market. It also gives you clear signals for entry and exit points based on price movements.
RSI is a momentum indicator that measures the speed and change of price movements. It helps you filter out false signals and avoid overbought or oversold conditions.
EMA is a moving average indicator that smooths out price fluctuations and shows you the long-term trend of the market. It helps you confirm the validity of your trades and avoid trading against the trend.
Our Supertrend basic strategy combines these three indicators to give you a simple yet effective way to trade any market. Here's how it works:
- For long trades, you enter when the price is above Supertrend and pulls back below it (the low of the candle crosses Supertrend) and then rebounds above it (the high of the next candle goes above the pullback candle). You exit when the price closes below Supertrend or when you reach your target profit or stop loss.
- For short trades, you enter when the price is below Supertrend and pulls back above it (the high of the candle crosses Supertrend) and then drops below it (the low of the next candle goes below the pullback candle). You exit when the price closes above Supertrend or when you reach your target profit or stop loss.
- You can also use RSI and EMA filters to improve your results. For long trades, you only enter if RSI is above 50 and price is above 200 EMA. For short trades, you only enter if RSI is below 50 and price is below 200 EMA.
- You can set your stop loss and target profit as a percentage of your entry price or based on other criteria. You can also adjust the parameters of each indicator according to your preferences and risk tolerance.
Our Supertrend basic strategy is easy to use and has been tested on various markets and time frames. It can help you capture consistent profits while minimizing your losses.

Volatility Range Breakout Strategy [wbburgin]The "Volatility Range Breakout Strategy" uses deviations of high-low volatility to determine bullish and bearish breakouts.
HOW IT WORKS
The volatility function uses the high-low range of a lookback period, divided by the average of that range, to determine the likelihood that price will break in a specific direction.
High and low ranges are determined by the relative volatility compared to the current closing price. The high range, for example, is the (volatility * close) added to the close, the low range is this value subtracted by the close.
A volatility-weighted moving average is taken of these high and low ranges to form high and low bands.
Finally, breakouts are identified once the price closes above or below these bands. An upwards breakout (bullish) occurs when the price breaks above the upper band, while a downwards breakout (bearish) occurs when the price breaks below the lower band. Positions can be closed either by when the price falls out of its current band ("Range Crossover" in settings under 'Exit Type') or when the price falls below or above the volatility MA (default because this allows us to catch trends for longer).
INPUTS/SETTINGS
The AVERAGE LENGTH is the period for the volatility MA and the weighted volatility bands.
The VOLATILITY LENGTH is how far the lookback should be for highs/lows for the volatility calculation.
Enjoy! Let me know if you have any questions.

Yesterday’s High Breakout - Trend Following StrategyYesterday’s High Breakout it is a trading system based on the analysis of yesterday's highs, it works in trend-following mode therefore it opens a long position at the breakout of yesterday's highs even if they occur several times in one day.
There are several methods for exiting a trade, each with its own unique strategy. The first method involves setting Take-Profit and Stop-Loss percentages, while the second utilizes a trailing-stop with a specified offset value. The third method calls for a conditional exit when the candle closes below a reference EMA.
Additionally, operational filters can be applied based on the volatility of the currency pair, such as calculating the percentage change from the opening or incorporating a gap to the previous day's high levels. These filters help to anticipate or delay entry into the market, mitigating the risk of false breakouts.
In the specific case of NULS, a 9% Take-Profit and a 3% Stop-Loss were set, with an activated trailing-stop percentage. To postpone entry and avoid false breakouts, a 1% gap was added to the price of yesterday's highs.
Name : Yesterday's High Breakout - Trend Follower Strategy
Author : @tumiza999
Category : Trend Follower, Breakout of Yesterday's High.
Operating mode : Spot or Futures (only long).
Trade duration : Intraday.
Timeframe : 30M, 1H, 2H, 4H
Market : Crypto
Suggested usage : Short-term trading, when the market is in trend and it is showing high volatility.
Entry : When there is a breakout of Yesterday's High.
Exit : Profit target or Trailing stop, Stop loss or Crossunder EMA.
Configuration :
- Gap to anticipate or postpone the entry before or after the identified level
- Rate of Change for Entry Condition
- Take Profit, Stop Loss and Trailing Stop
- EMA length
Backtesting :
⁃ Exchange: BINANCE
⁃ Pair: NULSUSDT
⁃ Timeframe: 2H
⁃ Fee: 0.075%
⁃ Slippage: 1
- Initial Capital: 10000 USDT
- Position sizing: 10% of Equity
- Start : 2018-07-26 (Out Of Sample from 2022-12-23)
- Bar magnifier: on
Credits : LucF for Pine Coders (f_security function to avoid repainting using security)
Disclaimer : Risk Management is crucial, so adjust stop loss to your comfort level. A tight stop loss can help minimise potential losses. Use at your own risk.
How you or we can improve? Source code is open so share your ideas!
Leave a comment and smash the boost button!
Thanks for your attention, happy to support the TradingView community.

VIX Futures Spread StrategyThis script was an exercise in learning Pinescript and exploring the futures curve of the VIX in relation to SPY. Was deleted by TV, trying to republish it now with updated parameters for slippage and commission and a more detailed description.
"VIX Futures Spread Strategy" is a trading strategy that capitalizes on the spread between the 3-month VIX futures (VIX3M) and the spot VIX index. This strategy is based on the idea that the VIX futures spread can serve as a contrarian indicator of market sentiment, with extreme negative spreads potentially signaling oversold conditions and opportunities for long positions.
Ordinarily the VIX curve is in contango as futures contracts are priced at a premium to the current spot price and are used to hedge future uncertainty in the market. When the spot price of VIX spikes the curve can invert and enter backwardation; this strategy detects this condition and uses it as a trigger to open a long position in SPY. The spread going negative tends to correlate with excessive fear and uncertainty in the short term while expecting lower volatility in the long term, in this case 3 months out.
The strategy is designed to enter a long position when the VIX futures spread is negative and to exit the position when the spread rises above 3 -- when the curve is in contango again. The strategy employs a pyramiding approach, allowing up to 10 additional orders to be placed while the entry condition is met, with each order consisting of 10 contracts. This approach aims to maximize potential profits during periods of favorable market conditions.
In this strategy, the VIX futures spread is calculated as the difference between the 3-month VIX futures (VIX3M) and the spot VIX index. The spread is plotted as a histogram on the chart, with the zero line representing no spread, and horizontal lines at 0 and 3 indicating the entry and exit thresholds, respectively.
The strategy's backtesting settings use an initial capital of HKEX:10 ,000, a commission of 0.5% per trade, and a maximum of 10 pyramiding orders, and a slippage of 2 ticks.
Please note that this strategy is intended for educational purposes and should not be considered as financial advice. Before using this strategy in live trading, make sure to thoroughly test and optimize its parameters to suit your risk tolerance and specific trading conditions.

AUTOMATIC GRID BOT STRATEGY [ilovealgotrading]
OVERVIEW:
This Grid trading strategy can help you maximize your profit in a ranging sideways market with no clear direction.
INDICATOR:
We can get some money by taking advantage of the movement of the price between the range we have determined.
Short positions are opened while the price is rising, long positions are opened while the price is falling.
Therefore, there is no need to predict the trend direction.
What is different in this indicator:
I want to say thank you to © thequantscience. His GRID SPOT TRADING ALGORITHM - GRID BOT TRADING strategy helped me when I was writing my indicator.
I want to explain what I have improved:
1- Grid strategy is a type of strategy that can be traded in very short time frames and users can trade this strategy algorithmically by connecting this strategy to their own accounts with the help of API systems. For this reason, I have developed a software that can give us signals by dynamically changing the long and short messages when users are trading.
2- We can change the start and end dates of our grid bot as we want. It is necessary to use this setting when setting up automatic bots, so that previously opened transactions are not taken into account.
3 - Lot or quantity size should not be excessively small when users are taking automatic trades because exchanges have limitations, to avoid this problem, I have prevented this error by automatically rounding up to the nearest quantity size inside the software.
4 - Users can avoid excessive losses by using stop loss on this grid bot if they wish.
5 - When our price is over the range high or below the range low, our open positions are closed, if the stop button is active. We can also change which close price time frame we take as a basis from the settings.
6 -Users can set how many dollars they can enter per transaction while performing their transactions automatically.
IMPLEMENTATION DETAILS – SETTINGS:
This script allows the user to choose the highs and lows leves of our range. Our bot trades in the specified range.
1. This strategy allows us to set start and end backtest dates.
2. We can change range high and range low leves of our bot
3. IF people want to trade algorithmically with the help of this bot, there are 6 different input systems that will receive the Json codes as an alarm
4. IF the price closes above the upper line or below the lower line, all transactions will be closed. We can determine in which time frame our transactions will be stopped if the price closes outside these levels.We can adjust how our bot works by activating or turning off the Stop Loss button.
5. In this strategy, you can determine your dollar cost for per position.
6. The user can also divide the interval we have determined into 10 parts or 20 equal parts.
7. The grid is divided and colored at the interval we set. At the same time, if we don't want we can turn off colored channels.
Notes:
If you're going to connect this bot to an automatic Long and Short direction,
Don’t forget! you need to Webhook URL,
Don’t miss paste this code to your message window {{strategy.order.alert_message}}
ALSO:
Set your range below the support zones and above the resistance zones.
Don't be afraid to take a wide range, it doesn't matter if you make a little money, the important thing is that you don't lose money.
If you have any ideas what to add to my work to add more sources or make calculations cooler, suggest in DM .

I11L - Better Buy Low Volatility or High Volatility?This Pine Script code defines a TradingView strategy called "I11L - Better Buy Low Volatility or High Volatility?". The strategy aims to study the difference between buying when an asset's volatility is low and when it is high. It allows the user to select whether to buy during low or high volatility periods by changing the input variable mode.
Here's a brief explanation of the System:
The strategy is initialized with relevant settings such as overlay, pyramiding, default quantity type, initial capital, and others.
The mode input allows the user to choose between "Buy low Volatility" and "Buy high Volatility" options.
volatilityTargetRatio is the user-defined threshold to be used for making buy decisions. A value of 1 equals the average ATR (Average True Range) for the security. A lower value indicates lower volatility.
atrLength is the number of periods to calculate the ATR.
sellAfterNBarsLength sets the number of bars to hold the position before selling it.
The script calculates the ATR using the ta.atr() function, and then divides it by the closing price to normalize the value. It also calculates the simple moving average (SMA) of the normalized ATR over a period of 5 times the ATR length, and then computes the ratio between the normalized ATR and its average.
The script keeps track of the number of holding bars using the variable holdingBarsCounter. When there are open trades, the holding bars counter is incremented.
The decision to buy is made based on the selected mode and whether the computed ratio is above or below the user-defined threshold.
When the holding bars counter exceeds the user-defined limit, the position is closed.
The script plots the computed ratio with different colors based on the buy and close conditions. The ratio is plotted in green when a buy signal is triggered, red when a close signal is triggered, and white in all other cases. The value of 1 (the reference for the average ATR) is also plotted on the chart in white color.
This strategy helps traders study the difference between buying during low and high volatility periods and compare the performance of these conditions. It can be useful for analyzing the effectiveness of volatility-based trading strategies, such as entering positions when the market is calm or during periods of strong price movement.

Extended Price Volume Trend Strategy : EducationalThe Extended Price Volume Trend (EPVT) is a technical indicator that is used to identify potential trend changes and measure the strength of a trend. In this strategy, we combine the EPVT with other indicators to create a trading system that aims to capture trend reversals and momentum shifts.
The EPVT indicator is calculated by taking the cumulative volume and multiplying it by the percentage change in price. We then find the highest and lowest values of this indicator over a certain period of time to determine the baseline. The difference between the EPVT and the baseline is then plotted on a chart to create the EPVT line.
To use this indicator for trading, we look for crossovers of the EPVT line with zero. When the EPVT crosses above zero, it indicates that buying pressure is increasing, and we may consider taking a long position. Conversely, when the EPVT crosses below zero, it indicates that selling pressure is increasing, and we may consider taking a short position.
To further refine our trading signals, we use three take-profit levels, which we set as a percentage of the current EPVT value. We also use a simple moving average to provide additional confirmation of trend changes.
In summary, the EPVT trading strategy is a technical analysis-based approach to trading that aims to identify potential trend reversals and momentum shifts. By combining the EPVT indicator with other technical tools, we can create a comprehensive trading system that provides clear entry and exit signals for both long and short positions. Please note that this strategy is for educational purposes only and should not be taken as financial advice.

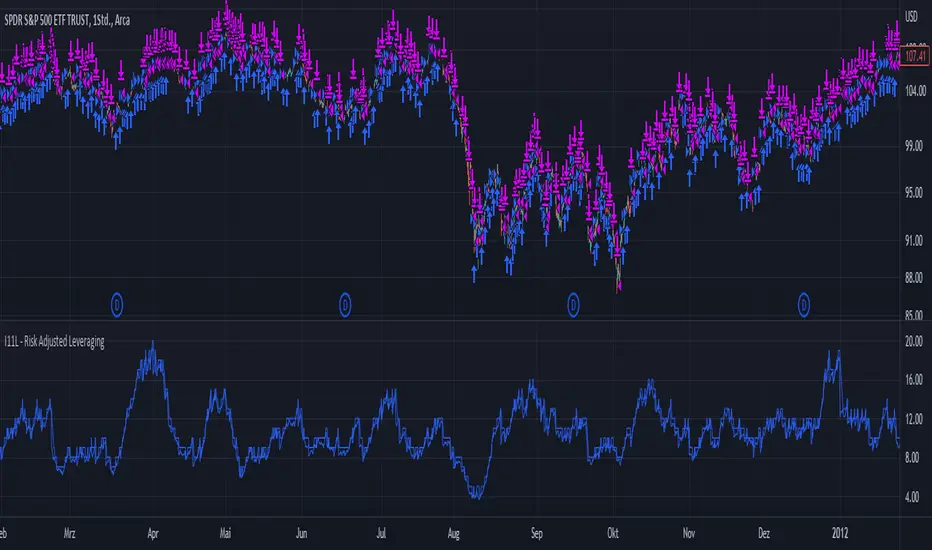
I11L - Risk Adjusted LeveragingThis trading system, called "I11L - Risk Adjusted Leveraging", is designed to manage trades based on the current market volatility relative to its historical average. The system calculates the target number of open trades based on the ATR (Average True Range) indicator and adjusts the leverage accordingly. The system opens and closes trades using a pyramiding approach, allowing multiple positions to be opened at the same time.
Here's a step-by-step explanation of the system:
1. Calculate the ATR with a 14-day period and normalize it by dividing it by the current closing price.
2. Calculate the 100-day simple moving average (SMA) of the normalized ATR.
3. Calculate the ratio of the normalized ATR to its 100-day SMA.
4. Determine the target leverage based on the inverse of the ratio (2 / ratio).
5. Calculate the target number of open trades by multiplying the target leverage by 5.
6. Plot the target number of open trades and the current number of open trades on the chart.
7. Check if there's an opportunity to buy (if the current number of open trades is less than the target) or close a trade (if the current number of open trades is more than the target plus 1).
8. If there's an opportunity to buy, open a long trade and add the trade's name to the openTrades array.
9. If there's an opportunity to close a trade and there are trades in the openTrades array, close the most recent trade by referencing the array and remove it from the array.
This system aims to capture trends in the market by dynamically adjusting the number of open trades and leverage based on the market's volatility. It uses an array to keep track of open trades, allowing for better control over the opening and closing of individual trades.
Baseline Cross Qualifier Volatility Strategy with HMA Trend BiasFor trading ES on 30min Chart
Trading Rules
Post Baseline Cross Qualifier (PBCQ): If price crosses the baseline but the trade is invalid due to additional qualifiers, then the strategy doesn't enter a trade on that candle. This setting allows you override this disqualification in the following manner: If price crosses XX bars ago and is now qualified by other qualifiers, then the strategy enters a trade.
Volatility: If price crosses the baseline, we check to see how far it has moved in terms of multiples of volatility denoted in price (ATR x multiple). If price has moved by at least "Qualifier multiplier" and less than "Range Multiplier", then the strategy enters a trade. This range is shown on the chart with yellow area that tracks price above/blow the baseline. Also, see the dots at the top of the chart. If the dots are green, then price passes the volatility test for a long. If the dots are red, then price passes the volatility test for a short.
Take Profit/Stoploss Quantity Removed
1 Take Profit: 100% of the trade is closed when the profit target or stoploss is reached.
2 Take Profits: Quantity is split 50/50 between Take Profit 1 and Take Profit 2
3 Take Profits: Quantify is split 50/25/25.
Stratgey Inputs
Baseline Length
37
Post Baseline Cross Qualifier Enabled
On
Post Baseline Cross Qualifier Bars Ago
9
ATR Length
9
Volatility Multiplier
0
Volatility Range Multiplier
10
Volatility Qualifier Multiplier
2
Take Profit Type
1 Take Profit
HMA Length
11

Exponential Stochastic Strategywhat is Exponential Stochastic?
it is a modified version of the stochastic indicator. This strategy does not include pyramiding, repaint, trailing stop or take profit.
what it does?
It contains an extra input in addition to the stochastic indicator. Thanks to this input, different exponential weights can be given to the outputs and the indicator can be made more sensitive or insensitive. The strategy buys when the indicator leaves the overbought zone, sells when it leaves the oversold zone and always stays in the trade.
how it does it?
it uses this formula: i.hizliresim.com
Thanks to this formula, even if the weights given to the outputs change, the indicator always continues to take a value between 0 and 100.
how to use it ?
With the input named "exp", you can change the sensitivity of the indicator and develop different strategies. other inputs are the same as the stochastic indicator. Increasing the exp value causes the indicator to signal less, decreasing it makes it much more sensitive.

Strategy Myth-Busting #11 - TrendMagic+SqzMom+CDV - [MYN]This is part of a new series we are calling "Strategy Myth-Busting" where we take open public manual trading strategies and automate them. The goal is to not only validate the authenticity of the claims but to provide an automated version for traders who wish to trade autonomously.
Our 11th one is an automated version of the "Magic Trading Strategy : Most Profitable Indicator : 1 Minute Scalping Strategy Crypto" strategy from "Fx MENTOR US" who doesn't make any official claims but given the indicators he was using, it looked like on the surface that this might actually work. The strategy author uses this on the 1 minute and 3 minute timeframes on mostly FOREX and Heiken Ashi candles but as the title of his strategy indicates is designed for Crypto. So who knows..
To backtest this accurately and get a better picture we resolved the Heiken Ashi bars to standard candlesticks . Even so, I was unable to sustain any consistency in my results on either the 1 or 3 min time frames and both FOREX and Crypto. 10000% Busted.
This strategy uses a combination of 3 open-source public indicators:
Trend Magic by KivancOzbilgic
Squeeze Momentum by LazyBear
Cumulative Delta Volume by LonesomeTheBlue
Trend Magic consists of two main indicators to validate momentum and volatility. It uses an ATR like a trailing Stop to determine the overarching momentum and CCI as a means to validate volatility. Together these are used as the primary indicator in this strategy. When the CCI is above 0 this is confirmation of a volatility event is occurring with affirmation based upon current momentum (ATR).
The CCI volatility indicator gets confirmation by the the Cumulative Delta Volume indicator which calculates the difference between buying and selling pressure. Volume Delta is calculated by taking the difference of the volume that traded at the offer price and the volume that traded at the bid price. The more volume that is traded at the bid price, the more likely there is momentum in the market.
And lastly the Squeeze Momentum indicator which uses a combination of Bollinger Bands, Keltner Channels and Momentum are used to again confirm momentum and volatility. During periods of low volatility, Bollinger bands narrow and trade inside Keltner channels. They can only contract so much before it can’t contain the energy it’s been building. When the Bollinger bands come back out, it explodes higher. When we see the histogram bar exploding into green above 0 that is a clear confirmation of increased momentum and volatile. The opposite (red) below 0 is true when there are low periods. This indicator is used as a means to really determine when there is premium selling plays going on leading to big directional movements again confirming the positive or negative momentum and volatility direction.
If you know of or have a strategy you want to see myth-busted or just have an idea for one, please feel free to message me.
Trading Rules
1 - 3 min candles
FOREX or Crypto
Stop loss at swing high/low | 1.5 risk/ratio
Long Condition
Trend Magic line is Blue ( CCI is above 0) and above the current close on the bar
Squeeze Momentum's histogram bar is green/lime
Cumulative Delta Volume line is green
Short Condition
Trend Magic line is Red ( CCI is below 0) and below the current close on the bar
Squeeze Momentum's histogram bar is red/maroon
Cumulative Delta Volume line is peach

ATR Mean Reversion Strategy V1**Long Only Strategy**
When Price drops below the ATR band below it will enter a buy on the next candle open
SL at current price minus ATR* ATR multiplier
TP at Mean EMA or if higher than Mean EMA and current candle low is below previous candle low or if price is above ATR
NB: I would highly recommend a low fee broker (I use ICmarkets raw spread account) due to the fact that this is a decently high frequency trading strategy you will rack up a lot of commission, if you use and exchange like Bybit or Binance the strategy will not be profitable due to the high commissions.

DCA Simulator A simple yet powerful Dollar Cost Averaging (DCA) simulator.
You just add the script to your chart, and you'll be able to see:
- Every single entry with its size
- The evolution of you average price in time (blue line)
- The profit and loss areas (where market price < average price the DCA is at loss, and the background is colored in red. At the contrary, where mkt price is > average price, it's profit area and the background is green).
- Max drawdown: the point in price and time where the DCA loss is maximum in the considered time interval. The drawdown amount is specified.
- Profit (or loss) and total cost at the end of the time interval or at the present day: the script shows how much the DCA is netting at a profit or loss, as well as the total cost of the DCA itself.
The parameters are:
- Date start and date end: time interval of the DCA simulation
- DCA period (you can choose between daily, weekly and monthly)
- Week day or month day if you choose those periods
- Single operation size (in base currency)
- Option to choose a DCA LONG or DCA SHORT (for uber bears)
- Option to include an exit strategy that partially closes your position (the % size closed can be chosen as well with the parameter "exit_close_perc") every time the DCA realizes a specific gain (choosable with the parameter "exit_gain_threshold"). If you choose "none" as an exit strategy, the script will assume to never close positions until the end of the period or the present day for simulation purpose.
NB: just ignore the TV strategy tester results, all the data are visible on the chart.

GAVAD - Selling after a Strong MovimentThis strategy search for a moment whe the market make two candles are consistently strong, and open a Sell, searching the imediactly correction, on the new candle. It`s easy to see the bars on the histogram graph. Purple Bars represent the candle variation. when on candle cross ove the Signal line the graph plot an Yellow ci, if the second bar crossover the signal a green circle is ploted and the operation start on start of the next candle.
This strategy can be used in a lot of Stocks and other graphs. many times we need a small time of graph, maybe 1 or 5 minutes because the gain shoud be planned to a midle of the second candle. You need look the stocks you will use.
Stocks > 100 dolars isnt great, markets extremly volatly not too. but, Stocks that have a consistently development are very interisting. Look to markets searching maybe 0.5% or 1%.
For this moment, I make the development of a Brasilian Real x American Dollar. In 15 Minutes.
if you use in small timeframe the results can be better.
On this time we make more than 500 trades with a small lot of contracts, without a big percent profitable, but a small profit in each operation, maybe you search more than. To present a real trading system I insert a spreed to present a correct view of the results.
Each stock, Index, or crypto there is a specific configuration?
my suggestion for new stocks
You need choice a stock and using the setup search set over than 70% gain (percent profitable), using a 1% of gain and loss between 1-2%
as the exemple (WDO)
default I prepare a Brazilian Index
6-signal (6% is variation of a candle of the last candle)
10000- multiplicator (its important to configure diferences betwen a stock and an Indice)
gain 3 (this proportion will be set looking you target, how I say, 1% can be good)
loss 8 (this proportion will be set with you bankroll management, how I say, maybe 2%, you need evaluate)
for maximize operations I use in the 1 or 5 minute graph. Timeframes more large make slowlly results,
(but not unable that you use in a 1 hour or a 1 day.)
I make this script by zero. Maybe the code doesnt so organized, but is very easy to understand. If you have any doubts . leave a comment.
I hope help you.

TradePro's 2 EMA + Stoch RSI + ATR StrategySaw TradePro's "NEW BEST HIGHEST PROFITING STRATEGY WITH CRAZY RESULTS - 2 EMA+ Stochastic RSI+ ATR", and was curious on the back testing results. This strategy is an attempt to recreate it.
This strategy uses 50 / 200 EMAs, Stochastic RSI and ATR.
Long Entry Criteria:
- 50 EMA > 200 EMA
- Price closes below 50 EMA
- Stochastic RSI has gone into oversold < 20
- Stochastic RSI crosses up while making higher low from previous cross up
Short Entry Criteria:
- 50 EMA < 200 EMA
- Price closes above 50 EMA
- Stochastic RSI has gone into overbought > 80
- Stochastic RSI crosses down while making lower high from previous cross down
Stop-loss is set to ATR stop-loss
Take Profit is 2x the risk
All parameters are configurable.
Enjoy~~

Strategy: Range BreakoutWhat?
In the price action, levels have a significant role to play. Based on the price moving above/below the levels - the underlying instrument shows some price-action in the direction of breakout/breakdown.
There are plenty of ways level can be determined. Levels are the decision point to take a trade or not. But if we make the level derivation complex, then the execution may get hamper.
This strategy script, developed in PineScript v5, is our attempt at solving this problem at the core by providing this simple, yet elegant solution to this problem.
It's essentially an attempt to Trade Simple by drawing logical (horizontal) lines in the chart and take actions, after multiple associated parameters confirmation, on the breakout / breakdown of the levels.
How?
Let us explain how we are drawing the levels.
We are depending on some of the parameters as described below:
Open Range : During intraday movement, often if prices move beyond a particular level, it exibits more movement in the same swing in same direction. We found out, through our back testing for Indian Indices like NSE:NIFTY , NSE:BANKNIFTY or NSE:CNXFINANCE the first 15m (i.e 09:15 AM to 09:30 AM, IST) is one of such range. For Indian stocks, it is 9:15 to 9:45. And for MCX MCX:CRUDEOIL1! it's 5:00 pm to 6:00 pm. There are our first levels.
PDHCL : Previous Day High, Close, Low. This is our next level
VWAP : The rolling VWAP (volume weighted average price)
In the breakout/breakdown of the Open Range and Previous Day High/Low, we are taking the trade decisions as follows using CEST principle:
C onditions :
If current bar's (say you are in 5m timeframe) closing is broken out the Open Range High or Previous Day High, taken a Buy/Long decision (let's say buying a Call Option CE or selling a Put Option PE or buying the future or cash).
If current bar's (say you are in 5m timeframe) closing is broken down the Open Range Low or Previous Day Low, taken a Sell/Short decision (let's say buying a Put Option CE or selling a Call Option PE or selling the future or cash).
Additionally, and optionally (default ON, one can turn off): we are checking various other associated multiple confirmations as follows:
1. Momentum : Checking 14-period RSI value is more than 50 or less than 50 (all parameters like period, OB, OS ranges are configurable through settings)
2. Current bar's volume is more than the last 20 bars volume average. How much more - that multiplier is also configurable. (default is 1)
3. The breakout candle is bullish (green) or bearish (red).
E ntry :
All of these happens only on the closing of the candle . Means: Non Repainting! .
Clearly in the chart we are showing as green up arrow BO (breakout for buy) and red down arrow BD (breakdown for sell) to take your decision process smooth.
So, on the closing of the decision BO/BD candle we are entering the trade (with a thumping heart and nail biting ...)
S top Loss :
We are relying on the time tasted (last 40 years) mechanism of Average True Range (ATR) of default 14 period. This default period is also configurable.
So for Long trades: the 14 period ATR low band is the SL.
For Short trades: the 14 period ATR high band is the SL.
T arget :
We are depending on the thump rule of 1:2 Risk Reward. It's simple and effective. No fancy thing. We are closing the trade on double the favorable price movement compared to the SL placed. Of course, this RR ratio is confiurable from the settings, as usual.
What's Unqiue in it?
The utter simplicity of this trading mechanism. No fancy things like complex chart pattern, OI data, multiple candlestick patterns, Order flow analysis etc.
Simple level determination,
Marking clearly in the chart.
Making each parameter configurable in Settings and showing tooltip adjacent to the parameter to make you understand it better for your customization,
Wait for the candle close, thus eliminating the chances of repainting menace (as much as possible)
Additional momentum and volume check to trade entry confirmation.
Works with normal candlestick (nothing special ones like HA ...)
Showing everything as a Summary Table (which, again can be turned off optionally) overlaying at the bottom-right corner of the chart,
Optionally the Summary Table can be configured to alert you back (say you get it notified in your email or SMS).
That way, a single, simple, effective trade setup will ease your journey as smooth sail as possible.
Mentions
There are plenty of friends from whom time to time we borrowed some of the ideas while working closely together over last one year.
From tradingview community, we took the spirit of @zzzcrypto123 awesome work done long back (in 2020) as the indicator "ORB - Opening Range Breakout". (We tried to reach him for his explicit consent, unable to catch hold of him).
Some other publicly available materials we have consulted to get the additional checks (like RSI, volume).
Lat word
Use it please and thank you for your constant patronage in following us in this awesome platform. Let's keep growing together.
Disclaimer :
This piece of software does not come up with any warrantee or any rights of not changing it over the future course of time.
We are not responsible for any trading/investment decision you are taking out of the outcome of this indicator.

Strategy Myth-Busting #7 - MACDBB+SSL+VSF - [MYN]This is part of a new series we are calling "Strategy Myth-Busting" where we take open public manual trading strategies and automate them. The goal is to not only validate the authenticity of the claims but to provide an automated version for traders who wish to trade autonomously.
Our seventh one we are automating is the "Magic MACD Indicator: Crazy Accurate Scalping Trading Strategy ( 74% Win Rate )" strategy from "TradeIQ" who claims to have backtested this manually and achieved 427% profit with a 74% winrate over 100 trades in just a 4 months. I was unable to emulate these results consistently accommodating for slippage and commission but even so the results and especially the high win-rate and low markdown is pretty impressive and quite respectable.
This strategy uses a combination of 3 open-source public indicators:
AK MACD BB v 1.00 by Algokid
SSL Hybrid by Mihkel00
Volume Strength Finder by Saravanan_Ragavan
This is considered a trend following Strategy. AK MACD BB is being used as the primary short term trend direction indicator with an interesting approach of using Bollinger Bands to define an upper and lower range and upon the MACD going above the upper Bollinger Bands, it's indicative of an up trend, where as if the MACD is below the lower Bollinger Band, it's indicative of a down trend. To eliminate false signals, SSL Hyrbid is used as a trend confirmation filter, confirming and eliminating false signals from the MACD BB. It does this by validating the price action is above the the EMA and the SSL is positive that is a confirmation of an uptrend. When the price action is below the EMA and the SSL is negative, that is an confirmation of a downtrend. To avoid taking trades during ranged markets, VSF Buyer's Strength is used so the buyers/sellers strength and must be above 50% or the trade will not be inititiated.
Trading Rules
5 min candles but other lower time frames even below 5m work quite well too.
Best results can be found by tweaking these 2 input parameters:
Number Of bars to look back to ensure MACD isn't above/below Zero Line
Number Of bars back to look for SSL pullback
Long Entry when these conditions are true
AK MACD BB BB issues a new continuation long signal. A new green circle must appear on the indicator and these circles should not be touching across the zero level while they were previously red
SSL Hybrid price action closes above the EMA and the line is blue color and then creates a pullback . The pullback is confirmed when the color changes from blue to gray or from blue to red.
VSF Buyers strength above 50% at the time the MACD indicator issues a new long signal.
Short Entry when these conditions are true
AK MACD BB issues a new continuation short signal. A new red circle must appear on the indicator and these circles should not be touching across the zero level while they were previously green
SSL Hybrid price action closes below the EMA and the line is red color then it has to create a pullback . The pullback is confirmed when the color changes from red to gray or from red to blue.
VSF Sellers strength above 50% at the time the MACD indicator issues a new short signal.
Stop Loss at EMA Line with TP Target 1.5x the risk
If you know of or have a strategy you want to see myth-busted or just have an idea for one, please feel free to message me.

PSAR BBPT ZLSMA BTC 1minLong entry:
PSAR gives buy signal
BBPT prints green histogram
ZLSMA is below the price
ZLSMA has uptrend
SL is smaller than the max SL
Optional Sessions and EMA filters
Short entry
PSAR gives sell signal
BBPT prints red histogram
ZLSMA is above the price
ZLSMA has downtrend
SL is smaller than the max SL
Optional Sessions and EMA filters
SL:
Placed below ZLSMA + offset on long
Placed above ZLSMA + offset on short
TP1:
1x the SL by default
Takes no profit by default, 50% is also a good setting
TP2:
2x the SL by default
Take out all remaining position size.
If price reaches TP1, the SL is set to the entry price.

Bull Trend Filtered StochRSI (BTFS)Ride Bull Trends Via Stochastic with Special Rules for Heavy Bullish Bias
TLDR: Long Only Trend Indicator Where you are always entered Long if the stochastic is over the lower band line and the price is above the Donchian Chanel high. Exit when Stochastic RSI is below the lower band.
Indicators:
Filter = Trend/Bullish indicator is Donchian of ema(high) this is set as the highest ema(high, 6) in the last 30 candles. this can be adjusted to fit the market as desired.
**indicator prints green background when the filter condition is satisfied***
Entry Exit = enter when the Stoch RSI is above the given lower trend band. This value is set at 35 but can be adjusted according to risk tolerance and market conditions.
Logic:
this indicator allows a trader to be present during bullish/parabolic trends by only triggering if the close is > than the highest 6 candle average high over the last 30 candles. This filter requires the market to be in a generally bullish posture. If the market is in this condition the stochastic RSI indicator value offers a good gauge of price action and only goes significantly down if price trends below the average range of the rsi period. This filters out noise and keeps a trader from over trading on inconsequential corrections while responding fairly quickly to changes in general trend direction. the response is fast enough to produce an unprofitable amount of false signals if the bull market filter is not implemented. However when used in combination the signals return desirable results in bull trending markets.
Hope this Helps. Happy Trades.
-Snarky Puppy
