Breackout V8 MomentumBreakout V6 Strategy with Fibonacci TPs
Description
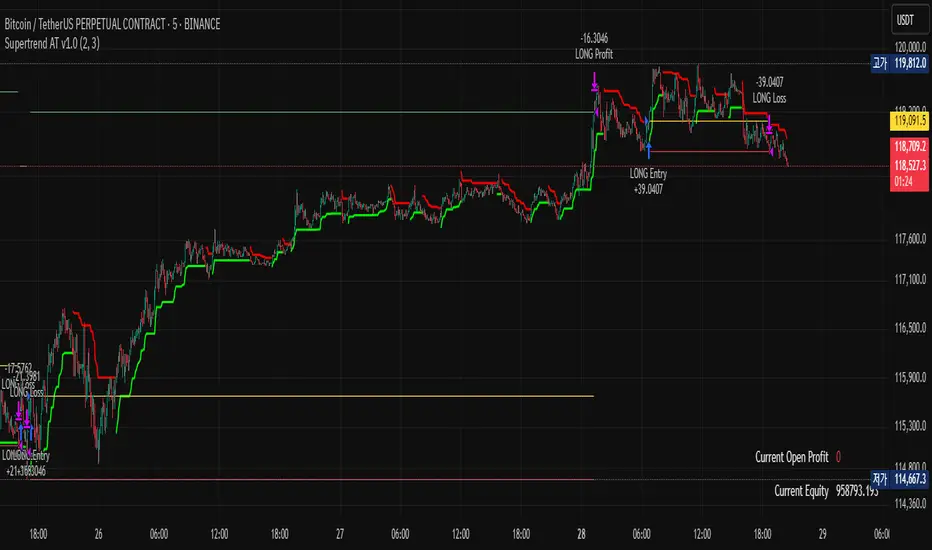
Developed by Coton, this automated trading tool is designed to identify and capitalize on breakouts from consolidation zones, supported by momentum indicators. It leverages technical indicators to detect significant price movements and enters positions with take-profits based on Fibonacci levels and a trailing stop to protect profits. Optimized for crypto trading , it operates in Scalping (1m) or Intraday (5m) modes.
Indicators Used
Volatility Bands : Identify price compression and expansion zones to detect consolidations and breakouts.
Momentum Indicators : Measure the strength and direction of price movements to confirm breakouts.
Volume Indicators : Validate breakouts with significant increases in trading activity.
Dynamic Levels : Define entry and exit points based on adaptive calculations.
Features
Breakout Detection : Identifies exits from consolidation zones with quality filters.
Fibonacci Take-Profits : Profit targets calculated using extension levels to maximize gains.
Trailing Stop : Protects profits by dynamically adjusting the stop-loss based on volatility.
Visualization : Displays consolidation zones, entry levels, stop-losses, and take-profits on the chart.
Alerts : Notifications for confirmed and ongoing breakouts with a minimum risk/reward ratio.
Table : Shows the strategy status and estimated leverage in real-time.
Input Parameters
Trading Mode: Scalping (1m) or Intraday (5m) (default: Intraday)
Fibonacci Level for TP: 1.618 (adjustable 0.5-5.0)
Minimum RR for Alerts: 1.2 (filters alerts)
Alerts
Confirmed Breakout (validated movement with quality criteria).
Ongoing Breakout (tracked with minimum risk/reward ratio, every 5 candles).
Disclaimers
Not financial advice; test in demo mode.
Past performance is not indicative of future results.
High risk in crypto trading; use proper risk management (1-2% per trade).
Commission (0.1%) may impact results; adjust for your broker.
Contact
Coton for questions or improvements.
استراتيجية Pine Script®