ES-VIX Expected Move LTF LevelsES-VIX LTF Price Bands
This indicator plots dynamic intraday price bands for ES futures based on real-time volatility levels measured by the VIX (CBOE Volatility Index). The bands evolve throughout the trading day, providing volatility-adjusted price targets.
Formulas:
Upper Band = (Input TF Open) + (ES Price × VIX x √(Input TF ÷ (23h in min) ) ÷ 100
Lower Band = Daily Open - (ES Price × VIX x √(Input TF ÷ (23h in min) ) ÷ 100
The calculation uses the square root of Input TF ÷ (23h in min) to convert annualized VIX volatility into an expected TF move, then scales it as a percentage adjustment from the current TF input's open.
Features:
Real-time band calculation that updates throughout the trading session
Upper band (green) extends from the current TF's open
Lower band (red) contracts from the current TF's open
Inner upper band (green) at 50% of expected move
Inner lower band (red) at 50% of expected move
Middle Inner upper band (green) at 80% of expected move
Middle Inner lower band (red) at 80% of expected move
Information table displaying:
Current input TF
Current ES price and VIX level
Current input TF Open
Expected move
التقلب

Santhosh Time Block HighlighterI have created an indicator to differentiate market trend/momentum in different time zone during trading day. This will help us to understand the market pattern to avoid entering trade during consolidation/distribution. Its helps to measure the volatility and market sentiment

ATR + infoIt shows the ATR, the stop loss and stop profit levels, and the amount to invest based on capital and the risk you are willing to take.

價漲量增 + 力度 + 艾爾德 精簡版這是一套結合三大核心邏輯的多維強勢趨勢偵測系統:
PUVU 價漲量增:確認價格突破是否具備真實量能。
Strength 力度指標:整合 ROC、RSI 斜率、MACD 動能三項數據,轉換為 0–100 的標準化強度分數。
Elder Impulse System:以視覺化 K 棒顏色呈現趨勢動能變化。
此外,本工具加入 Trend Bias 趨勢偏向濾網、極端反手模式、精準信號三角形與可視化面板,
可用於判斷市場是否具備持續性動能、突破是否可信、反轉是否具備條件。
本指標適用於:
趨勢交易
波段突破
盤整突破偵測
高勝率強勢區辨識
多品種分析(加密貨幣、外匯、指數、股票)
此版本可用於觀察趨勢方向、尋找可能的交易機會與賣出時機。
For English users:
This script provides trend analysis, volume confirmation, strength scoring, and impulse-based visualization to assist traders in identifying potential breakouts and market conditions.

Gaussian Hidden Markov ModelA Hidden Markov Model (HMM) is a statistical model that assumes an underlying process is a Markov process with unobservable (hidden) states. In the context of financial data analysis, a HMM can be particularly useful because it allows for the modeling of time series data where the state of the market at a given time depends on its state in the previous time period, but these states are not directly observable from the market data. When we say that a state is "unobservable" or "hidden," we mean that the true state of the process generating the observations at any time is not directly visible or measurable. Instead, what is observed is a set of data points that are influenced by these hidden states.
The HMM uses a set of observed data to infer the sequence of hidden states of the model (in our case a model with 3 states and Gaussian emissions). It comprises three main components: the initial probabilities, the state transition probabilities, and the emission probabilities. The initial probabilities describe the likelihood of starting in a particular state. The state transition probabilities describe the likelihood of moving from one state to another, while the emission probabilities (in our case emitted from Gaussian probability density functions, in the image red yellow and green Laplace probability densitty functions) describe the likelihood of the observed data given a particular state.
MODEL FIT
Posterior
By default, the indicator displays the posterior distribution as fitted by training a 3-state Gaussian HMM. The posterior refers to the probability distribution of the hidden states given the observed data. In the case of your Gaussian HMM with three states, the posterior represents the probabilities that the model assigns to each of these three states at each time point, after observing the data. The term "posterior" comes from Bayes' theorem, where it represents the updated belief about the model's states after considering the evidence (the observed data).
In the indicator, the posterior is visualized as the probability of the stock market being in a particular volatility state (high vol, medium vol, low vol) at any given time in the time series. Each day, the probabilities of the three states sum to 1, with the plot showing color-coded bands to reflect these state probabilities over time. It is important to note that the posterior distribution of the model fit tells you about the performance of the model on past data. The model calculates the probabilities of observations for all states by taking into account the relationship between observations and their past and future counterparts in the dataset. This is achieved using the forward-backward algorithm, which enables us to train the HMM.
Conditional Mean
The conditional mean is the expected value of the observed data given the current state of the model. For a Gaussian HMM, this would be the mean of the Gaussian distribution associated with the current state. It’s "conditional" because it depends on the probabilities of the different states the model is in at a given time. This connects back to the posterior probability, which assigns a probability to the model being in a particular state at a given time.
Conditional Standard Deviation Bands
The conditional standard deviation is a measure of the variability of the observed data given the current state of the model. In a Gaussian HMM, each state has its own emission probability, defined by a Gaussian distribution with a specific mean and standard deviation. The standard deviation represents how spread out the data is around the mean for each state. These bands directly relate to the emission probabilities of the HMM, as they describe the likelihood of the observed values given the current state. Narrow bands suggest a lower standard deviation, indicating the model is more confident about the data's expected range when in that state, while wider bands indicate higher uncertainty and variability.
Transition Matrix
The transition matrix in a HMM is a key component that characterizes the model. It's a square matrix representing the probabilities of transitioning from one hidden state to another. Each row of the transition matrix must sum up to 1 since the probabilities of moving from a given state to all possible subsequent states (including staying in the same state) must encompass all possible outcomes.
For example, we can see the following transition probabilities in our model:
Going from state X: to X (0.98), to Y (0.02), to Z (0)
Going from state Y: to X (0.03), to Y (0.96), to Z (0.01)
Going from state Z: to X (0), to Y (0.11), to Z (0.89)
MODEL TEST
When the "Test Out of Sample” option is enabled, the indicator plots models out-of-sample predictions. This is particularly useful for real-time identification of market regimes, ensuring that the model's predictive capability is rigorously tested on unseen data. The indicator displays the out of sample posterior probabilities which are calculated using the forward algorithm. Higher probability for a particular state indicate that the model is predicted a higher likelihood that the market is currently in that state. Evaluating the models performance on unseen data is crucial in understanding how well the model explains data that are not included in its training process.

Fast Autocorrelation Estimator█ Overview:
The Fast ACF and PACF Estimation indicator efficiently calculates the autocorrelation function (ACF) and partial autocorrelation function (PACF) using an online implementation. It helps traders identify patterns and relationships in financial time series data, enabling them to optimize their trading strategies and make better-informed decisions in the markets.
█ Concepts:
Autocorrelation, also known as serial correlation, is the correlation of a signal with a delayed copy of itself as a function of delay.
This indicator displays autocorrelation based on lag number. The autocorrelation is not displayed based over time on the x-axis. It's based on the lag number which ranges from 1 to 30. The calculations can be done with "Log Returns", "Absolute Log Returns" or "Original Source" (the price of the asset displayed on the chart).
When calculating autocorrelation, the resulting value will range from +1 to -1, in line with the traditional correlation statistic. An autocorrelation of +1 represents a perfect correlation (an increase seen in one time series leads to a proportionate increase in the other time series). An autocorrelation of -1, on the other hand, represents a perfect inverse correlation (an increase seen in one time series results in a proportionate decrease in the other time series). Lag number indicates which historical data point is autocorrelated. For example, if lag 3 shows significant autocorrelation, it means current data is influenced by the data three bars ago.
The Fast Online Estimation of ACF and PACF Indicator is a powerful tool for analyzing the linear relationship between a time series and its lagged values in TradingView. The indicator implements an online estimation of the Autocorrelation Function (ACF) and the Partial Autocorrelation Function (PACF) up to 30 lags, providing a real-time assessment of the underlying dependencies in your time series data. The Autocorrelation Function (ACF) measures the linear relationship between a time series and its lagged values, capturing both direct and indirect dependencies. The Partial Autocorrelation Function (PACF) isolates the direct dependency between the time series and a specific lag while removing the effect of any indirect dependencies.
This distinction is crucial in understanding the underlying relationships in time series data and making more informed decisions based on those relationships. For example, let's consider a time series with three variables: A, B, and C. Suppose that A has a direct relationship with B, B has a direct relationship with C, but A and C do not have a direct relationship. The ACF between A and C will capture the indirect relationship between them through B, while the PACF will show no significant relationship between A and C, as it accounts for the indirect dependency through B. Meaning that when ACF is significant at for lag 5, the dependency detected could be caused by an observation that came in between, and PACF accounts for that. This indicator leverages the Fast Moments algorithm to efficiently calculate autocorrelations, making it ideal for analyzing large datasets or real-time data streams. By using the Fast Moments algorithm, the indicator can quickly update ACF and PACF values as new data points arrive, reducing the computational load and ensuring timely analysis. The PACF is derived from the ACF using the Durbin-Levinson algorithm, which helps in isolating the direct dependency between a time series and its lagged values, excluding the influence of other intermediate lags.
█ How to Use the Indicator:
Interpreting autocorrelation values can provide valuable insights into the market behavior and potential trading strategies.
When applying autocorrelation to log returns, and a specific lag shows a high positive autocorrelation, it suggests that the time series tends to move in the same direction over that lag period. In this case, a trader might consider using a momentum-based strategy to capitalize on the continuation of the current trend. On the other hand, if a specific lag shows a high negative autocorrelation, it indicates that the time series tends to reverse its direction over that lag period. In this situation, a trader might consider using a mean-reversion strategy to take advantage of the expected reversal in the market.
ACF of log returns:
Absolute returns are often used to as a measure of volatility. There is usually significant positive autocorrelation in absolute returns. We will often see an exponential decay of autocorrelation in volatility. This means that current volatility is dependent on historical volatility and the effect slowly dies off as the lag increases. This effect shows the property of "volatility clustering". Which means large changes tend to be followed by large changes, of either sign, and small changes tend to be followed by small changes.
ACF of absolute log returns:
Autocorrelation in price is always significantly positive and has an exponential decay. This predictably positive and relatively large value makes the autocorrelation of price (not returns) generally less useful.
ACF of price:
█ Significance:
The significance of a correlation metric tells us whether we should pay attention to it. In this script, we use 95% confidence interval bands that adjust to the size of the sample. If the observed correlation at a specific lag falls within the confidence interval, we consider it not significant and the data to be random or IID (identically and independently distributed). This means that we can't confidently say that the correlation reflects a real relationship, rather than just random chance. However, if the correlation is outside of the confidence interval, we can state with 95% confidence that there is an association between the lagged values. In other words, the correlation is likely to reflect a meaningful relationship between the variables, rather than a coincidence. A significant difference in either ACF or PACF can provide insights into the underlying structure of the time series data and suggest potential strategies for traders. By understanding these complex patterns, traders can better tailor their strategies to capitalize on the observed dependencies in the data, which can lead to improved decision-making in the financial markets.
Significant ACF but not significant PACF: This might indicate the presence of a moving average (MA) component in the time series. A moving average component is a pattern where the current value of the time series is influenced by a weighted average of past values. In this case, the ACF would show significant correlations over several lags, while the PACF would show significance only at the first few lags and then quickly decay.
Significant PACF but not significant ACF: This might indicate the presence of an autoregressive (AR) component in the time series. An autoregressive component is a pattern where the current value of the time series is influenced by a linear combination of past values at specific lags.
Often we find both significant ACF and PACF, in that scenario simply and AR or MA model might not be sufficient and a more complex model such as ARMA or ARIMA can be used.
█ Features:
Source selection: User can choose either 'Log Returns' , 'Absolute Returns' or 'Original Source' for the input data.
Autocorrelation Selection: User can choose either 'ACF' or 'PACF' for the plot selection.
Plot Selection: User can choose either 'Autocorrelarrogram' or 'Historical Autocorrelation' for plotting the historical autocorrelation at a specified lag.
Max Lag: User can select the maximum number of lags to plot.
Precision: User can set the number of decimal points to display in the plot.

Expected Move BandsExpected move is the amount that an asset is predicted to increase or decrease from its current price, based on the current levels of volatility.
In this model, we assume asset price follows a log-normal distribution and the log return follows a normal distribution.
Note: Normal distribution is just an assumption, it's not the real distribution of return
Settings:
"Estimation Period Selection" is for selecting the period we want to construct the prediction interval.
For "Current Bar", the interval is calculated based on the data of the previous bar close. Therefore changes in the current price will have little effect on the range. What current bar means is that the estimated range is for when this bar close. E.g., If the Timeframe on 4 hours and 1 hour has passed, the interval is for how much time this bar has left, in this case, 3 hours.
For "Future Bars", the interval is calculated based on the current close. Therefore the range will be very much affected by the change in the current price. If the current price moves up, the range will also move up, vice versa. Future Bars is estimating the range for the period at least one bar ahead.
There are also other source selections based on high low.
Time setting is used when "Future Bars" is chosen for the period. The value in time means how many bars ahead of the current bar the range is estimating. When time = 1, it means the interval is constructing for 1 bar head. E.g., If the timeframe is on 4 hours, then it's estimating the next 4 hours range no matter how much time has passed in the current bar.
Note: It's probably better to use "probability cone" for visual presentation when time > 1
Volatility Models :
Sample SD: traditional sample standard deviation, most commonly used, use (n-1) period to adjust the bias
Parkinson: Uses High/ Low to estimate volatility, assumes continuous no gap, zero mean no drift, 5 times more efficient than Close to Close
Garman Klass: Uses OHLC volatility, zero drift, no jumps, about 7 times more efficient
Yangzhang Garman Klass Extension: Added jump calculation in Garman Klass, has the same value as Garman Klass on markets with no gaps.
about 8 x efficient
Rogers: Uses OHLC, Assume non-zero mean volatility, handles drift, does not handle jump 8 x efficient
EWMA: Exponentially Weighted Volatility. Weight recently volatility more, more reactive volatility better in taking account of volatility autocorrelation and cluster.
YangZhang: Uses OHLC, combines Rogers and Garmand Klass, handles both drift and jump, 14 times efficient, alpha is the constant to weight rogers volatility to minimize variance.
Median absolute deviation: It's a more direct way of measuring volatility. It measures volatility without using Standard deviation. The MAD used here is adjusted to be an unbiased estimator.
Volatility Period is the sample size for variance estimation. A longer period makes the estimation range more stable less reactive to recent price. Distribution is more significant on a larger sample size. A short period makes the range more responsive to recent price. Might be better for high volatility clusters.
Standard deviations:
Standard Deviation One shows the estimated range where the closing price will be about 68% of the time.
Standard Deviation two shows the estimated range where the closing price will be about 95% of the time.
Standard Deviation three shows the estimated range where the closing price will be about 99.7% of the time.
Note: All these probabilities are based on the normal distribution assumption for returns. It's the estimated probability, not the actual probability.
Manually Entered Standard Deviation shows the range of any entered standard deviation. The probability of that range will be presented on the panel.
People usually assume the mean of returns to be zero. To be more accurate, we can consider the drift in price from calculating the geometric mean of returns. Drift happens in the long run, so short lookback periods are not recommended. Assuming zero mean is recommended when time is not greater than 1.
When we are estimating the future range for time > 1, we typically assume constant volatility and the returns to be independent and identically distributed. We scale the volatility in term of time to get future range. However, when there's autocorrelation in returns( when returns are not independent), the assumption fails to take account of this effect. Volatility scaled with autocorrelation is required when returns are not iid. We use an AR(1) model to scale the first-order autocorrelation to adjust the effect. Returns typically don't have significant autocorrelation. Adjustment for autocorrelation is not usually needed. A long length is recommended in Autocorrelation calculation.
Note: The significance of autocorrelation can be checked on an ACF indicator.
ACF
The multimeframe option enables people to use higher period expected move on the lower time frame. People should only use time frame higher than the current time frame for the input. An error warning will appear when input Tf is lower. The input format is multiplier * time unit. E.g. : 1D
Unit: M for months, W for Weeks, D for Days, integers with no unit for minutes (E.g. 240 = 240 minutes). S for Seconds.
Smoothing option is using a filter to smooth out the range. The filter used here is John Ehler's supersmoother. It's an advance smoothing technique that gets rid of aliasing noise. It affects is similar to a simple moving average with half the lookback length but smoother and has less lag.
Note: The range here after smooth no long represent the probability
Panel positions can be adjusted in the settings.
X position adjusts the horizontal position of the panel. Higher X moves panel to the right and lower X moves panel to the left.
Y position adjusts the vertical position of the panel. Higher Y moves panel up and lower Y moves panel down.
Step line display changes the style of the bands from line to step line. Step line is recommended because it gets rid of the directional bias of slope of expected move when displaying the bands.
Warnings:
People should not blindly trust the probability. They should be aware of the risk evolves by using the normal distribution assumption. The real return has skewness and high kurtosis. While skewness is not very significant, the high kurtosis should be noticed. The Real returns have much fatter tails than the normal distribution, which also makes the peak higher. This property makes the tail ranges such as range more than 2SD highly underestimate the actual range and the body such as 1 SD slightly overestimate the actual range. For ranges more than 2SD, people shouldn't trust them. They should beware of extreme events in the tails.
Different volatility models provide different properties if people are interested in the accuracy and the fit of expected move, they can try expected move occurrence indicator. (The result also demonstrate the previous point about the drawback of using normal distribution assumption).
Expected move Occurrence Test
The prediction interval is only for the closing price, not wicks. It only estimates the probability of the price closing at this level, not in between. E.g., If 1 SD range is 100 - 200, the price can go to 80 or 230 intrabar, but if the bar close within 100 - 200 in the end. It's still considered a 68% one standard deviation move.

ES-VIX Expected Move - Open basedES-VIX Daily Price Bands
This indicator plots dynamic intraday price bands for ES futures based on real-time volatility levels measured by the VIX (CBOE Volatility Index). The bands evolve throughout the trading day, providing volatility-adjusted price targets.
Formulas:
Upper Band = Daily Open + (ES Price × VIX ÷ √252 ÷ 100)
Lower Band = Daily Open - (ES Price × VIX ÷ √252 ÷ 100)
The calculation uses the square root of 252 (trading days per year) to convert annualized VIX volatility into an expected daily move, then scales it as a percentage adjustment from the current day's open.
Features:
Real-time band calculation that updates throughout the trading session
Upper band (green) extends from the current day's open
Lower band (red) contracts from the current day's open
Inner upper band (green) at 50% of expected move
Inner lower band (red) at 50% of expected move
Middle Inner upper band (green) at 80% of expected move
Middle Inner lower band (red) at 80% of expected move
Information table displaying:
Current ES price and VIX level
Daily Open
Expected move

️Omega RatioThe Omega Ratio is a risk-return performance measure of an investment asset, portfolio, or strategy. It is defined as the probability-weighted ratio, of gains versus losses for some threshold return target. The ratio is an alternative for the widely used Sharpe ratio and is based on information the Sharpe ratio discards.
█ OVERVIEW
As we have mentioned many times, stock market returns are usually not normally distributed. Therefore the models that assume a normal distribution of returns may provide us with misleading information. The Omega Ratio improves upon the common normality assumption among other risk-return ratios by taking into account the distribution as a whole.
█ CONCEPTS
Two distributions with the same mean and variance, would according to the most commonly used Sharpe Ratio suggest that the underlying assets of the distribution offer the same risk-return ratio. But as we have mentioned in our Moments indicator, variance and standard deviation are not a sufficient measure of risk in the stock market since other shape features of a distribution like skewness and excess kurtosis come into play. Omega Ratio tackles this problem by employing all four Moments of the distribution and therefore taking into account the differences in the shape features of the distributions. Another important feature of the Omega Ratio is that it does not require any estimation but is rather calculated directly from the observed data. This gives it an advantage over standard statistical estimators that require estimation of parameters and are therefore sampling uncertainty in its calculations.
█ WAYS TO USE THIS INDICATOR
Omega calculates a probability-adjusted ratio of gains to losses, relative to the Minimum Acceptable Return (MAR). This means that at a given MAR using the simple rule of preferring more to less, an asset with a higher value of Omega is preferable to one with a lower value. The indicator displays the values of Omega at increasing levels of MARs and creating the so-called Omega Curve. Knowing this one can compare Omega Curves of different assets and decide which is preferable given the MAR of your strategy. The indicator plots two Omega Curves. One for the on chart symbol and another for the off chart symbol that u can use for comparison.
When comparing curves of different assets make sure their trading days are the same in order to ensure the same period for the Omega calculations. Value interpretation: Omega<1 will indicate that the risk outweighs the reward and therefore there are more excess negative returns than positive. Omega>1 will indicate that the reward outweighs the risk and that there are more excess positive returns than negative. Omega=1 will indicate that the minimum acceptable return equals the mean return of an asset. And that the probability of gain is equal to the probability of loss.
█ FEATURES
• "Low-Risk security" lets you select the security that you want to use as a benchmark for Omega calculations.
• "Omega Period" is the size of the sample that is used for the calculations.
• “Increments” is the number of Minimal Acceptable Return levels the calculation is carried on. • “Other Symbol” lets you select the source of the second curve.
• “Color Settings” you can set the color for each curve.

Linear Moments█ OVERVIEW
The Linear Moments indicator, also known as L-moments, is a statistical tool used to estimate the properties of a probability distribution. It is an alternative to conventional moments and is more robust to outliers and extreme values.
█ CONCEPTS
█ Four moments of a distribution
We have mentioned the concept of the Moments of a distribution in one of our previous posts. The method of Linear Moments allows us to calculate more robust measures that describe the shape features of a distribution and are anallougous to those of conventional moments. L-moments therefore provide estimates of the location, scale, skewness, and kurtosis of a probability distribution.
The first L-moment, λ₁, is equivalent to the sample mean and represents the location of the distribution. The second L-moment, λ₂, is a measure of the dispersion of the distribution, similar to the sample standard deviation. The third and fourth L-moments, λ₃ and λ₄, respectively, are the measures of skewness and kurtosis of the distribution. Higher order L-moments can also be calculated to provide more detailed information about the shape of the distribution.
One advantage of using L-moments over conventional moments is that they are less affected by outliers and extreme values. This is because L-moments are based on order statistics, which are more resistant to the influence of outliers. By contrast, conventional moments are based on the deviations of each data point from the sample mean, and outliers can have a disproportionate effect on these deviations, leading to skewed or biased estimates of the distribution parameters.
█ Order Statistics
L-moments are statistical measures that are based on linear combinations of order statistics, which are the sorted values in a dataset. This approach makes L-moments more resistant to the influence of outliers and extreme values. However, the computation of L-moments requires sorting the order statistics, which can lead to a higher computational complexity.
To address this issue, we have implemented an Online Sorting Algorithm that efficiently obtains the sorted dataset of order statistics, reducing the time complexity of the indicator. The Online Sorting Algorithm is an efficient method for sorting large datasets that can be updated incrementally, making it well-suited for use in trading applications where data is often streamed in real-time. By using this algorithm to compute L-moments, we can obtain robust estimates of distribution parameters while minimizing the computational resources required.
█ Bias and efficiency of an estimator
One of the key advantages of L-moments over conventional moments is that they approach their asymptotic normal closer than conventional moments. This means that as the sample size increases, the L-moments provide more accurate estimates of the distribution parameters.
Asymptotic normality is a statistical property that describes the behavior of an estimator as the sample size increases. As the sample size gets larger, the distribution of the estimator approaches a normal distribution, which is a bell-shaped curve. The mean and variance of the estimator are also related to the true mean and variance of the population, and these relationships become more accurate as the sample size increases.
The concept of asymptotic normality is important because it allows us to make inferences about the population based on the properties of the sample. If an estimator is asymptotically normal, we can use the properties of the normal distribution to calculate the probability of observing a particular value of the estimator, given the sample size and other relevant parameters.
In the case of L-moments, the fact that they approach their asymptotic normal more closely than conventional moments means that they provide more accurate estimates of the distribution parameters as the sample size increases. This is especially useful in situations where the sample size is small, such as when working with financial data. By using L-moments to estimate the properties of a distribution, traders can make more informed decisions about their investments and manage their risk more effectively.
Below we can see the empirical dsitributions of the Variance and L-scale estimators. We ran 10000 simulations with a sample size of 100. Here we can clearly see how the L-moment estimator approaches the normal distribution more closely and how such an estimator can be more representative of the underlying population.
█ WAYS TO USE THIS INDICATOR
The Linear Moments indicator can be used to estimate the L-moments of a dataset and provide insights into the underlying probability distribution. By analyzing the L-moments, traders can make inferences about the shape of the distribution, such as whether it is symmetric or skewed, and the degree of its spread and peakedness. This information can be useful in predicting future market movements and developing trading strategies.
One can also compare the L-moments of the dataset at hand with the L-moments of certain commonly used probability distributions. Finance is especially known for the use of certain fat tailed distributions such as Laplace or Student-t. We have built in the theoretical values of L-kurtosis for certain common distributions. In this way a person can compare our observed L-kurtosis with the one of the selected theoretical distribution.
█ FEATURES
Source Settings
Source - Select the source you wish the indicator to calculate on
Source Selection - Selec whether you wish to calculate on the source value or its log return
Moments Settings
Moments Selection - Select the L-moment you wish to be displayed
Lookback - Determine the sample size you wish the L-moments to be calculated with
Theoretical Distribution - This setting is only for investingating the kurtosis of our dataset. One can compare our observed kurtosis with the kurtosis of a selected theoretical distribution.

Historical Volatility EstimatorsHistorical volatility is a statistical measure of the dispersion of returns for a given security or market index over a given period. This indicator provides different historical volatility model estimators with percentile gradient coloring and volatility stats panel.
█ OVERVIEW There are multiple ways to estimate historical volatility. Other than the traditional close-to-close estimator. This indicator provides different range-based volatility estimators that take high low open into account for volatility calculation and volatility estimators that use other statistics measurements instead of standard deviation. The gradient coloring and stats panel provides an overview of how high or low the current volatility is compared to its historical values.
█ CONCEPTS We have mentioned the concepts of historical volatility in our previous indicators, Historical Volatility, Historical Volatility Rank, and Historical Volatility Percentile. You can check the definition of these scripts. The basic calculation is just the sample standard deviation of log return scaled with the square root of time. The main focus of this script is the difference between volatility models.
Close-to-Close HV Estimator: Close-to-Close is the traditional historical volatility calculation. It uses sample standard deviation. Note: the TradingView build in historical volatility value is a bit off because it uses population standard deviation instead of sample deviation. N – 1 should be used here to get rid of the sampling bias.
Pros:
• Close-to-Close HV estimators are the most commonly used estimators in finance. The calculation is straightforward and easy to understand. When people reference historical volatility, most of the time they are talking about the close to close estimator.
Cons:
• The Close-to-close estimator only calculates volatility based on the closing price. It does not take account into intraday volatility drift such as high, low. It also does not take account into the jump when open and close prices are not the same.
• Close-to-Close weights past volatility equally during the lookback period, while there are other ways to weight the historical data.
• Close-to-Close is calculated based on standard deviation so it is vulnerable to returns that are not normally distributed and have fat tails. Mean and Median absolute deviation makes the historical volatility more stable with extreme values.
Parkinson Hv Estimator:
• Parkinson was one of the first to come up with improvements to historical volatility calculation. • Parkinson suggests using the High and Low of each bar can represent volatility better as it takes into account intraday volatility. So Parkinson HV is also known as Parkinson High Low HV. • It is about 5.2 times more efficient than Close-to-Close estimator. But it does not take account into jumps and drift. Therefore, it underestimates volatility. Note: By Dividing the Parkinson Volatility by Close-to-Close volatility you can get a similar result to Variance Ratio Test. It is called the Parkinson number. It can be used to test if the market follows a random walk. (It is mentioned in Nassim Taleb's Dynamic Hedging book but it seems like he made a mistake and wrote the ratio wrongly.)
Garman-Klass Estimator:
• Garman Klass expanded on Parkinson’s Estimator. Instead of Parkinson’s estimator using high and low, Garman Klass’s method uses open, close, high, and low to find the minimum variance method.
• The estimator is about 7.4 more efficient than the traditional estimator. But like Parkinson HV, it ignores jumps and drifts. Therefore, it underestimates volatility.
Rogers-Satchell Estimator:
• Rogers and Satchell found some drawbacks in Garman-Klass’s estimator. The Garman-Klass assumes price as Brownian motion with zero drift.
• The Rogers Satchell Estimator calculates based on open, close, high, and low. And it can also handle drift in the financial series.
• Rogers-Satchell HV is more efficient than Garman-Klass HV when there’s drift in the data. However, it is a little bit less efficient when drift is zero. The estimator doesn’t handle jumps, therefore it still underestimates volatility.
Garman-Klass Yang-Zhang extension:
• Yang Zhang expanded Garman Klass HV so that it can handle jumps. However, unlike the Rogers-Satchell estimator, this estimator cannot handle drift. It is about 8 times more efficient than the traditional estimator.
• The Garman-Klass Yang-Zhang extension HV has the same value as Garman-Klass when there’s no gap in the data such as in cryptocurrencies.
Yang-Zhang Estimator:
• The Yang Zhang Estimator combines Garman-Klass and Rogers-Satchell Estimator so that it is based on Open, close, high, and low and it can also handle non-zero drift. It also expands the calculation so that the estimator can also handle overnight jumps in the data.
• This estimator is the most powerful estimator among the range-based estimators. It has the minimum variance error among them, and it is 14 times more efficient than the close-to-close estimator. When the overnight and daily volatility are correlated, it might underestimate volatility a little.
• 1.34 is the optimal value for alpha according to their paper. The alpha constant in the calculation can be adjusted in the settings. Note: There are already some volatility estimators coded on TradingView. Some of them are right, some of them are wrong. But for Yang Zhang Estimator I have not seen a correct version on TV.
EWMA Estimator:
• EWMA stands for Exponentially Weighted Moving Average. The Close-to-Close and all other estimators here are all equally weighted.
• EWMA weighs more recent volatility more and older volatility less. The benefit of this is that volatility is usually autocorrelated. The autocorrelation has close to exponential decay as you can see using an Autocorrelation Function indicator on absolute or squared returns. The autocorrelation causes volatility clustering which values the recent volatility more. Therefore, exponentially weighted volatility can suit the property of volatility well.
• RiskMetrics uses 0.94 for lambda which equals 30 lookback period. In this indicator Lambda is coded to adjust with the lookback. It's also easy for EWMA to forecast one period volatility ahead.
• However, EWMA volatility is not often used because there are better options to weight volatility such as ARCH and GARCH.
Adjusted Mean Absolute Deviation Estimator:
• This estimator does not use standard deviation to calculate volatility. It uses the distance log return is from its moving average as volatility.
• It’s a simple way to calculate volatility and it’s effective. The difference is the estimator does not have to square the log returns to get the volatility. The paper suggests this estimator has more predictive power.
• The mean absolute deviation here is adjusted to get rid of the bias. It scales the value so that it can be comparable to the other historical volatility estimators.
• In Nassim Taleb’s paper, he mentions people sometimes confuse MAD with standard deviation for volatility measurements. And he suggests people use mean absolute deviation instead of standard deviation when we talk about volatility.
Adjusted Median Absolute Deviation Estimator:
• This is another estimator that does not use standard deviation to measure volatility.
• Using the median gives a more robust estimator when there are extreme values in the returns. It works better in fat-tailed distribution.
• The median absolute deviation is adjusted by maximum likelihood estimation so that its value is scaled to be comparable to other volatility estimators.
█ FEATURES
• You can select the volatility estimator models in the Volatility Model input
• Historical Volatility is annualized. You can type in the numbers of trading days in a year in the Annual input based on the asset you are trading.
• Alpha is used to adjust the Yang Zhang volatility estimator value.
• Percentile Length is used to Adjust Percentile coloring lookbacks.
• The gradient coloring will be based on the percentile value (0- 100). The higher the percentile value, the warmer the color will be, which indicates high volatility. The lower the percentile value, the colder the color will be, which indicates low volatility.
• When percentile coloring is off, it won’t show the gradient color.
• You can also use invert color to make the high volatility a cold color and a low volatility high color. Volatility has some mean reversion properties. Therefore when volatility is very low, and color is close to aqua, you would expect it to expand soon. When volatility is very high, and close to red, you would it expect it to contract and cool down.
• When the background signal is on, it gives a signal when HVP is very low. Warning there might be a volatility expansion soon.
• You can choose the plot style, such as lines, columns, areas in the plotstyle input.
• When the show information panel is on, a small panel will display on the right.
• The information panel displays the historical volatility model name, the 50th percentile of HV, and HV percentile. 50 the percentile of HV also means the median of HV. You can compare the value with the current HV value to see how much it is above or below so that you can get an idea of how high or low HV is. HV Percentile value is from 0 to 100. It tells us the percentage of periods over the entire lookback that historical volatility traded below the current level. Higher HVP, higher HV compared to its historical data. The gradient color is also based on this value.
█ HOW TO USE If you haven’t used the hvp indicator, we suggest you use the HVP indicator first. This indicator is more like historical volatility with HVP coloring. So it displays HVP values in the color and panel, but it’s not range bound like the HVP and it displays HV values. The user can have a quick understanding of how high or low the current volatility is compared to its historical value based on the gradient color. They can also time the market better based on volatility mean reversion. High volatility means volatility contracts soon (Move about to End, Market will cooldown), low volatility means volatility expansion soon (Market About to Move).
█ FINAL THOUGHTS HV vs ATR The above volatility estimator concepts are a display of history in the quantitative finance realm of the research of historical volatility estimations. It's a timeline of range based from the Parkinson Volatility to Yang Zhang volatility. We hope these descriptions make more people know that even though ATR is the most popular volatility indicator in technical analysis, it's not the best estimator. Almost no one in quant finance uses ATR to measure volatility (otherwise these papers will be based on how to improve ATR measurements instead of HV). As you can see, there are much more advanced volatility estimators that also take account into open, close, high, and low. HV values are based on log returns with some calculation adjustment. It can also be scaled in terms of price just like ATR. And for profit-taking ranges, ATR is not based on probabilities. Historical volatility can be used in a probability distribution function to calculated the probability of the ranges such as the Expected Move indicator. Other Estimators There are also other more advanced historical volatility estimators. There are high frequency sampled HV that uses intraday data to calculate volatility. We will publish the high frequency volatility estimator in the future. There's also ARCH and GARCH models that takes volatility clustering into account. GARCH models require maximum likelihood estimation which needs a solver to find the best weights for each component. This is currently not possible on TV due to large computational power requirements. All the other indicators claims to be GARCH are all wrong.

Relative Strength Heatmap [BackQuant]Relative Strength Heatmap
A multi-horizon RSI matrix that compresses 20 different lookbacks into a single panel, turning raw momentum into a visual “pressure gauge” for overbought and oversold clustering, trend exhaustion, and breadth of participation across time horizons.
What this is
This indicator builds a strip-style heatmap of 20 RSIs, each with a different length, and stacks them vertically as colored tiles in a single pane. Every tile is colored by its RSI value using your chosen palette, so you can see at a glance:
How many “fast” versus “slow” RSIs are overbought or oversold.
Whether momentum is concentrated in the short lookbacks or spread across the whole curve.
When momentum extremes cluster, signalling strong market pressure or exhaustion.
On top of the tiles, the script plots two simple breadth lines:
A white line that counts how many RSIs are above 70 (overbought cluster).
A black line that counts how many RSIs are below 30 (oversold cluster).
This turns a single symbol’s RSI ladder into a compact “market pressure gauge” that shows not only whether RSI is overbought or oversold, but how many different horizons agree at the same time.
Core idea
A single RSI looks at one length and one timescale. Markets, however, are driven by flows that operate on multiple horizons at once. By computing RSI over a ladder of lengths, you approximate a “term structure” of strength:
Short lengths react to immediate swings and very recent impulses.
Medium lengths reflect swing behaviour and local trends.
Long lengths reflect structural bias and higher timeframe regime.
When many lengths agree, for example 10 or more RSIs all above 70, it suggests broad participation and strong directional pressure. When only a few fast lengths stretch to extremes while longer ones stay neutral, the move is more fragile and more likely to mean-revert.
This script makes that structure visible as a heatmap instead of forcing you to run many separate RSI panes.
How it works
1) Generating RSI lengths
You control three parameters in the calculation settings:
RS Period – the base RSI length used for the shortest strip.
RSI Step – the amount added to each successive RSI length.
RSI Multiplier – a global scaling factor applied after the step.
Each of the 20 RSIs uses:
RSI length = round((base_length + step × index) × multiplier) , where the index goes from 0 to 19.
That means:
RSI 1 uses (len + step × 0) × mult.
RSI 2 uses (len + step × 1) × mult.
…
RSI 20 uses (len + step × 19) × mult.
You can keep the ladder dense (small step and multiplier) or stretch it across much longer horizons.
2) Heatmap layout and grouping
Each RSI is plotted as an “area” strip at a fixed vertical level using histbase to stack them:
RSI 1–5 form Group 1.
RSI 6–10 form Group 2.
RSI 11–15 form Group 3.
RSI 16–20 form Group 4.
Each group has a toggle:
Show only Group 1 and 2 if you care mainly about fast and medium horizons.
Show all groups for a full spectrum from very short to very long.
Hide any group that feels redundant for your workflow.
The actual numeric RSI values are not plotted as lines. Instead, each strip is drawn as a horizontal band whose fill color represents the current RSI regime.
3) Palette-based coloring
Each tile’s color is driven by the RSI value and your chosen palette. The script includes several palettes:
Viridis – smooth green to yellow, good for subtle reading.
Jet – strong blue to red sequence with high contrast.
Plasma – purple through orange to yellow.
Custom Heat – cool blues to neutral grey to hot reds.
Gray – grayscale from white to black for minimalistic layouts.
Cividis, Inferno, Magma, Turbo, Rainbow – additional scientific and rainbow-style maps.
Internally, RSI values are bucketed into ranges (for example, below 10, 10–20, …, 90–100). Each bucket maps to a unique colour for that palette. In all schemes, low RSI values are mapped to the “cold” or darker side and high RSI values to the “hot” or brighter side.
The result is a true momentum heatmap:
Cold or dark tiles show low RSI and oversold or compressed conditions.
Mid tones show neutral or mid-range RSI.
Warm or bright tiles show high RSI and overbought or stretched conditions.
4) Bull and bear breadth counts
All 20 RSI values are collected into an array each bar. Two counters are then calculated:
Bull count – how many RSIs are above 70.
Bear count – how many RSIs are below 30.
These are plotted as:
A white line (“RSI > 70 Count”) for the overbought cluster.
A black line (“RSI < 30 Count”) for the oversold cluster.
If you enable the “Show Bull and Bear Count” option, you get an immediate reading of how many of the 20 horizons are stretched at any moment.
5) Cluster alerts and background tagging
Two alert conditions monitor “strong cluster” regimes:
RSI Heatmap Strong Bull – triggers when at least 10 RSIs are above 70.
RSI Heatmap Strong Bear – triggers when at least 10 RSIs are below 30.
When one of these conditions is true, the indicator can tint the background of the chart using a soft version of the current palette. This visually marks stretches where momentum is extreme across many lengths at once, not just on a single RSI.
What it plots
In one oscillator window, the indicator provides:
Up to 20 horizontal RSI strips, each representing a different RSI length.
Color-coded tiles reflecting the current RSI value for each length.
Group toggles to show or hide each block of five RSIs.
An optional white line that counts how many RSIs are above 70.
An optional black line that counts how many RSIs are below 30.
Optional background highlights when the number of overbought or oversold RSIs passes the strong-cluster threshold.
How it measures breadth and pressure
Single-symbol breadth
Breadth is usually defined across a basket of symbols, such as how many stocks advance versus decline. This indicator uses the same concept across time horizons for a single symbol. The question becomes:
“How many different RSI lengths are stretched in the same direction at once?”
Examples:
If only 2 or 3 of the shortest RSIs are above 70, bull count stays low. The move is fast and local, but not yet broadly supported.
If 12 or more RSIs across short, medium and long lengths are above 70, the bull count spikes. The move has broad momentum and strong upside pressure.
If 10 or more RSIs are below 30, bear count spikes and you are in a broad oversold regime.
This is breadth of momentum within one market.
Market pressure gauge
The combination of heatmap tiles and breadth lines acts as a pressure gauge:
High bull count with warm colors across most strips indicates strong upside pressure and crowded long positioning.
High bear count with cold colors across most strips indicates strong downside pressure and capitulation or forced selling.
Low counts with a mixed heatmap indicate neutral pressure, fragmented flows, or range-bound conditions.
You can treat the strong-cluster alerts as “extreme pressure” signals. When they fire, the market is heavily skewed in one direction across many horizons.
How to read the heatmap
Horizontal patterns (through time)
Look along the time axis and watch how the colors evolve:
Persistent hot tiles across many strips show sustained bullish pressure and trend strength.
Persistent cold tiles across many strips show sustained bearish pressure and weak demand.
Frequent flipping between hot and cold colours indicates a choppy or mean-reverting environment.
Vertical structure (across lengths at one bar)
Focus on a single bar and read the column of tiles from top to bottom:
Short RSIs hot, long RSIs neutral or cool: early trend or short-term fomo. Price has moved fast, longer horizons have not caught up.
Short and long RSIs all hot: mature, entrenched uptrend. Broad participation, high pressure, greater risk of blow-off or late-entry vulnerability.
Short RSIs cold but long RSIs mid to high: pullback in a higher timeframe uptrend. Dip-buy and continuation setups are often found here.
Short RSIs high but long RSIs low: countertrend rallies within a broader downtrend. Good hunting ground for fades and short entries after a bounce.
Bull and bear breadth lines
Use the two lines as simple, numeric breadth indicators:
A rising white line shows more RSIs pushing above 70, so bullish pressure is expanding in breadth.
A rising black line shows more RSIs pushing below 30, so bearish pressure is expanding in breadth.
When both lines are low and flat, few horizons are extreme and the market is in mid-range territory.
Cluster zones
When either count crosses the strong threshold (for example 10 out of 20 RSIs in extreme territory):
A strong bull cluster marks a broadly overbought regime. Trend followers may see this as confirmation. Mean-reversion traders may see it as a late-stage or blow-off context.
A strong bear cluster marks a broadly oversold regime. Downtrend traders see strong pressure, but the risk of sharp short-covering bounces also increases.
Trading applications
Trend confirmation
Use the heatmap and breadth lines as a trend filter:
Prefer long setups when the heatmap shows mostly mid to high RSIs and the bull count is rising.
Avoid fresh shorts when there is a strong bull cluster, unless you are specifically trading exhaustion.
Prefer short setups when the heatmap is mostly low RSIs and the bear count is rising.
Avoid aggressive longs when a strong bear cluster is active, unless you are trading reflexive bounces.
Mean-reversion timing
Treat cluster extremes as exhaustion zones:
Look for reversal patterns, failed breakouts, or order flow shifts when bull count is very high and price starts to stall or diverge.
Look for reflexive bounce potential when bear count is very high and price stops making new lows or shows absorption at the lows.
Use the palette and counts together: hot tiles plus a peaking white line can mark blow-off conditions, cold tiles plus a peaking black line can mark capitulation.
Regime detection and risk toggling
Use the overall shape of the ladder over time:
If upper strips stay warm and lower strips stay neutral or warm for extended periods, the market is in an uptrend regime. You can justify higher risk for long-biased strategies.
If upper strips stay cold and lower strips stay neutral or cold, the market is in a downtrend regime. You can justify higher risk for short-biased strategies or defensive positioning.
If colours and counts flip frequently, you are likely in a range or choppy regime. Consider reducing size or using more tactical, short-term strategies.
Multi-horizon synchronization
You can think of each RSI length as a proxy for a different “speed” of the same market:
When only fast RSIs are stretched, the move is local and less robust.
When fast, medium and slow RSIs align, the move has multi-horizon confirmation.
You can require a minimum bull or bear count before allowing your main strategy to engage.
Spotting hidden shifts
Sometimes price appears flat or drifting, but the heatmap quietly cools or warms:
If price is sideways while many hot tiles fade toward neutral, momentum is decaying under the surface and trend risk is increasing.
If price is sideways while many cold tiles climb back toward neutral, selling pressure is decaying and the tape is repairing itself.
Settings overview
Calculation Settings
RS Period – base RSI length for the shortest strip.
RSI Step – the increment added to each successive RSI length.
RSI Multiplier – scales all generated RSI lengths.
Calculation Source – the input series, such as close, hlc3 or others.
Plotting and Coloring Settings
Heatmap Color Palette – choose between Viridis, Jet, Plasma, Custom Heat, Gray, Cividis, Inferno, Magma, Turbo or Rainbow.
Show Group 1 – toggles RSI 1–5.
Show Group 2 – toggles RSI 6–10.
Show Group 3 – toggles RSI 11–15.
Show Group 4 – toggles RSI 16–20.
Show Bull and Bear Count – enables or disables the two breadth lines.
Alerts
RSI Heatmap Strong Bull – fires when the number of RSIs above 70 reaches or exceeds the configured threshold (default 10).
RSI Heatmap Strong Bear – fires when the number of RSIs below 30 reaches or exceeds the configured threshold (default 10).
Tuning guidance
Fast, tactical configurations
Use a small base RS Period, for example 2 to 5.
Use a small RSI Step, for tight clustering around the fast horizon.
Keep the multiplier near 1.0 to avoid extreme long lengths.
Focus on Group 1 and Group 2 for intraday and short-term trading.
Swing and position configurations
Use a mid-range RS Period, for example 7 to 14.
Use a moderate RSI Step to fan out into slower horizons.
Optionally use a multiplier slightly above 1.0.
Keep all four groups enabled for a full view from fast to slow.
Macro or higher timeframe configurations
Use a larger base RS Period.
Use a larger RSI Step so the top of the ladder reaches very slow lengths.
Focus on Group 3 and Group 4 to see structural momentum.
Treat clusters as regime markers rather than frequent trading signals.
Notes
This indicator is a contextual tool, not a standalone trading system. It does not model execution, spreads, slippage or fundamental drivers. Use it to:
Understand whether momentum is narrow or broad across horizons.
Confirm or filter existing signals from your primary strategy.
Identify environments where the market is crowded into one side.
Distinguish between isolated spikes and truly broad pressure moves.
The Relative Strength Heatmap is designed to answer a simple but powerful question:
“How many versions of RSI agree with what I am seeing on the chart?”
By compressing those answers into a single panel with clear colour coding and breadth lines, it becomes a practical, visual gauge of momentum breadth and market pressure that you can overlay on any trading framework.

MFM – Light Context HUD (Minimal)Overview
MFM Light Context HUD is the free version of the Market Framework Model. It gives you a fast and clean view of the current market regime and phase without signals or chart noise. The HUD shows whether the asset is in a bullish or bearish environment and whether it is in a volatile, compression, drift, or neutral phase. This helps you read structure at a glance.
Asset availability
The free version works only on a selected list of five assets.
Supported symbols are
SP:SPX
TVC:GOLD
BINANCE:BTCUSD
BINANCE:ETHUSDT
OANDA:EURUSD
All other assets show a context banner only.
How it works
The free version uses fixed settings based on the original MFM model. It calculates the regime using a higher timeframe RSI ratio and identifies the current phase using simplified momentum conditions. The chart stays clean. Only a small HUD appears in the top corner. Full visual phases, ratio logic, signals, and auto tune are part of the paid version.
The free version shows the phase name only. It does not display colored phase zones on the chart.
Phase meaning
The Market Framework Model uses four structural phases to describe how the market
behaves. These are not signals but context layers that show the underlying environment.
Volatile (Phase 1)
The market is in a fast, unstable or directional environment. Price can move aggressively with
stronger momentum swings.
Compression (Phase 2)
The market is in a contracting state. Momentum slows and volatility decreases. This phase
often appears before expansion, but it does not predict direction.
Drift (Phase 3)
The market moves in a more controlled, persistent manner. Trends are cleaner and volatility
is lower compared to volatile phases.
No phase
No clear structural condition is active.
These phases describe market structure, not trade entries. They help you understand the conditions you are trading in.
Cross asset context
The Market Framework Model reads markets as a multi layer system. The full version includes cross asset analysis to show whether the asset is acting as a leader or lagger relative to its benchmark. The free version uses the same internal benchmark logic for regime detection but does not display the cross asset layer on the chart.
Cross asset structure is a core part of the MFM model and is fully available in the paid version.
Included in this free version
Higher timeframe regime
Current phase name
Clean chart output
Context only
Works on a selected set of assets
Not included
No forecast signals
No ratio leader or lagger logic
No MRM zones
No MPF timing
No auto tune
The full version contains all features of the complete MFM model.
Full version
You can find the full indicator here:
payhip.com
More information
Model details and documentation:
mfm.inratios.com
Momentum Framework Model free HUD indicator User Guide: mfm.inratios.com
Disclaimer
The Market Framework Model (MFM) and all related materials are provided for educational and informational purposes only. Nothing in this publication, the indicator, or any associated charts should be interpreted as financial advice, investment recommendations, or trading signals. All examples, visualizations, and backtests are illustrative and based on historical data. They do not guarantee or imply any future performance. Financial markets involve risk, including the potential loss of capital, and users remain fully responsible for their own decisions. The author and Inratios© make no representations or warranties regarding the accuracy, completeness, or reliability of the information provided. MFM describes structural market context only and should not be used as the sole basis for trading or investment actions.
By using the MFM indicator or any related insights, you agree to these terms.
© 2025 Inratios. Market Framework Model (MFM) is protected via i-Depot (BOIP) – Ref. 155670. No financial advice.

Crypto Grail Crypto Grail — Advanced Multi-Factor Market Intelligence System
Crypto Grail is an institutional-grade multi-factor trading system designed to identify high-probability market conditions through structured trend analysis, volatility modeling, volume diagnostics and candle-level momentum evaluation. The tool operates as an adaptive decision framework that highlights only the most meaningful market alignments while filtering out low-quality noise.
Core Trend Architecture
Crypto Grail builds directional bias using a layered trend framework that integrates:
• EMA21, EMA50 and EMA200 structural mapping
• SuperTrend confirmation
• ADX trend-strength assessment
• EMA-spread evaluation for macro bias
This architecture allows Crypto Grail to distinguish impulsive directional movement from non-directional consolidation phases with high precision.
Quality Scoring Engine
Every potential long or short setup is processed through a quantitative scoring model that evaluates:
• Trend alignment across EMA structure
• SuperTrend directional confirmation
• ADX intensity
• RSI zone positioning
• Candle delta (close-location value)
• Volume deviation relative to baseline
• Volatility state (compressed / normal / explosive)
• Movement percentage vs recent history
• Impulse strength within the current bar
Only setups that satisfy the required quality threshold are eligible for display.
Volatility Regime Modeling
The system dynamically identifies volatility regimes by analyzing:
• ATR-based volatility gradient
• Recent movement amplitude
• Candle impulse relative to volatility envelope
• Expansion and compression cycles
• Chaotic transitions and unstable bursts
This allows the script to identify when the market environment supports sustained follow-through versus when conditions are structurally noisy.
Volume Deviation Framework
Crypto Grail evaluates volume behavior using a rolling baseline to detect:
• Genuine volume expansion
• Volume contraction
• Spike clusters
• Impulse confirmation with volume alignment
Volume states are incorporated directly into the quality-scoring engine, ensuring signals appear only when supported by underlying market participation.
Early & Hybrid Entry Logic
Two optional entry modes expand the system’s capability during dynamic phases:
• Early Mode: identifies strong impulse shifts confirmed by volume + delta
• Hybrid Mode: merges early detection with trend-filtered confirmation
These modes enable more aggressive entries without compromising structural integrity.
Sideways Market Filter
The system includes a consolidation-detection layer that restricts signal generation during:
• Flat ranges
• Low-energy volatility clusters
• ADX-weak trend environments
• EMA compression zones
This significantly increases average signal reliability.
Integrated Trade Simulation Engine
Crypto Grail includes a full visual trade-simulation module featuring:
• ATR-based dynamic stop loss
• Risk-to-reward take profit engine
• Optional ATR trailing stop
• Trade cooldown control
• Complete entry/exit marking
• SL/TP visualization
• Automatic exit-reason tagging
This makes each signal structurally transparent and easy to analyze.
Market Condition Panel
A real-time performance and condition dashboard displays:
• Total trades
• Wins and losses
• Long/short distribution
• Early-entry analytics
• Volume regime
• Volatility regime
• Trend condition
• Current directional bias
This provides ongoing contextual insight during live market conditions.
System Purpose
Crypto Grail is designed as a professional decision-support system that isolates high-probability market structures through multi-layer technical validation. The tool does not guarantee results and should be used with proper risk management.

[CT] Donchian Histogram w/Candle ColorsDonchian Histogram, originally created by RafaelZioni and enhanced with optional price bar coloring, is a momentum-style oscillator that shows where the current close sits inside a dynamic Donchian channel and how that position is evolving over time. The script calculates a rolling high and low over a multi-session lookback period based on your chosen Donchian timeframe, then normalizes the close within that range to create a percentage position between the recent high and low. This normalized value is smoothed with a signal length and plotted as a histogram around a zero line, making it easy to see whether price is pressing toward the upper side of its recent range, the lower side, or oscillating near the middle. Positive values indicate that price is trading closer to the Donchian high, negative values indicate price is closer to the Donchian low, and the magnitude of the histogram reflects how strongly price is favoring one side of the range. The color logic highlights this state visually: stronger positive conditions can be shown in teal, moderate positive conditions in lime, stronger negative conditions in red, and neutral or transitional states in orange. The script also includes an option to color the actual chart candles with the same colors as the histogram, so traders can see Donchian-based pressure directly on the main price chart without constantly looking down at the lower pane. The indicator works on completed bars using standard highest/lowest and moving average functions, so it behaves like a normal oscillator and does not use any lookahead tricks. It is best used as a contextual tool to gauge whether price is pushing to the edges of its recent range or reverting toward balance, and to visually synchronize that information with candle colors when desired.

Regime MapRegime Map — Volatility State Detector
This indicator is a PineScript friendly approximation of a more advanced Python regime-analysis engine.
The original backed identifies market regimes using structural break detection, Hidden-Markov Models, wavelet decomposition, and long-horizon volatility clustering. Since Pine Script cannot execute these statistical models directly, this version implements a lightweight, real-time proxy using realised volatility and statistical thresholds.
The purpose is to provide a clear visual map of evolving volatility conditions without requiring any heavy offline computation.
________________________________________
Mathematical Basis: Python vs Pine
1. Volatility Estimation
Python (Realised Volatility):
RVₜ = √N × stdev( log(Pₜ) − log(Pₜ₋₁) )
Pine Approximation:
RVₜ = stdev( log(Pₜ) − log(Pₜ₋₁), lookback )
Rationale:
Realised volatility captures volatility clustering — a key characteristic of regime transitions.
________________________________________
2. Regime Classification
Python (HMM Volatility States):
Volatility is modelled as belonging to hidden states with different means and variances:
State μ₁, σ₁
State μ₂, σ₂
State μ₃, σ₃
with state transitions determined by a probability matrix.
Pine Approximation (Z-Score Regimes):
Zₜ = ( RVₜ − mean(RV) ) / stdev(RV)
Regime assignment:
• Regime 0 (Low Vol): Zₜ < Zₗₒw
• Regime 1 (Normal): Zₗₒw ≤ Zₜ ≤ Zₕᵢgh
• Regime 2 (High Vol): Zₜ > Zₕᵢgh
Rationale:
Z-scores provide clean statistical boundaries that behave similarly to HMM state separation but are computable in real time.
________________________________________
3. Structural Break Detection vs Rolling Windows
Python (Bai–Perron Structural Breaks):
Segments the volatility series into periods with distinct statistical properties by minimising squared error over multiple regimes.
Pine Approximation:
Rolling mean and rolling standard deviation of volatility over a long window.
Rationale:
When structural breaks are not available, long-window smoothing approximates slow regime changes effectively.
________________________________________
4. Multi-Scale Cycles
Python (Wavelet Decomposition):
Volatility decomposed into long-cycle (A₄) and short-cycle components (D bands).
Pine Approximation:
Single-scale smoothing using long-horizon averages of RV.
Rationale:
Wavelets reveal multi-frequency behaviour; Pine captures the dominant low-frequency component.
________________________________________
Indicator Output
The background colour reflects the active volatility regime:
• Low Volatility (Green): trending behaviour, cleaner directional movement
• Normal Volatility (Yellow): balanced environment
• High Volatility (Red): sharp swings, traps, mean-reversion phases
Regime labels appear on the chart, with a status panel displaying the current regime.
________________________________________
Operational Logic
1. Compute log returns
2. Calculate short-horizon realised volatility
3. Compute long-horizon mean and standard deviation
4. Derive volatility Z-score
5. Assign regime classification
6. Update background colour and labels
This provides a stable, real-time map of market state transitions.
________________________________________
Practical Applications
Intraday Trading
• Low-volatility regimes favour trend and breakout continuation
• High-volatility regimes favour mean reversion and wide stop placement
Swing Trading
• Compression phases often precede multi-day trending moves
• Volatility expansions accompany distribution or panic events
Risk Management
• Enables volatility-adjusted position sizing
• Helps avoid leverage during expansion regimes
________________________________________
Notes
• Does not repaint
• Fully configurable thresholds and lookbacks
• Works across indices, stocks, FX, crypto
• Designed for real-time volatility regime identification
________________________________________
Disclaimer
This script is intended solely for educational and research purposes.
It does not constitute financial advice or a recommendation to buy or sell any instrument.
Trading involves risk, and past volatility patterns do not guarantee future outcomes.
Users are responsible for their own trading decisions, and the author assumes no liability for financial loss.

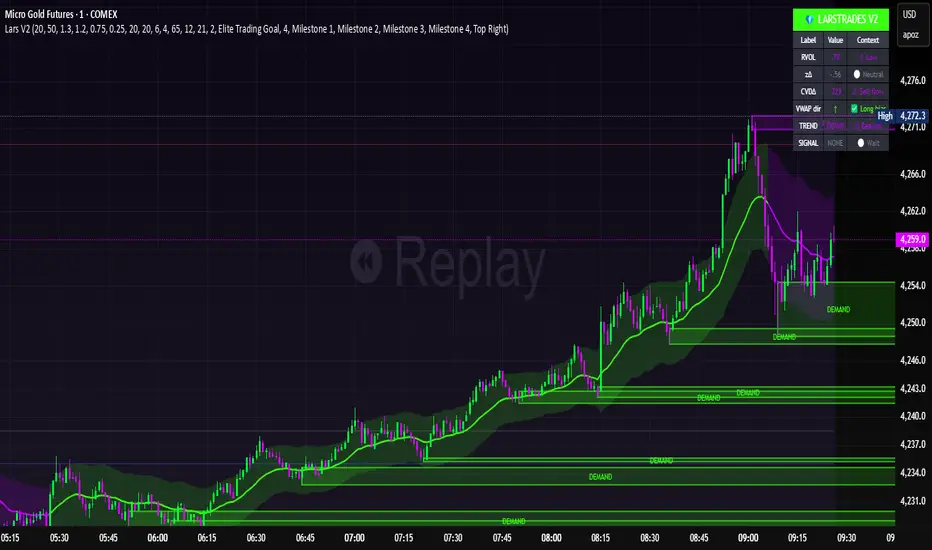
LarsTrades Order Flow ZonesLarsTrades Order Flow Zones
**Important:
-Futures charts only!
-Trust the default settings
-best on 2min or lower timeframe.
-if indicator error in replay mode: exit, ctrl+r - it will reset.
This indicator builds a full trade workflow from raw order flow imbalances. It finds aggressive buy and sell imbalances, promotes the strongest ones into key levels, and manages each level through its entire life cycle. Every level becomes a visual zone on the chart that updates in real time as the market moves.
It is built for short-term traders who want clarity, speed, and a structured decision process based on imbalances instead of guesswork.
If you rely on order flow, imbalance zones, or systematic retest setups, this tool helps you stay consistent and understand the story behind each move.
BT Volume & Volatility Spike
The BT Spike Indicator is aimed at identifying significant spikes in trading volume and price volatility on cryptocurrency or futures charts. It helps traders spot potential reversal or momentum shifts by combining volume analysis with volatility measures. The core logic revolves around detecting when volume surges above its historical average while volatility (measured via ATR) also spikes, signaling unusual market activity that could precede breakouts, pullbacks, or trend changes.
Key features include:
Inputs: Customizable parameters like lookback periods for averages (e.g., 14-bar EMA for volume), ATR length (default 14), and spike thresholds (e.g., volume multiplier of 2x the average).
Visuals: Plots bars or shapes on the chart for spike detections (e.g., green for bullish spikes, red for bearish), with optional alerts for real-time notifications.
Versions: We iterated on it, adding features like better alert conditions and visual signals, but rolled back to a simplified v0.1 for reliability, removing some experimental bug-prone elements like multi-timeframe checks.
BT Spike is a volume & volatility signal meant to alert traders that a move could begin soon, and is a supplementary tool to highlight confluence for existing high-probability setups.

Institutional Orderflow - CT Institutional Orderflow - CT
Overview
This indicator translates VIX futures dynamics into equity price implications, revealing institutional hedging flows and vol pricing's gravitational pull on price, where overpriced volatility signals compression and upside support, while underpriced levels flag expansion risks and downside pressure.
It maps VX deviations to equity levels via historical correlations, anchored by the Bull Bear Bias (BBB), a contango midpoint concept from Matt Cowart at Rocketscooter that sets VX1! fair value as the midpoint between front-month (VX1!) and second-month (VX2!) contracts at monthly rolls.
VX itself quantifies the distribution of options strikes around the underlying price over time, essentially the market's priced-in dispersion of potential outcomes, tied to expiration distance, with volatility inversely proportional to liquidity (fewer transactions in high-vol environments reduce flow and amplify moves).
Interpretation
- VX1! (Front-Month VIX Futures) : Gauges 30-day (±7 days, or 23-37 days to expiration) SPX implied volatility via forward options pricing, capturing medium-term hedging landscapes. Dealers, managing gamma exposure from longer-dated options, hedge by delta-adjusting underlying positions; rising VX1! reflects widening strike distributions (higher fear), prompting protective equity sales that pressure prices; falls toward BBB indicate narrowing distributions (calm), easing hedges and fostering liquidity-driven rallies as transaction frequency rises.
- VIX1D (1-Day Expected Volatility) : Focuses on ultra-short-dated (e.g., 0DTE) P.M.-settled options, measuring immediate strike clustering and gamma intensity near expiration. Closer-dated options heighten dealer sensitivity; spikes signal concentrated hedging bursts, eroding liquidity and fueling intraday volatility with sharp price reversals; declines promote hedging unwind, boosting transaction flow and short-term stability.
- VVIX (Volatility of VIX) : Assesses the implied volatility of VIX options (the "vol of vol"), revealing uncertainty in the vol forecast itself. Elevated VVIX denotes aggressive dealer repositioning across VIX strikes, forecasting erratic VX swings and reduced equity liquidity; subdued levels imply stable distributions, enhancing flow and trend persistence. BBB projections adjust dynamically: low VVIX (<80) constrains overshoots for reversion trades, while high (>110) expands them amid panic hedging.
- BBB Relationship : VX1! above BBB highlights over-distributed (expensive) vol, where dealers unwind hedges as time decays, inverting low liquidity into upside momentum; below BBB warns of under-distributed (cheap) vol, with sparse transactions amplifying expansion risks. Shorter tenors (VIX1D) drive tactical, gamma-fueled price action, contrasting VX1!'s strategic horizon, with VVIX scaling the intensity.
Key Features
- Target Line (Anchored) : Locks at swing violations as enduring support (green, below price) or resistance (red, above), fusing BBB's vol equilibrium with technical anchors to spotlight dealer hedge confluences in strike distributions.
- Magnet Line (Dynamic) : Mirrors live VX1!/BBB shifts, plotting "implied fair" price (blue above for unwind pull; orange below for hedge drag), linking term structure evolution to liquidity-driven gravity.
- Fear Scenario Line : Forecasts price erosion from a 10%+ VX1! surge above BBB, calibrated by VVIX for vol-of-vol amplification, defining dealer panic thresholds where low-liquidity spikes cascade.
- Overshoot Projection : Predicts interim extensions past targets, modulated by VIX1D (near-term gamma flares) and VVIX (distribution uncertainty), relating expiration proximity to heightened swings before time-decay reversion.
- Candle Coloring and SMA Trends : Tracks near-term VX1!/VVIX/VIX1D flows via gradient-colored candles (strong/medium/weak bullish/bearish based on SMA deviations), visualizing realtime options dynamics; green shades signal hedging unwind (rising liquidity, upside bias), red indicates expansion (dealer sales, downside drag). Recommended: VX1! Trend for long-term confluences (Tue-Thu swings); VIX1D Trend or VX1! + VIX1D for short-term (Mon/Fri scalps); add VVIX for regime shifts.
- Swing Boxes : Denote aggressive VX spikes (fear hedging bets) or de-escalations (position realizations), highlighting gamma-driven reversals where dealers rebalance, often preceding liquidity surges or drains in price action.
- Table Metrics : Condenses VX1!/BBB skew, VVIX regimes, VIX1D pulses, and contango cues, correlating options tenor gradients to price flow and hedging mechanics.

ES-VIX Daily Price Bands - Inner and OuterES-VIX Daily Price Bands
This indicator plots dynamic intraday price bands for ES futures based on real-time volatility levels measured by the VIX (CBOE Volatility Index). The bands evolve throughout the trading day, providing volatility-adjusted price targets.
Formulas:
Upper Band = Daily Low + (ES Price × VIX ÷ √252 ÷ 100)
Lower Band = Daily High - (ES Price × VIX ÷ √252 ÷ 100)
The calculation uses the square root of 252 (trading days per year) to convert annualized VIX volatility into an expected daily move, then scales it as a percentage adjustment from the current day's extremes.
Features:
Real-time band calculation that updates throughout the trading session
Upper band (green) extends from the current day's low
Lower band (red) contracts from the current day's high
Inner upper band (green) at 50% of expected move
Inner lower band (red) at 50% of expected move
Middle Inner upper band (green) at 80% of expected move
Middle Inner lower band (red) at 80% of expected move
Outer upper band (green) at 150% of expected move
Outer lower band (red) at 150% of expected move
Shaded zone between bands for visual clarity
Information table displaying:
Current ES price and VIX level
Running daily high and low
Current upper and lower band values
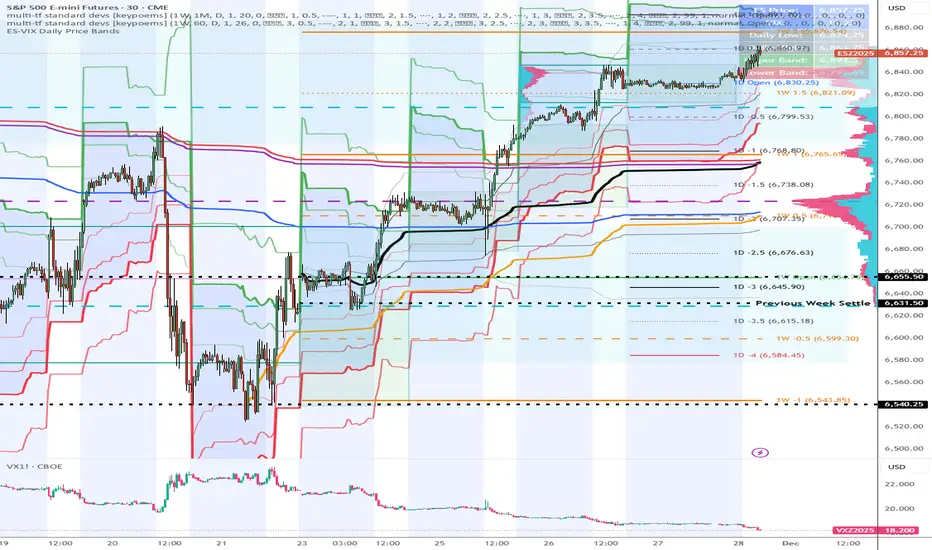
DTR OI IndicatorThe DTR OI Indicator is a multi-exchange open interest indicator designed for futures traders.
It aggregates OI from multiple exchanges to provide a unified and more reliable view of market positioning.
MAIN FUNCTIONS
• Open Interest Candles
• Open Interest Delta
• Delta × Relative Volume
• Open Interest RSI
• Threshold-based alerts for unusually large OI increases or decreases
• Optional OI EMA smoothing
PROFILE SYSTEM
Includes an OI-based distribution profile similar to a volume profile.
Shows Value Area, POC, and structural nodes based on OI activity within the visible chart range.
WHAT IT HELPS IDENTIFY
• Liquidations and rekt events
• Aggressive long/short buildup
• Position unwinds ahead of reversals
• OI-driven levels of interest
• Momentum confirmation (Delta × rVOL)
• Trend exhaustion (OI RSI)
NOTES
• Works across several exchanges for broader accuracy
• Coin or USD quoting supported
• Profile mode is resource-intensive
• No repainting
Ideal for traders who rely on OI, delta, and market positioning to understand futures flows and liquidity shifts.

FinPile Momentum📊 FinPile Momentum Indicator - User Guide
What Is This Indicator?**
A visual momentum histogram that sits below your price chart, giving you an instant read on whether momentum is bullish, bearish, or neutral. Designed for day traders who need to make fast decisions.
**The Basics: Grade System**
| Grade | Color | Score | What It Means | Action |
|-------|-------|-------|---------------|--------|
| **A+** | Bright Green | +60 to +100 | Everything aligned bullish | ✅ STRONG BUY |
| **A** | Green | +40 to +59 | Strong upward momentum | ✅ BUY |
| **B** | Light Green | +20 to +39 | Mild bullish momentum | ⚠️ MAYBE - be careful |
| **C** | Gray | -19 to +19 | No clear direction | ❌ NO TRADE - wait |
| **D** | Orange | -20 to -39 | Mild bearish momentum | ⚠️ Caution |
| **E** | Red | -40 to -59 | Bearish momentum | 🔴 AVOID longs |
| **F** | Dark Red | -60 to -100 | Strong downward momentum | 🔴 SHORT or stay out |
How to Read the Histogram**
A+ ──────── +60 ────────
A ──────── +40 ──────── ← GREEN ZONE = BUY
B ──────── +20 ────────
═════════ C ════════ 0 ═════════ ← GRAY = NO TRADE
D ──────── -20 ────────
E ──────── -40 ──────── ← RED ZONE = AVOID/SHORT
F ──────── -60 ────────
**Tall green bars above +40** = Strong momentum, look for long entries
**Bars near zero (gray)** = Choppy/no direction, stay out
**Tall red bars below -40** = Bearish momentum, avoid longs or short
### **Warning Symbols**
| Symbol | Meaning | What To Do |
|--------|---------|------------|
| ⚠️ | Exhaustion detected (climax top or bottom) | Expect potential reversal |
| ⚡ | Parabolic move | Too fast, pullback likely |
**The Info Table (Top Right)**
| Row | What It Shows |
|-----|---------------|
| **MOMENTUM** | Current grade (A+, A, B, C, D, E, F) |
| **Score** | Exact number (-100 to +100) |
| **Accel** | 🚀 ACCEL (speeding up) / 💨 DECEL (slowing down) / ➖ STEADY |
| **vs IWM/SPY** | 🟢 OUT (outperforming) / 🔴 UNDER (underperforming) |
| **Mode** | Current smoothing mode and EMA length |
**3 Smoothing Modes**
| Mode | Best For | How It Works |
|------|----------|--------------|
| **⚡ Quick & Clean** (Default) | Scalping, fast day trading | EMA(5) + threshold filter - responsive but no flickering |
| **🐢 Slow & Reliable** | Swing trading, patient traders | Longer lookback + EMA(8) - very smooth, fewer false signals |
| **🎯 Adaptive** | Volatile stocks, changing conditions | Adjusts EMA based on volatility - smart and automatic |
**How to change:** Settings → Smoothing → Smoothing Mode
---
### **Quick Decision Framework**
#### ✅ GO LONG when:
- Grade is **A+ or A** (green histogram above +40)
- Acceleration shows **🚀 ACCEL** (momentum increasing)
- vs IWM shows **🟢 OUT** (beating the market)
- No warning symbols (⚠️ or ⚡)
#### ❌ STAY OUT when:
- Grade is **C** (gray histogram near zero)
- Acceleration shows **💨 DECEL** while in a trade
- Score is bouncing between grades (indecision)
#### 🔴 GO SHORT or EXIT LONGS when:
- Grade is **E or F** (red histogram below -40)
- vs IWM shows **🔴 UNDER** (lagging market)
- Warning symbol ⚠️ appears at highs
---
### **Combining with Price Action**
| Momentum | Price Action | Decision |
|----------|--------------|----------|
| A/A+ rising | Breaking resistance | ✅ Strong buy |
| A/A+ but DECEL | At resistance | ⚠️ Wait for confirmation |
| B flat | Consolidating | ❌ No trade yet |
| C choppy | Ranging | ❌ Stay out |
| D/E falling | Breaking support | 🔴 Short or exit longs |
| F with ⚠️ | Capitulation low | 👀 Watch for bounce |
---
### **Settings Recommendations**
#### For Small Caps / Low Float:
```
Benchmark: IWM
Smoothing Mode: Adaptive
```
#### For Large Caps (AAPL, MSFT, etc.):
```
Benchmark: SPY
Smoothing Mode: Quick & Clean
```
#### For Volatile Meme Stocks:
```
Benchmark: IWM
Smoothing Mode: Adaptive
Adaptive High Vol EMA: 3
```
#### For Smoother Signals:
```
Smoothing Mode: Slow & Reliable
Slow Mode: Lookback Mult: 2.5
Slow Mode: EMA Length: 10
```
---
### **Pro Tips**
1. **Don't fight the color** - If histogram is red, don't go long hoping for reversal
2. **Watch for acceleration changes** - 🚀→💨 while price is rising = momentum fading, tighten stops
3. **Grade + Acceleration combo:**
- A + 🚀 ACCEL = Best setup
- A + 💨 DECEL = Momentum fading, be cautious
- C + 🚀 ACCEL = Potential breakout coming
4. **Use with the main indicator** - Momentum histogram for timing, main FinPile Institutional for levels and full analysis
5. **Background color** - When background turns green/red, momentum is strong (above +40 or below -40)
---
### **Example Trade**
```
You see:
┌─────────────────────────┐
│ MOMENTUM │ A │ ← Good grade
│ Score │ 52 │ ← Solid score
│ Accel │ 🚀 ACCEL │ ← Increasing!
│ vs IWM │ 🟢 OUT │ ← Beating market
│ Mode │ ⚡ QUICK │
└─────────────────────────┘
Histogram: Tall green bar above +40 line
Decision: ✅ LONG - All signals aligned
```
---
### **Quick Reference Card**
```
🟢 GREEN (A+/A) + 🚀 ACCEL + 🟢 OUT = BUY
⚪ GRAY (C) = NO TRADE
🔴 RED (E/F) + 💨 DECEL + 🔴 UNDER = SHORT/EXIT
⚠️ WARNING = Expect reversal

MFM - Light Context HUD (Free)Overview
MFM Light Context HUD is the free version of the Market Framework Model. It gives you a fast and clean view of the current market regime and phase without signals or chart noise. The HUD shows whether the asset is in a bullish or bearish environment and whether it is in a volatile, compression, drift, or neutral phase. This helps you read structure at a glance.
Asset availability
The free version works only on a selected list of five assets.
Supported symbols are
SP:SPX
TVC:GOLD
BINANCE:BTCUSD
BINANCE:ETHUSDT
OANDA:EURUSD
All other assets show a context banner only.
How it works
The free version uses fixed settings based on the original MFM model. It calculates the regime using a higher timeframe RSI ratio and identifies the current phase using simplified momentum conditions. The chart stays clean. Only a small HUD appears in the top corner. Full visual phases, ratio logic, signals, and auto tune are part of the paid version.
The free version shows the phase name only. It does not display colored phase zones on the chart.
Phase meaning
The Market Framework Model uses four structural phases to describe how the market behaves. These are not signals but context layers that show the underlying environment.
Volatile (Phase 1)
The market is in a fast, unstable or directional environment. Price can move aggressively with stronger momentum swings.
Compression (Phase 2)
The market is in a contracting state. Momentum slows and volatility decreases. This phase often appears before expansion, but it does not predict direction.
Drift (Phase 3)
The market moves in a more controlled, persistent manner. Trends are cleaner and volatility is lower compared to volatile phases.
No phase
No clear structural condition is active.
These phases describe market structure, not trade entries. They help you understand the conditions you are trading in.
Cross asset context
The Market Framework Model reads markets as a multi layer system. The full version includes cross asset analysis to show whether the asset is acting as a leader or lagger relative to its benchmark. The free version uses the same internal benchmark logic for regime detection but does not display the cross asset layer on the chart.
Cross asset structure is a core part of the MFM model and is fully available in the paid version.
Included in this free version
Higher timeframe regime
Current phase name
Clean chart output
Context only
Works on a selected set of assets
Not included
No forecast signals
No ratio leader or lagger logic
No MRM zones
No MPF timing
No auto tune
The full version contains all features of the complete MFM model.
Full version
You can find the full indicator here:
payhip.com
More information
Model details and documentation:
mfm.inratios.com
Disclaimer
The Market Framework Model (MFM) and all related materials are provided for educational and informational purposes only. Nothing in this publication, the indicator, or any associated charts should be interpreted as financial advice, investment recommendations, or trading signals. All examples, visualizations, and backtests are illustrative and based on historical data. They do not guarantee or imply any future performance. Financial markets involve risk, including the potential loss of capital, and users remain fully responsible for their own decisions. The author and Inratios© make no representations or warranties regarding the accuracy, completeness, or reliability of the information provided. MFM describes structural market context only and should not be used as the sole basis for trading or investment actions.
By using the MFM indicator or any related insights, you agree to these terms.
© 2025 Inratios. Market Framework Model (MFM) is protected via i-Depot (BOIP) – Ref. 155670. No financial advice.
