Adaptive Machine Learning Trading System [PhenLabs]📊Adaptive ML Trading System
Version: PineScript™v6
📌Description
The Adaptive ML Trading System is a sophisticated machine learning indicator that combines ensemble modeling with advanced technical analysis. This system uses XGBoost, Random Forest, and Neural Network algorithms to generate high-confidence trading signals while incorporating robust risk management features. Traders benefit from objective, data-driven decision-making that adapts to changing market conditions.
🚀Points of Innovation
• Machine Learning Ensemble - Three integrated models (XGBoost, Random Forest, Neural Network)
• Confidence-Based Trading - Only executes trades when ML confidence exceeds threshold
• Dynamic Risk Management - ATR-based stop loss and max drawdown protection
• Adaptive Position Sizing - Volatility-adjusted position sizing with confidence weighting
• Real-Time Performance Metrics - Live tracking of win rate, Sharpe ratio, and performance
• Multi-Timeframe Feature Analysis - Adaptive lookback periods for different market regimes
🔧Core Components
• ML Ensemble Engine - Weighted combination of XGBoost, Random Forest, and Neural Network outputs
• Feature Normalization System - Advanced preprocessing with custom tanh/sigmoid activation
• Risk Management Module - Dynamic position sizing and drawdown protection
• Performance Dashboard - Real-time metrics and risk status monitoring
• Alert System - Comprehensive alert conditions for entries, exits, and risk events
🔥Key Features
• High-confidence ML signals with customizable confidence thresholds
• Multiple trading modes (Conservative, Balanced, Aggressive) for different risk profiles
• Integrated stop loss and risk management with ATR-based calculations
• Real-time performance metrics including win rate and Sharpe ratio
• Comprehensive alert system with entry, exit, and risk management notifications
• Visual confidence bands and threshold indicators for easy signal interpretation
🎨Visualization
• ML Signal Line - Primary signal output ranging from -1 to +1
• Confidence Bands - Visual representation of model confidence levels
• Threshold Lines - Customizable buy/sell threshold levels
• Position Histogram - Current market position visualization
• Performance Tables - Real-time metrics display in customizable positions
📖Usage Guidelines
Model Configuration
• Confidence Threshold: Default 0.55, Range 0.5-0.95 - Minimum confidence for signals
• Model Sensitivity: Default 0.9, Range 0.1-2.0 - Adjusts signal sensitivity
• Ensemble Mode: Conservative/Balanced/Aggressive - Trading style preference
• Signal Threshold: Default 0.55, Range 0.3-0.9 - ML signal threshold for entries
Risk Management
• Position Size %: Default 10%, Range 1-50% - Portfolio percentage per trade
• Max Drawdown %: Default 15%, Range 5-30% - Maximum allowed drawdown
• Stop Loss ATR: Default 2.0, Range 0.5-5.0 - Stop loss in ATR multiples
• Dynamic Sizing: Default true - Volatility-based position adjustment
Display Settings
• Show Signals: Default true - Display entry/exit signals
• Show Threshold Signals: Default true - Display ±0.6 threshold crosses
• Show Confidence Bands: Default true - Display ML confidence levels
• Performance Dashboard: Default true - Show metrics table
✅Best Use Cases
• Swing trading with 1-5 day holding periods
• Trend-following strategies in established trends
• Volatility breakout trading during high-confidence periods
• Risk-adjusted position sizing for portfolio management
• Multi-timeframe confirmation for existing strategies
⚠️Limitations
• Requires sufficient historical data for accurate ML predictions
• May experience low confidence periods in choppy markets
• Performance varies across different asset classes and timeframes
• Not suitable for very short-term scalping strategies
• Requires understanding of basic risk management principles
💡What Makes This Unique
• True machine learning ensemble with multiple model types
• Confidence-based trading rather than simple signal generation
• Integrated risk management with dynamic position sizing
• Real-time performance tracking and metrics
• Adaptive parameters that adjust to market conditions
🔬How It Works
Feature Calculation: Computes 20+ technical features from price/volume data
Feature Normalization: Applies custom normalization for ML compatibility
Ensemble Prediction: Combines XGBoost, Random Forest, and Neural Network outputs
Signal Generation: Produces confidence-weighted trading signals
Risk Management: Applies position sizing and stop loss rules
Execution: Generates alerts and visual signals based on thresholds
💡Note:
This indicator works best on daily and 4-hour timeframes for most assets. Ensure you understand the risk management settings before live trading. The system includes automatic risk-off modes that halt trading during excessive drawdown periods.
Volatilitybreakout

ATR Squeeze BackgroundThis simple but powerful indicator shades the background of your chart whenever volatility contracts, based on a custom comparison of fast and slow ATR (Average True Range) periods.
By visualizing low-volatility zones, you can:
* Identify moments of compression that may precede explosive price moves
* Stay out of choppy, low-momentum periods
* Adapt this as a component in a broader volatility or breakout strategy
🔧 How It Works
* A Fast ATR (default: 7 periods) and a Slow ATR (default: 40 periods) are calculated
* When the Fast ATR is lower than the Slow ATR, the background is shaded in blue
* This shading signals a contraction in volatility — a condition often seen before breakouts or strong directional moves
⚡️ Why This Matters
Many experienced traders pay close attention to volatility cycles. This background indicator helps visualize those cycles at a glance. It's minimal, non-intrusive, and easy to combine with your existing tools.
🙏 Credits
This script borrows core logic from the excellent “Relative Volume at Time” script by TradingView. Credit is given with appreciation.
⚠️ Disclaimer
This script is for educational purposes only.
It does not constitute financial advice, and past performance is not indicative of future results. Always do your own research and test strategies before making trading decisions.

Volatility Trend (Zeiierman)█ Overview
The Volatility Trend (Zeiierman) is an indicator designed to help traders identify and analyze market trends based on price volatility. By calculating a dynamic trend line and volatility-adjusted bands, the indicator provides visual cues to understand the current market direction, potential reversal points and volatility.
█ How It Works
The indicator uses a weighted moving average of historical prices to create a responsive trend line that is adjusted for volatility using standard deviation. The indicator sets upper and lower bands at intervals of two standard deviations, acting as markers for potential overbought or oversold conditions. Additionally, by comparing current and previous trend line values, the indicator identifies the trend direction, providing crucial insights for traders.
█ How to Use
Trend Identification
Use the trend line to identify the overall market direction. An upward-sloping line indicates an uptrend, while a downward-sloping line indicates a downtrend.
Volatility Assessment
Use the distance between the upper and lower bands to gauge market volatility. Wider bands indicate higher volatility, while narrower bands indicate lower volatility.
Overbought/Oversold
If the price reaches or exceeds the upper or lower bands, it may be in an overbought or oversold condition, respectively.
█ Settings
Trend Control: Adjusts the sensitivity and smoothness of the trend line. Lower values make the trend more responsive, while higher values make it smoother.
Trend Dynamic: Controls how quickly the trend adjusts to price changes. Higher values result in a slower adjustment.
Volatility: Consists of two parts - the scaling factor for volatility and the sensitivity for volatility adjustment. Adjusting these settings alters the distance between the trend lines and the price, as well as how sensitive the bands are to changes in volatility.
Squeeze Control: Influences the degree to which market squeeze is considered in the calculation, with higher values increasing sensitivity.
Enable Scalping Trend: A toggle that, when activated, makes the indicator focus on short-term trends, which is particularly useful for scalping strategies.
█ Related scripts with the same calculation philosophy
TrendCylinder
TrendSphere
Predictive Trend and Structure
-----------------
Disclaimer
The information contained in my Scripts/Indicators/Ideas/Algos/Systems does not constitute financial advice or a solicitation to buy or sell any securities of any type. I will not accept liability for any loss or damage, including without limitation any loss of profit, which may arise directly or indirectly from the use of or reliance on such information.
All investments involve risk, and the past performance of a security, industry, sector, market, financial product, trading strategy, backtest, or individual's trading does not guarantee future results or returns. Investors are fully responsible for any investment decisions they make. Such decisions should be based solely on an evaluation of their financial circumstances, investment objectives, risk tolerance, and liquidity needs.
My Scripts/Indicators/Ideas/Algos/Systems are only for educational purposes!

Z-Score Based Momentum Zones with Advanced Volatility ChannelsThe indicator "Z-Score Based Momentum Zones with Advanced Volatility Channels" combines various technical analysis components, including volatility, price changes, and volume correction, to calculate Z-Scores and determine momentum zones and provide a visual representation of price movements and volatility based on multi timeframe highest high and lowest low values.
Note: THIS IS A IMPROVEMNT OF "Multi Time Frame Composite Bands" INDICATOR OF MINE WITH MORE EMPHASIS ON MOMENTUM ZONES CALULATED BASED ON Z-SCORES
Input Options
look_back_length: This input specifies the look-back period for calculating intraday volatility. correction It is set to a default value of 5.
lookback_period: This input sets the look-back period for calculating relative price change. The default value is 5.
zscore_period: This input determines the look-back period for calculating the Z-Score. The default value is 500.
avgZscore_length: This input defines the length of the momentum block used in calculations, with a default value of 14.
include_vc: This is a boolean input that, if set to true, enables volume correction in the calculations. By default, it is set to false.
1. Volatility Bands (Composite High and Low):
Composite High and Low: These are calculated by combining different moving averages of the high prices (high) and low prices (low). Specifically:
a_high and a_low are calculated as the average of the highest (ta.highest) and lowest (ta.lowest) high and low prices over various look-back periods (5, 8, 13, 21, 34) to capture short and long-term trends.
b_high and b_low are calculated as the simple moving average (SMA) of the high and low prices over different look-back periods (5, 8, 13) to smooth out the trends.
high_c and low_c are obtained by averaging a_high with b_high and a_low with b_low respectively.
IDV Correction Calulation : In this script the Intraday Volatility (IDV) is calculated as the simple moving average (SMA) of the daily high-low price range divided by the closing price. This measures how much the price fluctuates in a given period.
Composite High and Low with Volatility: The final c_high and c_low values are obtained by adjusting high_c and low_c with the calculated intraday volatility (IDV). These values are used to create the "Composite High" and "Composite Low" plots.
Composite High and Low with Volatility Correction: The final c_high and c_low values are obtained by adjusting high_c and low_c with the calculated intraday volatility (IDV). These values are used to create the "Composite High" and "Composite Low" plots.
2. Momentum Blocks Based on Z-Score:
Relative Price Change (RPC):
The Relative Price Change (rpdev) is calculated as the difference between the current high-low-close average (hlc3) and the previous simple moving average (psma_hlc3) of the same quantity. This measures the change in price over time.
Additionally, std_hlc3 is calculated as the standard deviation of the hlc3 values over a specified look-back period. The standard deviation quantifies the dispersion or volatility in the price data.
The rpdev is then divided by the std_hlc3 to normalize the price change by the volatility. This normalization ensures that the price change is expressed in terms of standard deviations, which is a common practice in quantitative analysis.
Essentially, the rpdev represents how many standard deviations the current price is away from the previous moving average.
Volume Correction (VC): If the include_vc input is set to true, volume correction is applied by dividing the trading volume by the previous simple moving average of the volume (psma_volume). This accounts for changes in trading activity.
Volume Corrected Relative Price Change (VCRPD): The vcrpd is calculated by multiplying the rpdev by the volume correction factor (vc). This incorporates both price changes and volume data.
Z-Scores: The Z-scores are calculated by taking the difference between the vcrpd and the mean (mean_vcrpd) and then dividing it by the standard deviation (stddev_vcrpd). Z-scores measure how many standard deviations a value is away from the mean. They help identify whether a value is unusually high or low compared to its historical distribution.
Momentum Blocks: The "Momentum Blocks" are essentially derived from the Z-scores (avgZScore). The script assigns different colors to the "Fill Area" based on predefined Z-score ranges. These colored areas represent different momentum zones:
Positive Z-scores indicate bullish momentum, and different shades of green are used to fill the area.
Negative Z-scores indicate bearish momentum, and different shades of red are used.
Z-scores near zero (between -0.25 and 0.25) suggest neutrality, and a yellow color is used.

Volatility Compression BreakoutThe Volatility Compression Breakout indicator is designed to identify periods of low volatility followed by potential breakout opportunities in the market. It aims to capture moments when the price consolidates within a narrow range, indicating a decrease in volatility, and anticipates a subsequent expansion in price movement. This indicator can be applied to any financial instrument and timeframe.
When the close price is above both the Keltner Middle line and the Exponential Moving Average (EMA), the bars are colored lime green, indicating a potential bullish market sentiment. When the close price is positioned above the Keltner Middle but below the EMA, or below the Keltner Middle but above the EMA, the bars are colored yellow, signifying a neutral or indecisive market condition. Conversely, when the close price falls below both the Keltner Middle and the EMA, the bars are colored fuchsia, suggesting a potential bearish market sentiment.
Additionally, the coloration of the Keltner Middle line and the EMA provides further visual cues for assessing the trend. When the close price is above the Keltner Middle, the line is colored lime green, indicating a bullish trend. Conversely, when the close price is below the Keltner Middle, the line is colored fuchsia, highlighting a bearish trend. Similarly, the EMA line is colored lime green when the close price is above it, representing a bullish trend, and fuchsia when the close price is below it, indicating a bearish trend.
Parameters
-- Compression Period : This parameter determines the lookback period used to calculate the volatility compression. A larger value will consider a longer historical period for volatility analysis, potentially capturing broader market conditions. Conversely, a smaller value focuses on more recent price action, providing a more responsive signal to current market conditions.
-- Compression Multiplier : The compression multiplier is a factor applied to the Average True Range (ATR) to determine the width of the Keltner Channels. Increasing the multiplier expands the width of the channels, allowing for a larger price range before a breakout is triggered. Decreasing the multiplier tightens the channels and requires a narrower price range for a breakout signal.
-- EMA Period : This parameter sets the period for the Exponential Moving Average (EMA), which acts as a trend filter. The EMA helps identify the overall market trend and provides additional confirmation for potential breakouts. Adjusting the period allows you to capture shorter or longer-term trends, depending on your trading preferences.
How Changing Parameters Can Be Beneficial
Modifying the parameters allows you to adapt the indicator to different market conditions and trading styles. Increasing the compression period can help identify broader volatility patterns and major market shifts. On the other hand, decreasing the compression period provides more precise and timely signals for short-term traders.
Adjusting the compression multiplier affects the width of the Keltner Channels. Higher multipliers increase the breakout threshold, filtering out smaller price movements and providing more reliable signals during significant market shifts. Lower multipliers make the indicator more sensitive to smaller price ranges, generating more frequent but potentially less reliable signals.
The EMA period in the trend filter helps you align your trades with the prevailing market direction. Increasing the EMA period smoothes out the trend, filtering out shorter-term fluctuations and focusing on more sustained moves. Decreasing the EMA period allows for quicker responses to changes in trend, capturing shorter-term price swings.
Potential Downsides
While the Volatility Compression Breakout indicator can provide valuable insights into potential breakouts, it's important to note that no indicator guarantees accuracy or eliminates risk. False breakouts and whipsaw movements can occur, especially in volatile or choppy market conditions. It is recommended to combine this indicator with other technical analysis tools and consider fundamental factors to validate potential trade opportunities.
Making It Work for You
To maximize the effectiveness of the Volatility Compression Breakout indicator, consider the following:
-- Combine it with other indicators : Use complementary indicators such as trend lines, oscillators, or support and resistance levels to confirm signals and increase the probability of successful trades.
-- Practice risk management : Set appropriate stop-loss levels to protect your capital in case of false breakouts or adverse price movements. Consider implementing trailing stops or adjusting stop-loss levels as the trade progresses.
-- Validate with price action : Analyze the price action within the compression phase and look for signs of building momentum or weakening trends. Support your decisions by observing candlestick patterns and volume behavior during the breakout.
-- Backtest and optimize : Test the indicator's performance across different timeframes and market conditions. Optimize the parameters based on historical data to find the most suitable settings for your trading strategy.
Remember, no single indicator can guarantee consistent profitability, and it's essential to use the Volatility Compression Breakout indicator as part of a comprehensive trading plan. Regularly review and adapt your strategy based on market conditions and your trading experience. Monitor the indicator's performance and make necessary adjustments to parameter values if the market dynamics change.
By adjusting the parameters and incorporating additional analysis techniques, you can customize the indicator to suit your trading style and preferences. However, it is crucial to exercise caution, conduct thorough analysis, and practice proper risk management to increase the likelihood of successful trades. Remember that no indicator can guarantee profits, and continuous learning and adaptation are key to long-term trading success.

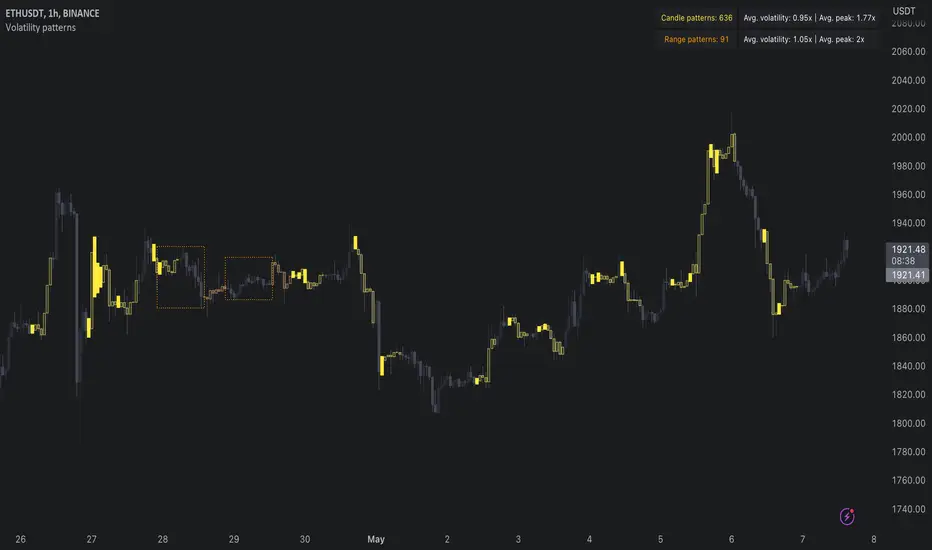
Volatility patterns / quantifytools- Overview
Volatility patterns detect various forms of indecisive price action, on a larger scale as a compressed range and on a smaller scale as indecision candles. Indecisive and volatility suppressing price action can be thought of as a spring being pressed down. The more suppression, the more tension is built and eventually released as a spike or series of spikes in volatility. Each volatility pattern is assigned an influence period, during which average and peak relative volatility is recorded and stored to volatility metrics.
- Patterns
The following scenarios are qualified as indecision candles: inside candles, indecision engulfing candles and volatility shifts.
By default, each indecision candle is considered a valid pattern only when another indecision candle has taken place within 3 periods, e.g. prior inside candle + indecision engulfing candle = valid volatility pattern. This measurement is taken to filter noise by looking for multiple hints of pending volatility, rather than just one. Level of tolerated noise can be changed via input menu by using sensitivity setting, by default set to 2.
Sensitivity at 1: Any single indecision candle is considered a valid pattern
Sensitivity at 2: 2 indecision candles within 3 bars is considered a valid pattern
Sensitivity at 3: 2 indecision candles within 2 bars (consecutive) is considered a valid pattern
The following scenarios are qualified as range patterns: series of lower highs/higher lows and series of low volatility pivots.
A pivot is defined by highest/lowest point in price, by default within 2 periods back and 2 periods forward. When 4 pivots with qualities mentioned above are found, a box indicating compressed range will appear. Both required pivots and pivot definition can be adjusted via input menu.
- Influence time and metrics
By default, influence time for each volatility pattern is set to 6 candles, a period for which spike(s) in volatility is expected. For each influence period, average relative volatility (volatility relative to volatility SMA 20) and peak relative volatility is recorded and stored to volatility metrics. All metrics used in calculations are visible in "Data Window "tab. Average and peak volatility during influence period will vary depending on chart, timeframe and chosen settings. Tweaking the settings might result in an improvement and is worth experimenting with.
- Visuals
By default, indecision candles are visualized as yellow lines and range patterns as orange boxes. Influence time periods are respectively visualized as colored candle borders, applied as long as influence time period is active. All colors are fully customizable via input menu.
- Practical guide
Volatility patterns depict moments of equal strength from both bulls and bears. While this equilibrium is in place, price is stagnant and compresses until either side initiates volatility, releasing the built up tension. On top of hedging and playing the volatility using volatility based instruments, some other methods can be applied to take advantage of the somewhat tricky areas of indecision.
Example #1: Trading volatility
Volatility is not a bad thing from a trading perspective, but can actually be fertile ground for executing trade setups. Trading volatility influence periods from higher timeframes on lower timeframes gives greater resolution to work with and opportunities to take advantage of the wild swings created.
Example #2: Finding bias for patterns
Points of confluence where it anyway makes sense to favor one side over the other can be used for establishing bias for indecisive price action as well. At face value, it makes sense to expect bearish reactions at range highs and bullish reactions at range low, for which volatility patterns can provide a catalyst.
Example #3: Betting on initiation direction
Betting on direction of the first volatile move can easily go against you, but if risk/reward is able to compensate for the poor win rate, it's a valid idea to consider and explore.
SuperBollingerTrend (Expo)█ Overview
The SuperBollingerTrend indicator is a combination of two popular technical analysis tools, Bollinger Bands, and SuperTrend. By fusing these two indicators, SuperBollingerTrend aims to provide traders with a more comprehensive view of the market, accounting for both volatility and trend direction. By combining trend identification with volatility analysis, the SuperBollingerTrend indicator provides traders with valuable insights into potential trend changes. It recognizes that high volatility levels often accompany stronger price momentum, which can result in the formation of new trends or the continuation of existing ones.
█ How Volatility Impacts Trends
Volatility can impact trends by expanding or contracting them, triggering trend reversals, leading to breakouts, and influencing risk management decisions. Traders need to analyze and monitor volatility levels in conjunction with trend analysis to gain a comprehensive understanding of market dynamics.
█ How to use
Trend Reversals: High volatility can result in more dramatic price fluctuations, which may lead to sharp trend reversals. For example, a sudden increase in volatility can cause a bullish trend to transition into a bearish one, or vice versa, as traders react to significant price swings.
Volatility Breakouts: Volatility can trigger breakouts in trends. Breakouts occur when the price breaks through a significant support or resistance level, indicating a potential shift in the trend. Higher volatility levels can increase the likelihood of breakouts, as they indicate stronger market momentum and increased buying or selling pressure. This indicator triggers when the volatility increases, and if the price is near a key level when the indicator alerts, it might trigger a great trend.
█ Features
Peak Signal Move
The indicator calculates the peak price move for each ZigZag and displays it under each signal. This highlights how much the market moved between the signals.
Average ZigZag Move
All price moves between two signals are stored, and the average or the median is calculated and displayed in a table. This gives traders a great idea of how much the market moves on average between two signals.
Take Profit
The Take Profit line is placed at the average or the median price move and gives traders a great idea of what they can expect in average profit from the latest signals.
-----------------
Disclaimer
The information contained in my Scripts/Indicators/Ideas/Algos/Systems does not constitute financial advice or a solicitation to buy or sell any securities of any type. I will not accept liability for any loss or damage, including without limitation any loss of profit, which may arise directly or indirectly from the use of or reliance on such information.
All investments involve risk, and the past performance of a security, industry, sector, market, financial product, trading strategy, backtest, or individual's trading does not guarantee future results or returns. Investors are fully responsible for any investment decisions they make. Such decisions should be based solely on an evaluation of their financial circumstances, investment objectives, risk tolerance, and liquidity needs.
My Scripts/Indicators/Ideas/Algos/Systems are only for educational purposes!
