SMH_DualMomentum (ROC + Volume Trend)SMH Dual Momentum (ROC + Volume Confirmation)
This indicator identifies high-quality bullish trends by combining price momentum (Rate of Change) with volume confirmation, and exits when momentum structurally fails.
Core Logic
BUY signal
Rate of Change (ROC) over N periods is above a positive threshold (strong upside momentum)
Current volume is above its moving average (rising market participation)
SELL signal
ROC crosses below zero, indicating loss of bullish momentum
Why It Works
ROC measures the speed and strength of price movement, filtering out weak or drifting trends
Volume confirmation ensures momentum is supported by real capital flow, reducing false breakouts
Momentum-based exit avoids prolonged drawdowns and capital stagnation
Key Advantages
Focuses on trend continuation, not prediction
Filters out low-quality price moves and range-bound markets
Captures long, high-conviction trends with relatively few trades
Simple, robust rules using only price and volume
Best Use Cases
Designed for trend-driven ETFs such as SMH (Semiconductors)
Suitable for swing to position trading on daily charts
Works best in markets with strong sector rotation and institutional participation
Notes
This is a trend-following momentum tool, not a mean-reversion indicator
No stop-loss is built in; risk management should be handled externally if required
Parameters can be adjusted to match different timeframes or assets
حجم التداول

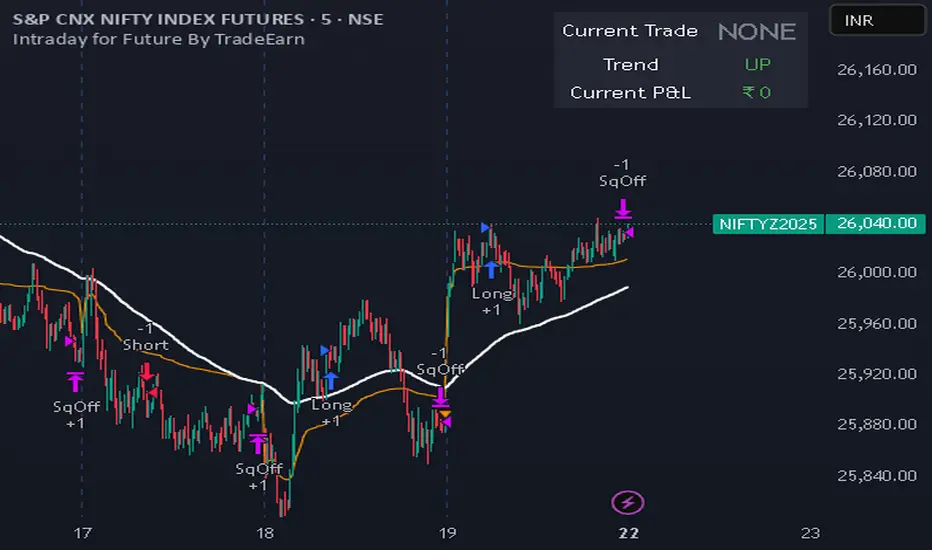
Intraday for Future By TradeEarnIntraday Strategy (StochRSI + VWAP + EMA)
Overview The Intraday Pullback Scalper is a specialized trend-following strategy designed for futures and equity traders who prefer to enter existing trends on pullbacks rather than chasing breakouts. By combining volume-weighted data (VWAP) with exponential moving averages (EMA) and momentum oscillators (Stochastic RSI), this script identifies high-probability entry points during intraday sessions. It includes built-in automation hooks (Alerts) compatible with bridge services for seamless execution.
How It Works
The strategy relies on a three-step confirmation process to filter noise and precision-time entries:
Trend Definition (The Filter):
VWAP (Volume Weighted Average Price): Acts as the primary regime filter. Longs are only permitted if price > VWAP; Shorts only if price < VWAP.
EMA (Exponential Moving Average): A secondary trend filter (default 100 periods) ensures alignment with the broader trend.
Time Range Breakout (Optional): Users can enable an "Initial Balance" filter where trades are only taken if the price breaks out of a specific time range (e.g., first hour High/Low).
Entry Trigger (The Signal):
Long Entry: The market must be in an Uptrend (Price > VWAP & EMA). The script waits for a "dip" where the Stochastic RSI drops below the Oversold level (default 20) and then crosses back up.
Short Entry: The market must be in a Downtrend (Price < VWAP & EMA). The script waits for a "rally" where the Stochastic RSI rises above the Overbought level (default 80) and then crosses back down.
Risk Management:
The strategy uses fixed Target Profit and Stop Loss values defined in currency (₹) relative to the trade quantity.
It features visual SL and TP lines on the chart for the duration of the trade to assist with manual monitoring.
Key Features
Universal Compatibility: Works on the "Current Chart" (Nifty, Bank Nifty, Stocks, Commodities) without needing complex dropdown selection.
Visual Dashboard: An on-screen table displays the Current Trade Status (Long/Short), Trend Direction, and Running P&L in real-time.
Algobaba Bridge Ready: Pre-formatted alert messages are included for users utilizing the Algobaba bridge for automation (supports MIS/NRML product types).
Customizable Trend Filters: Users can toggle the Time Range filter or adjust the VWAP Anchor (Session, Week, Month).
Settings & Configuration
Trade Quantity: Set your default lot size (e.g., 50 for Nifty).
Risk Settings: Define Target and Stop Loss in Rupees (₹) per trade setup.
Indicators: Adjustable lengths for EMA, RSI, and Stochastic.
Trading Window: Restrict entries to specific session hours (e.g., 09:15 - 15:10).
⚠️ IMPORTANT DISCLAIMER & RISK WARNING ⚠️
1. Educational Purpose Only This strategy script is provided solely for educational, informational, and research purposes. It does not constitute financial advice, investment recommendations, or a solicitation to buy or sell any securities, futures, or derivatives. The author is not a SEBI registered Research Analyst or Investment Advisor.
2. No Guarantee of Profit The "P&L" and performance metrics displayed on the chart are hypothetical and based on historical data. Past performance is not indicative of future results. Market conditions change, and a strategy that worked in the past may fail in the future.
3. Limitations of Backtesting
Slippage & Commission: The script results may not fully account for real-world execution costs such as broker commissions, taxes (STT/GST), slippage, or liquidity issues.
Repainting/Data Lag: While every effort is made to ensure code stability, real-time data feeds may vary from historical data due to internet latency or data provider differences.
4. High Risk in Derivatives Trading Futures and Options (F&O) involves a substantial risk of loss and is not suitable for every investor. You can lose more than your initial capital. Please assess your risk tolerance and financial situation before trading.
5. Automation & Third-Party Tools This script includes alert messages formatted for third-party bridge services (e.g., Algobaba). The author assumes no responsibility for:
Technical failures, API errors, or connectivity issues with your broker or bridge provider.
Incorrect order execution resulting from automation.
Users are solely responsible for monitoring their trades and verifying order execution.
Usage Agreement By using this script, you acknowledge that you are trading at your own risk and hold the author harmless from any losses incurred. Always test on a paper trading account before deploying real capital.
Intraday Options/Futures Naked By TradeEarnIntraday Momentum Strategy (Futures & Options)
Description: This is a specialized Intraday Momentum system designed for Indian Indices Nifty, BankNifty, FinNifty, Sensex and Crude Oil. It is engineered to simplify the automation process by standardizing quantity management for single-leg execution via third-party bridges.
Originality & Utility: Unlike standard momentum strategies, this script solves the complexity of position sizing across different asset classes. It features a custom "Smart Quantity" engine that automatically differentiates between Futures (Raw Quantity) and Index Options (Lot Multipliers), allowing traders to switch instruments without manually calculating order sizes.
Key Features:
Dual Mode: Supports both Futures (Long/Short) and Options Buying (Long CE / Long PE).
Smart Quantity Logic:
Futures/Crude: Inputs are treated as raw quantity (e.g., 1 Lot = 1 Qty).
Index Options: Inputs are automatically multiplied by the standard market lot size (e.g., 1 Lot Nifty = 25 Qty).
Rupee-Based Risk: Target, Stop Loss, and Trailing SL are defined in absolute Rupees (INR) rather than percentages, offering precise P&L control.
Choppiness Filter: Combines RSI and ADX to filter out low-volatility ranges.
Entry Logic:
Buy Signal: Green Impulse Candle + RSI > 55 + ADX > 20
Sell Signal: Red Impulse Candle + RSI < 45 + ADX > 20
Strategy Settings & Backtesting:
Commission: The strategy is backtested with a commission of ₹20 per order to reflect realistic net P&L.
Slippage: Users should account for realistic slippage in live trading, which is not factored into the script's hard values.
⚠️ Disclaimer & Statutory Warning
Strictly for Educational & Backtesting Purposes
1. SEBI Registration Status: The author of this script/strategy is NOT a SEBI registered Research Analyst (RA) or Investment Advisor (IA). This tool is provided solely to assist in backtesting logic and educational analysis. It does not constitute a recommendation to buy, sell, or hold any securities.
2. Market Risk: Investment in the securities market, particularly in Derivatives (Futures & Options), is subject to market risks. You may lose your entire capital. Please read all related scheme documents carefully before investing.
3. No Guarantees: Past performance of this algorithm (as shown in backtest results) is not indicative of future performance. Market conditions change, and slippage or execution errors can occur during live trading.
4. User Responsibility: By using this script, you acknowledge that you are solely responsible for your own trading decisions and financial losses. You are advised to consult a SEBI-registered financial advisor before deploying real capital. This script is intended for manual or semi-automated analysis and may not be compliant with high-frequency trading (HFT) regulations.


Ace Algo [Anson5129]🏆 Exclusive Indicator: Ace Algo
📈 Works for stocks, forex, crypto, indices
📈 Easy to use, real-time alerts, no repaint
📈 No grid, no martingale, no hedging
📈 One position at a time
----------------------------------------------------------------------------------------
Ace Algo
A trend-following TradingView strategy using a confluence of technical indicators and time-based rules for structured long/short entries and exits:
----------------------------------------------------------------------------------------
Parameters Explanation
Moving Average Length
Indicates the number of historical data points used for the average price calculation.
Shorter = volatile (short-term trends); longer = smoother (long-term trends, less noise).
Default: 20
Entry delay in bars
After a trade is closed, delay the next entry in bars. The lower the number, the more trades you will get.
Default: 4
Take Profit delay in bars
After a trade is opened, delay the take profit in bars. The lower the number, the more trades you will get.
Default: 3
Enable ADX Filter
No order will be placed when ADX < 20
Default: Uncheck
Block Period
Set a block period during which no trading will take place.
----------------------------------------------------------------------------------------
Entry Condition:
Only Long when the price is above the moving average (Orange line).
Only Short when the price is below the moving average (Orange line).
* Also, with some hidden parameter that I set in the backend.
Exit Condition:
When getting profit:
Trailing Stop Activates after a position has been open for a set number of bars (to avoid premature exits).
When losing money:
In a long position, when the price falls below the moving average, and the conditions for a short position are met, the long position will be closed, and the short position will be opened.
In a short position, when the price rises above the moving average, and the conditions for a long position are met, the short position will be closed, and the long position will be opened.
----------------------------------------------------------------------------------------
How to get access to the strategy
Read the author's instructions on the right to learn how to get access to the strategy.

Session Volume Profile Sniffer: HVN & Rejection ZonesA simple tool built for traders who rely on intraday volume structure.
What this script does
This script tracks volume distribution inside a selected session and highlights two key price levels:
High Volume Nodes (HVNs) — areas where price spent time building heavy participation.
Low Volume Nodes (LVNs) — thin zones where price moved quickly with very little interest.
Instead of plotting a full profile, this tool gives you the exact rejection-level lines you usually hunt manually.
Why these levels matter
HVN → price tends to react, stall, or flip direction
LVN → price often rejects strongly since liquidity is thin
Rejection patterns around these areas give clean entry signals
Positioning trades around HVN/LVN helps filter noise in choppy sessions
This script removes the trouble of drawing profiles, counting bins, or guessing node levels. Everything is calculated inside the session you choose.
How the detection works
Inside your session window, the script:
1. Tracks each tick-based price bucket
2. Accumulates raw volume for every bucket
Identifies:
HVNs = buckets with volume above a tier
LVNs = buckets with volume below a tier
3. Prints each level as a single clean line
4. Generates:
Long signal → bounce from LVN
Short signal → rejection from HVN
Built-in exits use ATR-based conditions for quick testing.
Features
Session-based volume mapping
HVN + LVN levels drawn automatically
Entry triggers based on rejection
ATR exits for experimental backtests
Clean, minimal visual output
Best use cases
Intraday futures
Index scalping
FX sessions (London / NY)
Crypto sessions (user-timed)
Anyone who trades around volume structure
Adjustable settings
Session window
Volume bin size
HVN multiplier
LVN multiplier
Enable/disable zone lines
This keeps it flexible enough for both scalpers and slow-paced intraday setups.
Important note
This script is built for study + idea testing.
It is not intended as a final system.
Once you identify how price behaves around these nodes, you can blend this tool into your own setup.

VWAP Mean Reversion (RSI + Deviation + ATR Risk)33this is an indicator that relies on other indicators. it relies on volume price action fvgs.OBS. and standard deviations.

VWAP Mean Reversion v2 nice indicator based on volume and price action. it pays attention to RSI ema.VWAP. and many more indicators

Strategy with VWRSI and SAVE orders Long or Short or BothVWRSI is very powerful indicator coded by Algo Alpha and I Make Strategy of it
But there is no stop loss instate the Strategy is using Save orders to minimize the market manipulation
The best to used is side way market with long and short enable
The Strategy trigger long or short market order -
long - ta.crossover(rsi, 20)
short - ta.crossunder(rsi, 80)
And if is not take profit from the first trade start with the save trades until will do
the sum of the first order - base order and the save order can be adjust from the user
as well the deviation from the first order
IF some user have questions let me know

DAX-30 ATRXVersion 1 of DAX-30 ATRX algo.
Revised versions may be available in future.
To be used on the 45 minute timeframe only.
Algorithm is also profitable on the NAS100 - but use with caution.
Optimized Settings:
Higher-TF for trend bias - 4 hours
HTF EMA length - 5
Min HA body size (pts) - 0.5
RSI length - 14
RSI threshold for longs - 40
Fisher length - 11
Volume MA length - 20
Volume spike multiplier - 1.2
ATR length - 14
ATR-mean length - 80
Min ATR / ATR_mean multiplier - 0.8
Max ATR / ATR_mean multiplier - 2.5
SL = ATR x - 0.9
TP = ATR x - 2.1
NY Session ON
Max trades per day - 1

Combined Signal + Auto Day Plan + Volume📘 TradingView Description — Combined Signal + Auto Day Plan + Volume
Strategy Overview
This strategy combines trend-following signals, daily context levels, and volume confirmation to generate high-probability intraday trading setups.
It is designed to filter noise, identify trend direction early, and avoid trades during low-quality market conditions.
🔷 1. Combined Signal Logic
The strategy merges multiple indicators to produce a single, cleaner signal:
Long Signal
Trend bias is bullish
Momentum histogram (MACD/Custom) shows upward pressure
Price crosses above the midline (WMA/EMA/etc.)
Volume supports the move
Short Signal
Trend bias is bearish
Momentum histogram shows downward pressure
Price crosses below the midline
Volume supports the move
This reduces false breakouts and ensures signals appear only during strong directional moves.
🔶 2. Auto Day Plan Levels (D-1 → D)
The script automatically reads previous day levels and displays them on today’s session:
Previous Day High (PDH)
Previous Day Low (PDL)
Previous Day Close (PDC)
Previous Day Mid / Range Zones
Optional FIB levels or custom zones
These levels act as intraday support/resistance, helping identify breakout, reversal, and retest opportunities.
Behavior:
D-1 levels are plotted from today’s open until today’s close.
Levels do not overlap into the wrong day.
Optional: extend lines to next day (D+1) for planning.
🔷 3. Volume Confirmation
To improve entry accuracy, the script checks for strength in volume:
Volume > X-period average
Volume spike detection
Relative Volume (RVOL) filter
Optional low-volume avoidance
A trade is taken only when the market shows real participation, reducing traps and sideways chop trades.
🔶 4. Entry & Exit Logic
Entry
Long Entry: Combined bull signal + volume confirmation
Short Entry: Combined bear signal + volume confirmation
Exit
Long Exit → Histogram turns down (hist < hist )
Short Exit → Histogram turns up (hist > hist )
Optional:
Auto SL at PDL/PDH
Trailing based on midline
Take profit using FIB or volatility levels
💠 5. Visuals
The chart plots:
Buy/Sell markers
D-1 support/resistance lines
Trend direction midline
Volume confirmation label
Combined signal status
Colors and styles can be customized from the input panel.
🎯 6. Purpose of the Strategy
This is a complete intraday automation tool combining:
✔ Trend
✔ Momentum
✔ Volume strength
✔ Key day levels
The goal is to provide structured, mechanical, rule-based trading — reducing emotional decisions and improving consistency.

Volatility Trend FollowerThe script combines several classic technical analysis techniques:
SuperTrend / Adaptive Band - The main idea comes from the SuperTrend indicator, which uses ATR (Average True Range) to create a trailing band that adapts to volatility
ATR (Average True Range) - A volatility measure developed by J. Welles Wilder Jr.
EMA (Exponential Moving Average) - Used as a global trend filter
Heikin Ashi - An option to smooth prices and reduce noise

Advanced Breakout System v2.0Advanced Breakout System v2.0
Developed by: Mohammed Bedaiwi
This script hunts for high-probability breakouts by combining price consolidation zones, volume spikes vs. average volume, smart money flow (OBV), and a Momentum Override for explosive moves that skip consolidation. Additionally, it automatically identifies and plots Support and Resistance levels with price labels to help you visualize market structure.
The system follows a "Watch & Confirm" logic: it first prints a WATCH setup, then a BUY only if price confirms strength.
💡 JUSTIFICATION OF CONCEPTS (MASHUP & ORIGINALITY)
This script is an original mashup combining several analytical concepts to address common breakout failures:
Volatility Compression Engine: Uses built-in functions like ta.highest() and ta.lowest() to mathematically define the setup phase where price volatility is compressed below a user-defined threshold.
Volume Spike Confirmation: The breakout must be confirmed by a volume increase greater than a moving average of volume, signaling strong market interest.
Smart Volume Filter (OBV): This is the key component. By checking if ta.obv is above its own Moving Average, we confirm that accumulation has been occurring during the consolidation period, suggesting institutional positioning before the price break.
Multi-Exit Risk System: Employs dynamic exits (EMA cross, volume dump, bearish pattern) instead of static stop-losses to manage risk adaptively based on real-time market action.
Market Structure Visualization: The script also includes a Support & Resistance engine to plot key swing pivots and price labels for visual context.
✅ STRATEGY RESULTS & POLICY COMPLIANCE
To ensure non-misleading and transparent backtesting results, this strategy is published with the following fully compliant properties:
Dataset Compliance: The backtest is performed on the CMTL Daily (1D) chart across a long history, generating 201 total trades. This significantly exceeds the minimum requirement of 100 trades, providing a robust test dataset.
Risk Control: The strategy uses a conservative order size set to 2% of equity (default_qty_value=2), strictly adhering to the sustainable risk recommendation of 5-10% of equity per trade.
Transaction Costs: Realistic trading conditions are modeled using 0.07% commission and 3 ticks slippage to prevent the overestimation of profitability.
⚙️ VISUAL GUIDE & SIGNAL LOGIC
Key Color Legend (Visual Guide):
WATCH – Setup (Yellow Arrow Down): Potential breakout setup detected.
BUY – Confirmation (Green Arrow Up): Confirmed breakout, triggered when price trades above the high of the WATCH candle.
SELL – Break (Orange Arrow): Short-term trend weakness, triggered when price closes below the Fast EMA (9).
SELL – Dump (Dark Red Arrow): Distribution / volume dump, triggered by a bearish candle with abnormally high volume.
SELL – Pattern (Purple Arrow): Bearish price-action pattern (such as a bearish engulfing).
Support & Resistance Lines (Red/Green): Small horizontal lines plotted at key swing points with exact price labels.
⌨️ INPUTS (DEFAULT SETTINGS)
Entry settings: Consolidation Lookback (default 20) = bars used to detect consolidation. Consolidation Range % (default 12%) = max allowed range size. Volume Spike Multiplier (default 1.2) = factor above average volume to count as a spike. Force Signal on Big Moves (default ON) = forces a WATCH signal on high-momentum moves.
Exit settings: Enable Fast Exit (EMA 9) toggles the SELL – Break signal. Dump Volume Multiplier defines what counts as “dump” volume.
Support & Resistance: Adjustable Pivot Left/Right bars control the sensitivity of the support and resistance lines.
⚠️ Disclaimer Trading involves significant risk of loss. This script is for educational and informational purposes only and is not financial advice or a recommendation to buy or sell any asset. BUY and SELL signals are rule-based and derived from historical behavior and do not guarantee future performance. Always use your own analysis and risk management. This is an open-source strategy; users are encouraged to test it across different symbols and timeframes.

Sniper PRO: The "Buffett Mode" VFI System"The stock market is a device for transferring money from the impatient to the patient." — Warren Buffett
Most traders lose money because they try to catch every small move. Sniper PRO is designed for the opposite: It identifies the massive, multi-week and multi-month trends driven by Institutional "Smart Money", and keeps you in the trade until the real move is over.
This is not a scalping tool. This is a Wealth Compounding Engine.
🚀 Why is this the "Secret Weapon"?
We combined the most searched and respected indicators into a single, high-probability algorithm:
VFI (Smart Money Flow): Tracks what the "Whales" are doing, not the retail traders.
Fibonacci Golden Ratio: Uses math to secure profits, not guesswork.
Trend Protocol: Filters out 90% of market noise.
🔥 The "Diamond Hands" Logic (VFI Shield)
The biggest problem in long-term trading is getting shaken out by a temporary dip. Sniper PRO solves this with the VFI Shield:
Even if price drops below your Stop Loss, the algorithm checks the Institutional Volume.
If Big Money is still holding? The Shield holds. You stay in the trade.
This feature alone allows you to ride trends for Weeks and Months (like NVDA, TSLA, BTC runs) without exiting prematurely.
⚙️ How It Works
1. The "Buffett" Entry We only enter when the odds are stacked in our favor:
Trend: Price must be above the EMA 50 (Bull Market).
Volume: VFI must be Positive (Accumulation Phase).
Volatility: The market must be active, not chopping sideways.
2. The Compounding Exit (Fibonacci Ladder) Instead of selling too early, the system builds a Fibonacci Ladder behind the price.
As the asset grows, your Stop Loss climbs automatically to the next Fibonacci level (0.382 -> 0.5 -> 0.618).
This locks in profits step-by-step while giving the asset room to breathe and grow.
3. Asymmetric Safety Shorting is risky in a long-term bull market. The system automatically reduces the size of Short trades to protect your capital, while maximizing exposure to Long rallies.
📊 Visual Guide
🔵 Blue Line: The Trend Baseline.
🔴 Red Steps: Your "Locked" Profit Level (Trailing Stop).
🟣 Purple 'X': Where the trade finally closed (Transparency).
Background Color:
Green: Bull Market (Safe to hold).
Orange: Choppy/Dangerous (Cash is King).
Best For:
Swing Traders & Investors (1D, 4H Timeframes).
People who want to catch the Big Moves and ignore the noise.
Disclaimer: This tool is designed for trend following. Past performance is not indicative of future results. Always manage your risk.

Crypto Scalping Strategy by SAIFOverview
An optimized scalping strategy designed for cryptocurrency markets, focusing on breakout opportunities with strict risk controls and optional safe compounding features. This strategy combines price action, volume analysis, and multi-timeframe trend confirmation.
Key Features
Breakout Detection System
Identifies significant price breakouts using dynamic channel analysis
Confirms breakouts with volume surge validation
Filters trades based on multi-timeframe trend alignment
Multi-Timeframe Trend Confirmation
Analyzes 1-hour and 4-hour timeframes for trend direction
Only takes trades aligned with higher timeframe trends
Uses long-term moving averages for trend validation
Advanced Risk Management
Conservative default risk: 1% per trade
ATR-based stop-loss placement (2x ATR)
Trailing stop mechanism to protect profits
Minimum profit target before trailing activates
Built-in position sizing based on account equity
Safe Capital Management Options
Fixed Capital Mode: Trade with consistent position sizes
Safe Compounding Mode: Gradually scales position size based on realized profits only
Drawdown Protection: 80% equity floor prevents excessive capital erosion
Leverage Control: 10x leverage factored into position calculations
Technical Filters
Momentum confirmation via oscillator conditions
Directional movement analysis
Volume threshold requirements
Trend strength validation
Position Sizing
The strategy automatically calculates position sizes based on:
Your specified risk percentage
Current ATR volatility
Available leverage
Account equity (with optional compounding)
Trade Management
Entry: Executes on confirmed breakouts with volume and trend alignment
Stop Loss: Placed at 2x ATR from entry
Take Profit: Uses trailing stops that activate after minimum profit threshold
Exit: Automatically managed through strategy exits
Customization Options
Adjustable channel length for breakout detection
Configurable volume multiplier for surge detection
Customizable oscillator thresholds
Flexible ATR period for volatility measurement
Optional compounding vs. fixed capital modes
Adjustable trailing stop parameters
Visual Features
Channel boundaries plotted on chart
Entry signals marked with arrows
Background coloring indicates trend direction
Real-time info table shows:
Current risk level
Compounding status
Capital values
Drawdown protection status
Alert Capabilities
Built-in alert conditions for:
Buy signals (breakout opportunities)
Sell signals (breakdown opportunities)
Important Disclaimers
⚠️ Educational Purpose Only: This strategy is provided for educational and research purposes. It is not investment advice.
⚠️ High-Risk Trading: Scalping and leverage trading carry substantial risk of loss. Cryptocurrency markets are highly volatile.
⚠️ Not Financial Advice: This tool does not constitute financial, investment, or trading advice. Always conduct your own research and consult qualified professionals.
⚠️ Leverage Warning: This strategy uses 10x leverage, which can amplify both gains and losses significantly.
⚠️ Backtesting Limitations: Past performance does not guarantee future results. Real trading involves slippage, execution delays, and emotional factors not present in backtesting.
⚠️ Capital at Risk: Only trade with capital you can afford to lose completely. Never trade with borrowed money or funds needed for living expenses.
Commission & Fees
Commission: 0.13% per trade
Initial capital: $100 (default)
Commission costs are factored into backtest results
Best Practices
Start Small: Begin with minimum capital and conservative risk settings
Test Thoroughly: Backtest across different market conditions and timeframes
Monitor Performance: Track win rate, profit factor, and maximum drawdown
Adjust Parameters: Optimize settings for your specific trading pairs
Use Alerts: Set up notifications to avoid missing opportunities
Manage Emotions: Follow the strategy rules consistently without override
Recommended Markets
High liquidity cryptocurrency pairs (BTC, ETH major pairs)
Assets with clear trending behavior
Markets with sufficient volume for scalping
Timeframes: 1H to 4H charts recommended
Risk Reminder
Scalping requires:
Quick decision-making
Tight risk management
Consistent discipline
Understanding of market microstructure
Proper capitalization
Always practice proper risk management. The strategy includes safety features, but no system can eliminate trading risk entirely. Trade responsibly.

VWAP Pullback + BOS + OBV v2 (Crypto Futures 15m)This strategy combines VWAP pullbacks, break-of-structure entries, and OBV confirmation to catch high-quality trend continuation moves on crypto futures. It waits for price to trend above or below the 200 EMA, then pulls back into the VWAP band, signaling a potential reload zone. A trade only triggers when price breaks recent structure in the direction of the trend and OBV shows supportive volume flow. An ATR volatility filter blocks entries during choppy, low-energy periods, and all trades use an ATR stop-loss with fixed reward-to-risk targeting. The result is a cleaner, more disciplined trend-following system designed for 15m–30m BTC/ETH scalping.

Sniper Perfect: Institutional Flow & Adaptive Risk ProtocolOverview Sniper Perfect is an advanced trend-following system designed to filter out "fakeouts" and institutional traps using a multi-layered verification protocol. It combines Volume Flow (VFI), Volatility (CHOP), and Momentum (RSI) to ensure entry only occurs in high-probability setups.
Key Features
🛡️ The Triple Filter Protocol
Strict Choppiness Filter: Uses a strict CHOP threshold (40). If the market is moving sideways, the algorithm locks all new entries to prevent whipsaws.
RSI Extremes Protection: Prevents FOMO buying at tops (Overbought > 70) and panic selling at bottoms (Oversold < 30).
Conflict Zone Detection: Identifies divergence between Price action and Money Flow. If price rises but institutional money exits, the background turns Gray and trading is disabled.
🔒 Adaptive Risk Management
Heat-Breathing Stop Loss: The SL distance adjusts dynamically based on market Volume and Volatility ("Heat").
Ratchet Mechanism: A mechanical lock ensures the Stop Loss can ONLY move in the direction of profit. It never loosens, guaranteeing that paper profits are protected.
📊 Live Dashboard A real-time panel in the bottom-right corner displays:
VFI Flow: Positive/Negative money flow.
Market Status: Active vs. Locked (Choppy).
RSI Status: Neutral, Overbought, or Oversold.
Visual Guide
🟢 Lime Zone: Clean Bullish Trend.
🔴 Red Zone: Clean Bearish Trend.
🟠 Orange Zone: High Choppiness (Stay Out).
🟣 'X' Marker: Exact price where the Stop Loss was triggered.
Disclaimer: For educational and research purposes only. Always manage your risk.

Sniper PerfectOverview Sniper Perfect is an advanced trend-following system designed to filter out "fakeouts" and institutional traps using a multi-layered verification protocol. It combines Volume Flow (VFI), Volatility (CHOP), and Momentum (RSI) to ensure entry only occurs in high-probability setups.
Key Features
🛡️ The Triple Filter Protocol
Strict Choppiness Filter: Uses a strict CHOP threshold (40). If the market is moving sideways, the algorithm locks all new entries to prevent whipsaws.
RSI Extremes Protection: Prevents FOMO buying at tops (Overbought > 70) and panic selling at bottoms (Oversold < 30).
Conflict Zone Detection: Identifies divergence between Price action and Money Flow. If price rises but institutional money exits, the background turns Gray and trading is disabled.
🔒 Adaptive Risk Management
Heat-Breathing Stop Loss: The SL distance adjusts dynamically based on market Volume and Volatility ("Heat").
Ratchet Mechanism: A mechanical lock ensures the Stop Loss can ONLY move in the direction of profit. It never loosens, guaranteeing that paper profits are protected.
📊 Live Dashboard A real-time panel in the bottom-right corner displays:
VFI Flow: Positive/Negative money flow.
Market Status: Active vs. Locked (Choppy).
RSI Status: Neutral, Overbought, or Oversold.
Visual Guide
🟢 Lime Zone: Clean Bullish Trend.
🔴 Red Zone: Clean Bearish Trend.
🟠 Orange Zone: High Choppiness (Stay Out).
🟣 'X' Marker: Exact price where the Stop Loss was triggered.
Disclaimer: For educational and research purposes only. Always manage your risk.

The Truth Sniper: Breathing Edition**Overview**
This is a highly advanced trend-following strategy designed to filter out market noise ("Fakeouts") and manage risk using a dynamic "Breathing Ratchet" mechanism. It combines traditional trend analysis with institutional money flow logic to identify the true market direction.
**Key Features**
**1. The Conflict Zone (Gray Zone Filter)**
Most strategies fail during low-volume accumulation or distribution phases. This algorithm introduces a "Conflict Zone" logic:
* **True Rally (Green):** Price is above EMA50 AND Money Flow (VFI) is positive.
* **True Drop (Red):** Price is below EMA50 AND Money Flow (VFI) is negative.
* **Conflict (Gray Background):** When Price and Money Flow disagree (e.g., Price rising on negative volume), the background turns Gray. **Trading is disabled** in these zones to avoid bull/bear traps.
**2. Breathing Stop-Loss Mechanism (Volatility Adjusted)**
The Stop Loss isn't static. It "breathes" based on market heat (Volume/RSI):
* **High Heat (High Volatility):** The SL loosens its grip, moving towards the bottom of the Fibonacci zone to allow price fluctuation without premature exits.
* **Low Heat (Low Volatility):** The SL tightens aggressively towards the price to lock in profits during slow momentum.
**3. The Ratchet Lock (Slippage Prevention)**
To ensure maximum profit retention, the "Breathing" mechanism is governed by a **Ratchet Logic**:
* **For Longs:** The Stop Loss can ONLY move UP. If the "Breathing" calculation suggests lowering the stop (due to increased volatility), the Ratchet blocks it, keeping the SL at the highest historical level.
* **For Shorts:** The Stop Loss can ONLY move DOWN.
**4. Fibonacci Exit Zones**
Exits are calculated based on a 60-day dynamic High/Low lookback, creating "Zones" (0-23.6%, 23.6-38.2%, etc.) that the price must conquer. The SL trails these zones mechanically.
**Visual Guide**
* **Lime/Red Background:** Active Trade Zone (Confirmed Trend).
* **Gray Background:** Conflict Zone (Stay Out / Hold).
* **Purple 'X':** The exact price level where the Stop Loss was hit (Fixed marker).
* **Stepline:** The active Stop Loss level (Visible only during open trades).
**Disclaimer**
This script is for educational and research purposes only. Always manage your risk.

Vesel VWAP but not starting until 7 pmThis improvement gets rid of trades that are entered prior to 7 pm before VWAP has even had a chance to set in.


Triple EMA + RSI + ATRThis comprehensive trading system combines triple EMA alignment, RSI momentum filtering, and dynamic ATR-based risk management. The strategy enters positions only when fast, medium, and slow EMAs align in proper order (bullish or bearish), confirmed by RSI remaining within defined thresholds (not overbought/oversold) and a volume spike above its moving average. Exits are managed intelligently using a multi-tier approach: a fixed stop-loss based on ATR, a first profit target at a predefined risk-reward ratio, and a trailing stop that activates after reaching a second, higher profit tier. Designed for trend-following with built-in momentum and volume confirmation, it features professional order execution with configurable commission and slippage for realistic backtesting. Visual cues including colored backgrounds and signal shapes enhance chart clarity.

Trend Signal MomentumOVERVIEW
Signal Trend Momentum is a hybrid strategy that combines multiple confirmations and filters to obtain better potential trading signals. Each confirmation and filter in Signal Trend Momentum aims to avoid possible false and trap signals.
HYBRID CONCEPTS
Smart Money Concept – This indicator forms market structure and Bullish & Bearish Order Block areas to make it easier to identify market trends and strong areas where price reversals often occur. Its purpose is to simplify recognizing market direction and serve as the first confirmation.
MSS + BOS (Market Structure Shift + Break of Structure) – This indicator serves as additional confirmation for the Smart Money Concept. With the presence of two types of market structure, the market trend direction becomes clearer and more convincing.
RSI Momentum Signal – This indicator becomes the third confirmation. When the Market Trend is clear and convincing, supported by the formation of Bearish and Bullish Order Blocks, the role of the Momentum Signal here becomes crucial as it provides trend momentum based on overbought and oversold areas.
Momentum Position – This indicator becomes the next confirmation based on buyer and seller VOLUME in the market. If buyer volume is higher, the momentum position will be depicted on the chart with an upward arrow, and conversely, if seller volume is higher, it will be depicted with a downward arrow.
SnR (Support and Resistance) – This final indicator is Support and Resistance, which will serve as the last and more convincing confirmation. Support and Resistance will strengthen the Order Block areas formed by the Smart Money Concept indicator. A Bullish Order Block + Support creates a higher possibility for an upward trend in the market, conversely, a Bearish Order Block + Resistance creates a higher possibility for a downward trend in the market.
The combination of these several indicators will provide a strong market direction + persistent buyer and seller areas, as well as depict momentum based on volume + RSI which serve as additional confirmations.
These additional confirmations will produce stronger signals and help avoid false and trap signals in the market.
HOW TO USE
A SHORT SIGNAL will be strong if there is a Downtrend Market Structure + Bearish Order Block + Resistance + Oversold RSI Momentum + Strong Seller Volume Momentum.
A LONG SIGNAL will be strong if there is an Uptrend Market Structure + Bullish Order Block + Support + Overbought RSI Momentum + Strong Buyer Volume Momentum.
CONCLUSION
Signal Trend Momentum is a combination of several powerful indicators designed to produce stronger, clearer, and easier-to-read signals.
This strategy is highly suitable for traders seeking more convincing trade signals based on multiple confirmations from the combined indicators, thereby creating a strong signal with a higher probability.
