Weighted RSI DivergenceWeighted RSI Divergence
A powerful divergence engine that grades every RSI divergence by strength, context, and confluence — helping you filter noise and focus only on the highest-probability reversal setups.
This script combines RSI divergences with five confirmation layers to produce confidence-weighted signals, clearer trade decisions, and alert-ready setups for both bullish and bearish reversals.
What This Indicator Detects
Bullish Divergence → Price makes a lower low while RSI makes a higher low
Bearish Divergence → Price makes a higher high while RSI makes a lower high
Confirmation Factors (Each Adds +1 to the Score)
Volume Spike: Above-average volume on the divergence bar
Trend Alignment: Divergence occurs in harmony with higher-timeframe trend dynamics
Key Level Proximity: Price tests significant support or resistance
Momentum Extremes: RSI reaches oversold/overbought thresholds
Candle Reversal Pattern: Engulfing, pin bar, or similar reversal structure
Confidence Scoring
1–2 → Low Confidence (gray)
3 → Medium Confidence (yellow)
4–5 → High Confidence (green/red)
Higher scores = higher-probability setups.
Visual Components
RSI plot with dynamic gradient coloring
Divergence lines mapped to RSI pivots
Signal labels showing confidence + factors
Background highlighting for high-confidence events
Real-time confidence meter for active bar conditions
Optional data table for factor-by-factor breakdown
Alerts Included
High-confidence bullish & bearish divergences
Medium-confidence signals
Any divergence meeting your minimum threshold
Best Practices
Prioritize setups with 4 or 5 confirmations
Use higher timeframes (4H, 1D, 1W) for more reliable signals
Combine with market structure and price action (S/R, HTF trend, liquidity zones)
Counter-trend divergences require stronger scores to validate
Final Notes
This script focuses on clarity, risk reduction, and selective trade timing. The confidence system helps distinguish weak divergences from high-probability reversal conditions — giving traders a structured, repeatable edge.
حجم التداول

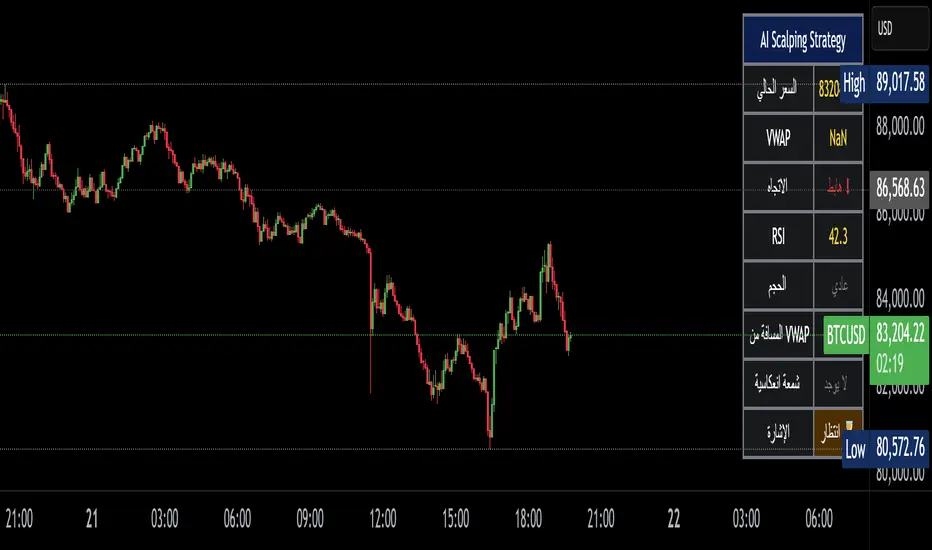
Alzeerr Scalping StrategyAlzeerr Scalping Strategy
A high-precision intraday scalping strategy that combines VWAP, support/resistance levels, volume confirmation, RSI momentum shifts, and reversal candlestick patterns to identify low-risk, high-accuracy trade entries. The strategy only trades in the direction of the trend relative to VWAP, focuses on high-probability pullback entries, and uses tight stop-losses with small, consistent profit targets. Designed to maximize accuracy and minimize drawdown during high-liquidity market sessions.
Market Cipher With DivegencesAnother look into classic ;)
My take on Market Cypher with new money line and DIVERGENCES!!!
Enjoy!

Volume Delta PROThis indicator show delta moves and producing it in a way that you can see what MADE the delta - buyers or sellers.
Important delta candles are also marked.
I also shows average delta and can be adjusted by reading data from lower time frames.

VZO Enhanced価格の上昇バーと下降バーごとに出来高を分離し、それぞれをEMAで平滑化して算出した Volume Zone Oscillator(VZO)の改良版です。
デフォルトでは20期間のEMAを使用し、トレンド方向に対する出来高の偏りをパーセンテージで表示します。
オーバーボート/オーバーソールドの水準(初期値 +60 / -60)を背景色でハイライトし、短期トレードでの反転ポイントや勢いの弱まりを視覚的に捉えやすくしています。
This script is a modified version of the Volume Zone Oscillator (VZO) tailored for short–term trading.
It separates volume into positive volume (when the close is higher than the previous close) and negative volume (when the close is lower than the previous close), then applies EMA to:
* positive volume
* negative volume
* total volume
The oscillator is calculated as the percentage difference between positive and negative volume relative to total volume.
By default it uses a length of 20 (EMA Length = 20) and highlights overbought / oversold zones (initially +60 / -60) with background colors, making it easy to see:
* trend strength based on volume
* shifts in volume pressure
* potential reversals and divergences between price and volume.

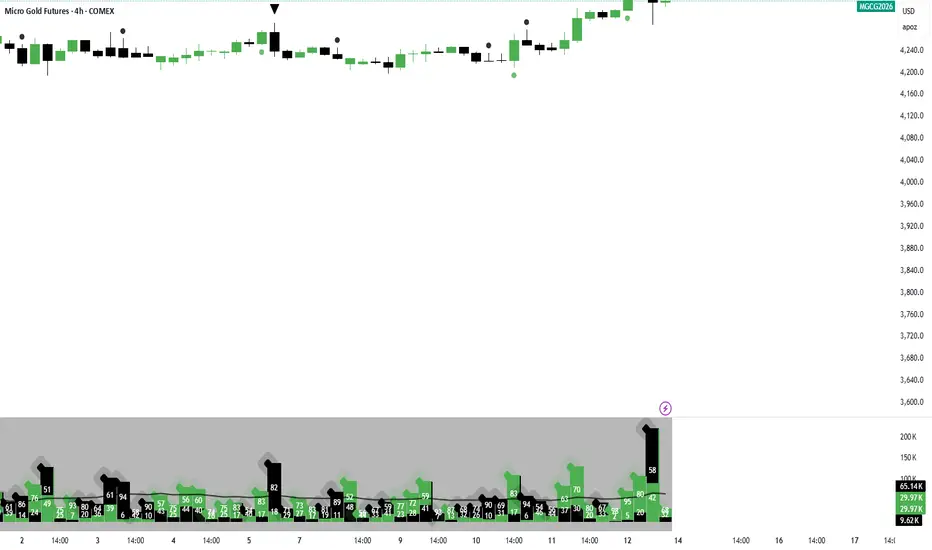
Weekday Close vs Open — Last N (per weekday)# Weekday Close vs Open - Last N Occurrences
This indicator distills every weekday's historical open-to-close behavior into a compact table so you can see how "typical" the current session is before the day even closes. It runs independently of your chart timeframe by pulling daily OHLCV data under the hood, tracking the last **N** completed occurrences for each weekday, and refreshing only when a daily bar closes. On daily charts you can also shade every past bar that matches today's weekday (excluding the in-progress session) to reinforce the pattern visually while the table remains non-repainting.
## What It Shows
- **Win/Loss/Tie counts** - how many of the last `N` occurrences closed above the open (wins), below (losses), or inside the tie threshold you define as "flat".
- **Win % heatmap** - the win column is color-coded (deep green > deep red) so you immediately recognize strong or weak weekdays.
- **Advanced metrics (optional)** - average daily volume plus the average percentage excursion above/below the open (`AvgUp%`, `AvgDn%`) for that weekday.
- **Totals row** - aggregates every weekday into one row to estimate overall hit rate and average stats across the entire data set.
- **Weekday shading (optional)** - on daily charts you can tint every bar that matches today's weekday (all Mondays, all Fridays, etc.) for instant pattern recognition.
## How It Works
1. The script requests daily OHLCV data (non-repainting) regardless of the chart timeframe.
2. When a new daily bar confirms, it packs that day's data into one of seven arrays (one per weekday). Each day contributes five floats (O/H/L/C/V) so trimming and statistics stay in lockstep.
3. A helper function (`f_dayMetrics`) scans daily history to compute average volume, average excursion above/below the open, and win/loss/tie counts for the requested weekday.
4. The table populates on the last bar of the chart session, respecting your advanced/totals toggles and keeping text at `size.normal`.
## Reading the Table
- **Win/Loss/Tie columns**: raw counts taken from your chosen `N`.
- **Win %***: excludes ties from the denominator so it reflects only decisive closes.
- **AvgUp% / AvgDn%**: typical intraday extension (high vs open, open vs low) in percent.
- **Avg Vol**: arithmetic mean of daily volume for that weekday.
- **TOTAL row**: provides a global win rate plus volume/up/down averages weighted by how many samples each weekday contributed.
## Practical Uses
- Spot weekdays that historically trend higher or lower before entering a trade.
- Compare current price action against the typical intraday range (`AvgUp%` vs today's move).
- Filter mean-reversion vs breakout setups based on the most reliable weekday patterns.
- Quickly gauge whether today is behaving "in character" by referencing the highlighted row or the optional whole-chart weekday shading.
> **Tip:** Use smaller `N` values (e.g., 10-20) for adaptive, recent behavior and larger values (50+) to capture longer-term seasonality. Tighten the tie threshold if you want almost every candle to register as win/loss, or widen it to focus only on meaningful moves.

ST – S&D Zones (Body-Based) [Soothing Trades]Short Description
ST – S&D Zones (Body-Based) automatically builds supply & demand zones from candle bodies, filters them by relative volume, and extends them forward. Active zones stay bold, broken zones fade, so you can instantly see which levels matter most right now
Full Description
This indicator is a volume-aware supply & demand engine designed to keep your chart clean while highlighting the areas that actually matter.
How it works
• Detects swing highs/lows (pivots) using a user-defined left/right bar lookback.
• Measures local relative volume and only promotes strong pivots into zones.
• Builds zones from candle body ranges (open–close), not full wicks.
• Extends all zones forward bar by bar.
When price breaks a zone:
• It is treated as mitigated/broken.
• If fading is enabled, the zone's opacity changes so it visually de-prioritizes.
• At the start of a new daily session, any faded zones are automatically removed, leaving only fresh active levels.
Inputs & customization
• Diameter Of Circles – Controls the size of circles drawn around high-volume pivots.
• Filter Points by Volume – Adjusts how "picky" the engine is. Higher values = fewer, stronger zones.
• Pivot Left Bars – Controls how many bars are used to confirm each pivot. Larger values = slower but stronger levels.
• Supply Color / Demand Color – Choose your own zone colors.
• Active / Broken Opacity – Set how bold active zones are vs. faded/broken ones.
• Fade When Broken – Turn fading on/off after price breaks a zone.
• Show Zones – Master on/off switch. When off, all existing zones are cleared.
How traders use it
• Use active zones as primary decision areas for entries, partial profits, or stop placement.
• Treat faded zones as secondary context: the market has already taken liquidity there, so they're often weaker if revisited.
• Combine with your own toolkit (price action, order flow, volatility tools, etc.) to time actual trades.
Visual features
• Body-based zones (no wick noise) show where actual trading happened.
• Volume circles around pivots emphasize high-volume turning points.
• Active zones use your chosen colors with custom opacity.
• Broken zones fade automatically when price breaks through.
• Session-based cleanup removes faded zones at the start of each new day.
• Toggle borders on/off to customize zone appearance.
Notes & disclaimer
• Works on most symbols and timeframes that support Pine Script v6.
• Optimized for markets with stable, reliable volume (indices, FX majors, futures, large-cap crypto).
• This tool is for educational purposes only and is not financial advice.
Always manage your own risk.

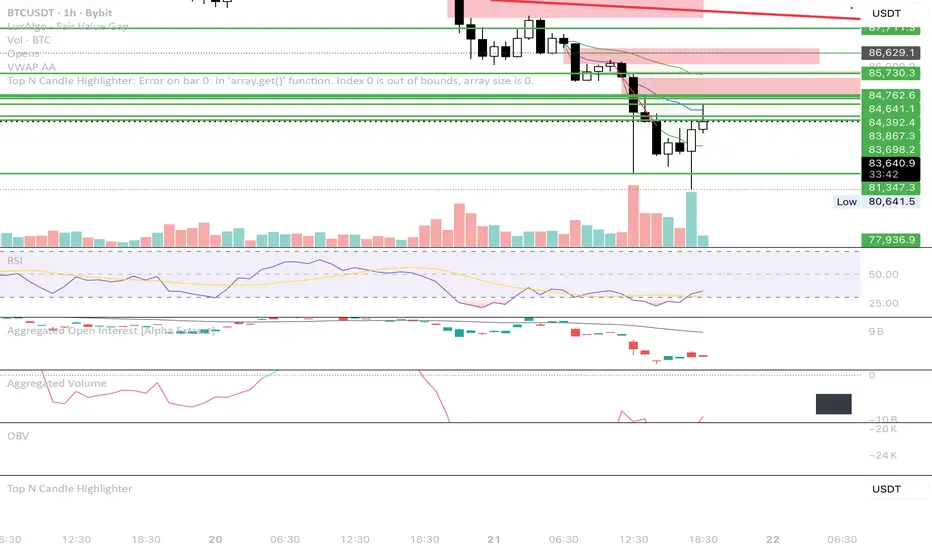
Top N Candle HighlighterTrack highest candle sizes on current timeframes. This short script:
1. Tracks the **top N largest candles** on the current chart
2. Option to use **body size** or **full candle range**
3. Highlights candles using `box.new()` (fully v6 compatible)
4. Optionally shows **rank and size labels**
5. Handles red, green, and doji candles differently with color
PIPSTA - Sniper - ICT Advancedpipsta sniper is a multi-asset ict-inspired indicator designed for intraday traders who follow liquidity concepts, london sweeps, and new york kill zone execution. it works across nq/es futures, gold/xauusd, and forex pairs using adaptive logic and dynamic thresholds so the behaviour fits each market naturally. the focus is simple: track liquidity, identify sweeps, wait for the kill zone window, and trigger clean automated setups.
the indicator monitors asian, london, and pre-market sessions using new york time. it records each session’s high and low, updates them in real time, and draws them on the chart. these levels reset at the start of every trading day. london highs and lows are especially important: when price breaks past a london level by a defined threshold specific to the asset, the indicator marks it as a sweep. once a sweep occurs, the level label updates, colours change, and the info panel reflects the sweep status. this gives traders clear structure for liquidity bias.
the new york kill zone (9:35–9:55 am et) is highlighted on the chart. this is the only zone where trade signals are allowed. the indicator waits for price to show either a spike-fade reversal after a sweep or a momentum breakout after a sweep. spike-fade signals appear when price forms a short-term extreme and reverses at the close of the bar, while breakout signals appear when price breaks a recent 10-bar range with direction aligned to liquidity taken earlier in the morning. both require a prior london sweep to avoid random entries.
when a signal is triggered, the tool automatically sets up entry, stop, and target levels. the entry happens at the bar close. the target and stop distances adjust based on which asset you selected (futures, gold, forex). the script draws the entry line, take-profit line, stop line, and also places a marker showing buy or sell direction. a trade table appears on the bottom right of the chart showing the signal type, entry price, stop distance, target distance, and real-time risk-to-reward ratio. if alerts are enabled, the trader will receive notifications for entry, stop hit, target hit, and automatic exit at 10:00 am et.
the built-in info panel provides live trading context:
• asset type currently selected
• session status (asian, london, pre-market, ny open, kill zone, etc)
• london sweep status (high swept, low swept, or both)
• current new york time displayed in am/pm format
• active sweep threshold and target parameters
• next expected market event such as asian open, london open, pre-market, ny open, kill zone start, session exit, or rth close
this gives traders a structured, real-time look at the market environment so they always know where they are within the trading day.
recommended usage:
• ensure the correct asset type is selected
• wait for london sweeps to occur (high, low, or both)
• watch for setups only inside the kill zone between 9:35 and 9:55 am et
• use the provided entry, stop, and target levels or refine according to your own risk rules
• always close trades by 10:00 am et since the morning algorithmic behaviour tapers off
• keep position sizing reasonable and follow your own risk management
important notes:
• the script does not place trades for you; it only signals
• it is tuned for intraday behaviour in the new york morning session
• performance outside the kill zone is intentionally limited
• sweep detection uses simplified logic for reliability and speed
• signals work best when combined with your own higher-timeframe bias or personal confirmation
this indicator is ideal for traders who follow ict concepts, smart money models, liquidity sweeps, kill zone execution, and structured session trading. it provides clean visuals, automated signals, and a complete on-screen trade model, making it easy to follow institutional trading behaviour without overcomplicating the chart.

MMM Flipper @MaxMaserati 3.0The MMM Flipper identifies zones where market control shifts between buyers and sellers. It detects aggressive moves that fail, followed by counter-reactions from the opposing side, marking these areas as potential reversal or reaction zones. When the opposing side responds with their own aggression, it marks these areas as potential reversal or reaction zones.
📊 How It Works
Aggressive Movement Detection
Bullish Body Close (BuBC): Price closes above previous high - Aggressive Buyers
Bearish Body Close (BeBC): Price closes/ below previous low - Aggressive Sellers
Failed Aggression Creates Opportunity
When aggression fails to sustain (doesn't fully close beyond the level), it reveals weakness and creates a setup.
Counter-Reaction Marks The Zone (PO4 Block)
When the opposing side responds aggressively, the failed aggression candle becomes a marked zone:
Failed BuBC → BeBC response = Bearish PO4 Block (sellers took control)
Failed BeBC → BuBC response = Bullish PO4 Block (buyers took control)
H1 PO4 view in M5
🎨 What PO4 Blocks Represent
Purple & Cyan boxes mark areas where:
One side showed aggression but failed, and the counterpart responded and took control. Price may reverse, continue, or retest later.
Think of them as: Areas of institutional interest, proven support/resistance zones, or control shift points.
Expander Breaker (DEFAULT)
Requires counter-reaction to fully close beyond the failed candle confirming that price expanded and completely absorb and overtake the opposite side.
Stricter: Both expansion AND complete break required
Fewer but higher probability signals
Only Expander
Creates zones immediately on first counter-reaction
No close requirement needed
More zones, earlier signals
🎯 MMM Swing High/Low (Proprietary Logic)
3-Candle Confirmation System that identifies strong, validated swing points:
MMM Swing High: Confirmed after 3 consecutive BeBC candles (sustained bearish aggression)
MMM Swing Low: Confirmed after 3 consecutive BuBC candles (sustained bullish aggression)
Why 3 candles? Ensures it's not noise—requires sustained directional movement proving true aggressiveness and market control.
CDL/CDS Signals
CDL: Price breaks above MMM Swing High → Bullish control shift
CDS: Price breaks below MMM Swing Low → Bearish control shift
These mark major structural changes in market direction.
USE CASE
PO4 block forms (counter-reaction confirms shift)
Wait for price to return to the zone
Look for rejection or support/resistance
Enter in direction of the counter-reaction
Risk Management:
Use failed aggression candles as stop-loss levels
Zone invalidated if price fully breaks through
Price Behavior:
Immediate: Price respects zone right away
Continuation: Keeps moving in counter-reaction direction
Later Retest: Returns to test zone hours/days later
Market has memory - these zones remain relevant over time.
🔄 Multi-Timeframe Analysis
Two independent timeframes (TF1 & TF2) allow you to:
See higher timeframe structure on lower timeframe charts
Identify confluence zones
Align trades with larger market forces
📝 Summary
The MMM Flipper reveals the battle between buyers and sellers:
One side shows aggression
That aggression fails or succeeds
The counterpart responds with their own aggression
A zone of control/reaction is marked
These zones represent where market dynamics shifted—powerful for identifying reversals, continuations, and key support/resistance. The proprietary MMM Swing logic ensures you're seeing true structural significance, not random noise.

Institutional Dominance & Trapped Trader @MaxMaserati 3.0 Institutional Dominance & Trapped Trader Delta Profile @MaxMaserati 3.0
═════════════════════════════════════════════════════════════
Overview
The IDT Auction Profile is a professional-grade volume order flow analysis tool that reveals where institutional traders hold Positional Advantage and where retail participants are Trapped. Unlike traditional Volume Profile indicators, the IDT Profile integrates Volume Point Delta (VPD) analysis with advanced pattern recognition to identify the exact price levels where profitable institutional positions create support/resistance, and where losing positions are forced to exit.
This indicator answers the critical questions: Who is in profit? Who is trapped? And where will they defend or exit their positions?
═════════════════════════════════════════════════════════════
Core Concept: Dominance vs Trapped Positioning
════════════════════════════════════════════════════════════TThe indicator categorizes all market participants into two strategic positions based on their entry price relative to current market price:
Above Current Price (Resistance Zones)
🔴 Aggressive Sellers in Profit - Sold higher, currently winning. Will defend positions or add to winners.
🟥 Trapped Buyers at Loss - Bought higher, currently losing. Must exit at breakeven, creating resistance.
Below Current Price (Support Zones)
🟢 Aggressive Buyers in Profit - Bought lower, currently winning. Will defend positions or add to winners.
🟩 Trapped Sellers at Loss - Sold lower, currently losing. Must cover at breakeven, creating support.
Maximum Confluence Zones
When Dominant (Profitable) and Trapped (Loss) positions align at the same level, you get the strongest support/resistance zones. These appear as:
🟧 Orange Boxes (Above Price) = Aggressive Sellers + Trapped Buyers = STRONGEST RESISTANCE
🟨 Yellow Boxes (Below Price) = Aggressive Buyers + Trapped Sellers = STRONGEST SUPPORT
═════════════════════════════════════════════════════════════
VOLUME ANALYSIS
═════════════════════════════════════════════════════════════
1. VPD Column (Volume Point Delta)
Net aggressive pressure at each price level (Buying Volume - Selling Volume).
Bullish Delta (Green): Buyers dominated the auction at this level
Bearish Delta (Red): Sellers dominated the auction at this level
Smart Coloring: Automatically highlights institutional patterns (icebergs, absorption, spikes, failed auctions)
2. VPS Column (Volume Point of Sell - ASK Volume)
Aggressive buying volume that "lifted the offer" by hitting ask prices.
Represents participants who paid the ask price to enter long
When price is below this level = These buyers are in profit
When price is above this level = These sellers who got hit are in profit
3. VPB Column (Volume Point of Buy - BID Volume)
Aggressive selling volume that "hit the bid" by taking bid prices.
Represents participants who sold at bid price to enter short
When price is above this level = These sellers are in profit
When price is below this level = These buyers who got hit are in profit
═════════════════════════════════════════════════════════════
🧠 ADVANCED INSTITUTIONAL PATTERNS DETECTION
═════════════════════════════════════════════════════════════
The indicator uses statistical analysis (standard deviation, moving averages, hit counting) to identify institutional footprints:
Failed Auctions ⚡
"BUYERS TRAPPED" or "SELLERS TRAPPED" labels
High volume entered, but price immediately reversed
Creates extreme concentrations of losing positions
Trading Implication: High-probability reversal zones where trapped participants must exit
Volume Spikes 📈📉
Bright green/red bars in VPD column
Volume exceeds average by 2+ standard deviations
Represents aggressive institutional entry
Trading Implication: Potential trend continuation or setup for failed auction
Absorption Zones 🛡️
Yellow/Orange colored bars
Large passive orders absorbing aggressive volume without price movement
Indicates accumulation (bullish) or distribution (bearish)
Trading Implication: Institutional positioning before major moves
Iceberg Orders 🧊
Cyan colored bars with high hit counts
Same price level shows repeated volume without clearing
Reveals hidden institutional limit orders split into small pieces
Trading Implication: Strong liquidity magnets, price often returns here
Volume Exhaustion 💜
Purple colored bars
Sharp volume drop (50%+) after spike
Momentum exhausted, participants depleted
Trading Implication: Potential reversal or consolidation ahead
═════════════════════════════════════════════════════════════
Colors bars based on detected patterns vs simple red/green
═════════════════════════════════════════════════════════════
Yellow = Bullish battles won
Orange = Bearish battles won
Cyan = Iceberg orders
Purple = Large passive orders
Bright Green = Buying spikes
Bright Red = Selling spikes
═════════════════════════════════════════════════════════════
Confluence Scoring ⭐
═════════════════════════════════════════════════════════════
Each price level receives 1-5 stars based on:
Volume spike presence (+2 stars)
Absorption pattern (+1 star)
Large passive orders (+1 star)
Proximity to Value Area (+1 star)
Iceberg detection (+2 stars)
Failed auction (+2 stars)
Minimum Signal Strength filter lets you show only levels with ★3+ confluence for highest-quality signals.
═════════════════════════════════════════════════════════════
📍 Value Area Analysis
═════════════════════════════════════════════════════════════
VAH (Value Area High) - Blue Line
Top of the 70% volume acceptance zone. Price at VAH often rejects downward.
VAL (Value Area Low) - Red Line
Bottom of the 70% volume acceptance zone. Price at VAL often bounces upward.
Trading Applications:
Price outside Value Area → Mean reversion opportunity
Price breaks VA with volume → Trend continuation
Price oscillates within VA → Range-bound, fade extremes
═════════════════════════════════════════════════════════════
EXPECTED PORICE BEHAVIOR AT KEY LEVELS
═════════════════════════════════════════════════════════════
⚠️ IMPORTANT: These are observed behavioral patterns for educational purposes and backtesting research. Always validate with 250-500+ backtest trades before risking capital. Use this indicator to enhance your existing strategy, not as a standalone system.
1. POC Box Zones (Highest Statistical Relevance)
═════════════════════════════════════════════════════════════
🟨 Yellow Boxes (Below Current Price)
Expected Behavior:
Price approaching from above typically encounters buying pressure
Both profitable institutional buyers and trapped short sellers create demand
Common reaction: Price slows, consolidates, or bounces
Failed bounces often lead to rapid breakdown (trapped buyers capitulate)
What Often Happens:
Initial dip into zone → Weak bounce attempt
Second test → Stronger bounce (trapped sellers covering + buyers defending)
Break below → Quick acceleration as both groups exit
Backtesting Focus:
Measure bounce success rate at ★3+ vs ★4-5 zones
Track how often price returns after initial rejection
Compare behavior during trending vs ranging markets
🟧 Orange Boxes (Above Current Price)
Expected Behavior:
Price rallying into zone typically encounters selling pressure
Both profitable institutional sellers and trapped long buyers create supply
Common reaction: Price stalls, consolidates, or rejects
What Often Happens:
Initial push into zone → Weak rejection
Second test → Stronger rejection (trapped buyers exiting + sellers defending)
Break above → Quick acceleration as resistance becomes support
Backtesting Focus:
Measure rejection success rate by confluence score
Track false breakouts vs genuine breakouts
Identify market conditions that favor breakouts vs reversals
2. Failed Auction Zones
═════════════════════════════════════════════════════════════
"SELLERS TRAPPED" Labels (Below Price)
Expected Behavior:
High-volume selling that immediately reversed = maximum trapped short positions
When price returns to this level, trapped sellers face pressure to cover
Typical pattern: Price approaches → Initial hesitation → Sharp bounce
Common Price Action:
First retest: Quick spike through level then immediate recovery
Subsequent retests: Stronger bounces as fewer trapped sellers remain
Level becomes support after trapped positions cleared
Backtesting Focus:
Success rate of bounces on first vs second retest
Time decay: Does signal strength diminish after X bars?
Volume characteristics during successful bounces
"BUYERS TRAPPED" Labels (Above Price)
Expected Behavior:
High-volume buying that immediately failed = maximum trapped long positions
Price returning forces trapped buyers to exit at breakeven
Typical pattern: Price approaches → Distribution → Rejection
Common Price Action:
First retest: Shallow penetration then swift rejection
Multiple retests: Weaker rallies as trapped positions cleared
Level becomes resistance until breakout occurs
Backtesting Focus:
How many retests before level breaks?
Volume profile changes on each successive test
Correlation with broader market direction
3. Value Area Dynamics
═════════════════════════════════════════════════════════════
Price Outside Value Area (VAH/VAL)
Expected Behavior:
Price beyond 70% volume zone = statistical outlier
Two outcomes: Mean reversion OR trend continuation
Key differentiator: Presence of confluence zones
Mean Reversion Pattern (No Strong Confluence):
Price extends 1-2% beyond VA → Typically reverts toward POC
Weak volume on extension → Higher probability of reversal
Price oscillates back into value area over several bars
Breakout Pattern (With ★4+ Confluence):
Price breaks VA with institutional patterns → Often continues
Strong volume + confluence = New value area forming
Old VA becomes reference point for pullbacks
Backtesting Focus:
Success rate of fades based on distance from VA
Confluence requirements for successful breakouts
Time of day / session impact on VA behavior
4. Iceberg Order Behavior
═════════════════════════════════════════════════════════════
Cyan Bars with High Hit Counts
Expected Behavior:
Repeated volume at same level = Large hidden order absorbing
Price typically "tests" iceberg multiple times before resolution
Two outcomes: Absorption complete (break) OR rejection (bounce)
Absorption Phase:
Price approaches → Slows near iceberg → Minimal movement
Volume increases but price range contracts
Acts as temporary support/resistance
Resolution Phase:
Iceberg filled → Sudden acceleration through level
Iceberg defended → Sharp rejection away from level
Post-resolution: Level often becomes support/resistance flip
Backtesting Focus:
Average number of tests before resolution
Volume characteristics when iceberg breaks vs holds
Timeframe impact on iceberg effectiveness
5. Volume Spike Patterns
═════════════════════════════════════════════════════════════
Bright Green/Red Bars (Institutional Aggression)
Expected Behavior:
Extreme delta spikes indicate institutional entry
Two scenarios: Continuation (spike in trend direction) OR Exhaustion (spike against trend)
Trend Continuation Spikes:
Spike + ★4+ confluence + aligned with trend = Often continues
Price may consolidate briefly then resume direction
These levels become support/resistance on pullbacks
Exhaustion Spikes:
Spike against trend + followed by reversal = Failed auction forming
High probability of "TRAPPED" label appearing
Often marks short-term extremes
Backtesting Focus:
Distinguish continuation vs exhaustion spikes
Success rate based on trend alignment
Time holding before reversal occurs
═════════════════════════════════════════════════════════════
💡 Best Practices
═════════════════════════════════════════════════════════════
Start with defaults (200 lookback, 60 rows, ★3 confluence, Classic colors, Smart Coloring ON)
Focus on POC boxes first - These are your highest-probability zones
Combine with price action - Use the profile to explain WHY support/resistance exists
Watch for alignment - Yellow/Orange boxes (both participant types) = strongest levels
Respect failed auctions - "TRAPPED" labels are extreme reversal setups
Use Value Area for context - Price outside VA = opportunity for mean reversion
Trust confluence scores - ★4-5 signals are institutional-grade setups
Adjust timeframe settings - Lower lookback for scalping, higher for position trading
🔧 Technical Notes
Calculation: Enhanced delta using OHLC and volume with wick ratio analysis
Updates: Real-time on every bar close
Performance: Optimized for up to 500 bars lookback and 250 price rows
Compatibility: Works on all symbols and timeframes
Indicator Unique Value
═════════════════════════════════════════════════════════════
Unlike standard Volume Profile indicators that only show where volume occurred,
the IDT Auction Profile:
✅ Separates bid vs ask volume to reveal true order flow
✅ Identifies who is profitable vs who is trapped at each level
✅ Detects institutional patterns (icebergs, absorption, failed auctions)
✅ Calculates confluence scores combining multiple factors
✅ Provides clear POC boxes showing exact institutional positioning
✅ Maps positional advantage rather than just volume density
This transforms Volume Profile from a historical volume chart into a strategic positioning map showing institutional dominance and trapped participants.
How to Integrate with Your Strategy
═════════════════════════════════════════════════════════════
✅ Proper Uses:
Entry refinement within your existing setups
Intelligent stop placement beyond institutional levels
Objective profit targets at next confluence zones
Trade filtering (only take setups at ★4+ zones)
Understanding market positioning before entry
❌ What It Cannot Do:
Predict direction with certainty
Replace risk management
Account for news/external events
Guarantee profitability
Work in all market conditions
Development Path (12-16 Weeks)
Weeks 1-2: Observation Only
Watch price behavior at key levels
Document patterns without trading
Weeks 3-8: Paper Trading
Simulate trades, track all metrics
Minimum 100 paper trades
Weeks 9-16: Small Size Testing
Minimal capital, real market conditions
Continue tracking, refine rules
After Proven Edge: Scale Position Sizing
Critical Disclaimers
⚠️ Past volume ≠ Future price action
⚠️ Institutional positions change rapidly - these are static snapshots
⚠️ No indicator works 100% - risk management is mandatory
⚠️ Market conditions change - adapt your approach
⚠️ Backtest with YOUR style, YOUR timeframe, YOUR risk tolerance
The indicator reveals WHERE institutions are positioned and HOW they might behave. YOU decide IF, WHEN, and HOW to trade that information.
Not financial advice. For educational and research purposes only.

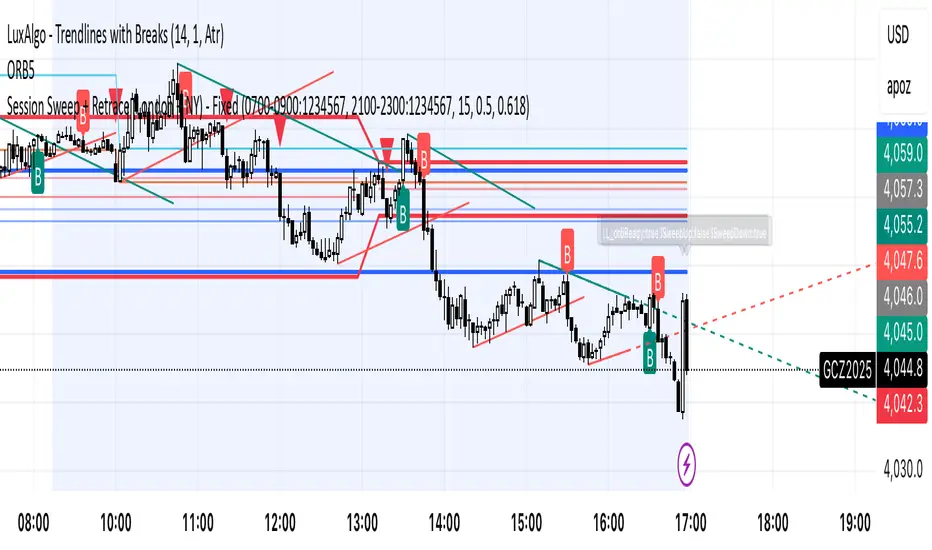
Session Sweep + Retrace (London + NY) - FixedORB Strategy with confluence. This sets out the 5 min session sweep from London and NY, and highlights a test back into the order zone with fib retracement.
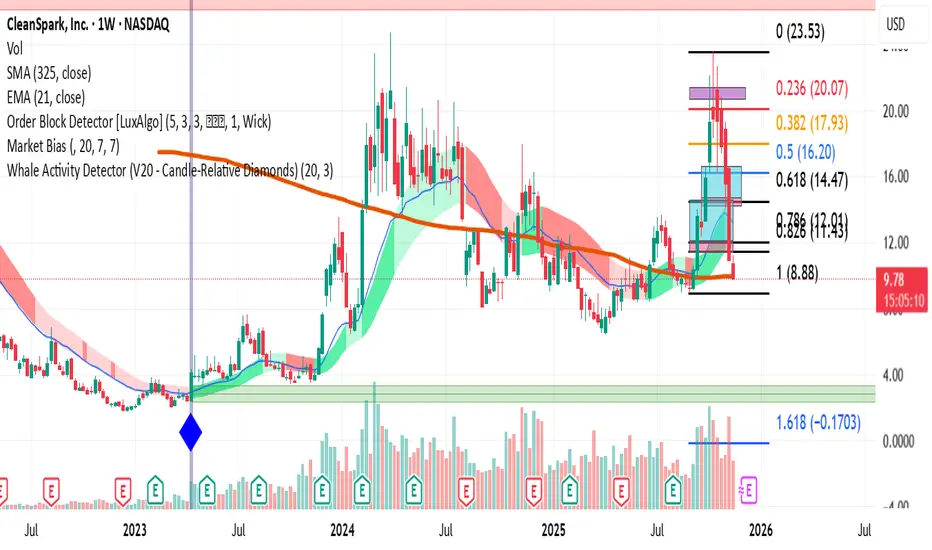
Whale Activity Detector (V20 - Candle-Relative Diamonds)This indicator is to visualize the "footprints" of large institutional traders, often referred to as "whales." By monitoring spikes in trading volume relative to a long-term average, the indicator flags moments when significant capital is entering or exiting the market.
How the Indicator Works (The Logic)
Volume Threshold : It calculates a Moving Average (MA) of the recent volume (default 20 bars). This average is then multiplied by a Spike Multiplier (default 3.0x) to create a dynamic threshold.
Spike Detection : Any price bar whose total volume exceeds this threshold is flagged as a potential "Whale Activity" bar.
Direction Confirmation : The color of the signal is determined by the price action of that bar (close > open for buying/accumulation, or close < open for selling/distribution).
RSI VWAP EMA ON CHART1. Understand the components
VWAP (Volume Weighted Average Price)
Green: price is above VWAP → bullish trend
Red: price is below VWAP → bearish trend
Blue: price exactly at VWAP → neutral
Acts as a dynamic trend line and support/resistance.
4 Moving Averages (MA1–MA4)
Customizable lengths and type (SMA or EMA).
Useful for trend confirmation and dynamic support/resistance.
Typically:
MA1 = fastest (short-term)
MA4 = slowest (long-term)
When price is above multiple MAs → strong bullish trend; below → bearish trend.
RSI Overlay with VWAP Alignment
RSI line normalized to price scale.
Background shading indicates momentum aligned with VWAP trend:
Green shading: RSI > 50 and price above VWAP → bullish momentum
Red shading: RSI < 50 and price below VWAP → bearish momentum
Gray areas: neutral or momentum does not align with VWAP.
2. Basic usage workflow
Trend Confirmation
Look at VWAP color: price above → bullish, below → bearish.
Check RSI + VWAP shading: green confirms bullish momentum, red confirms bearish momentum.
Check MA alignment: shorter MAs above longer MAs = stronger bullish trend; vice versa for bearish.
Entry Signals (Scalping)
Long (Buy) Setup
Price above VWAP (green)
RSI green shading (RSI > 50)
Shorter MAs above longer MAs (trend support)
Short (Sell) Setup
Price below VWAP (red)
RSI red shading (RSI < 50)
Shorter MAs below longer MAs
Exits / Stops
Exit if price closes against VWAP trend (e.g., price drops below VWAP during a bullish trade).
Use nearest MA support/resistance as stop-loss or take-profit zones.
3. Optional adjustments for scalping
RSI length / thresholds
Shorter RSI (7–10) → faster response for scalping.
Standard RSI (14) → smoother, fewer false signals.
MA lengths
Short-term: 20–50
Medium-term: 50–100
Long-term: 100–200
Can tweak for the timeframe you trade (1m, 5m, 15m).
Timeframe
VWAP works best on intraday charts (1m, 5m, 15m).
Use higher timeframe (e.g., 15m or 1h) for trend direction and lower timeframe (1m–5m) for entries.
4. Example Scalping Setup
Bullish setup (buy):
Price above VWAP → VWAP green
RSI > 50 and green shading
Shorter MAs above longer MAs
Enter on small pullback or breakout
Stop: below nearest MA or VWAP
Bearish setup (sell):
Price below VWAP → VWAP red
RSI < 50 and red shading
Shorter MAs below longer MAs
Enter on minor bounce or breakdown
Stop: above nearest MA or VWAP
5. Visual cues summary
Element Interpretation
VWAP Green Price above VWAP → bullish trend
VWAP Red Price below VWAP → bearish trend
RSI Green Shading Bullish momentum aligns with VWAP
RSI Red Shading Bearish momentum aligns with VWAP
MA Alignment Trend strength (short above long = bullish, short below long = bearish)

RT-Split VolumeSplit Volume is a volume analytics tool that separates estimated buy and sell volume for each bar, highlights abnormal activity, and makes it easier to see when larger participants may be stepping in or out of the market.
Split Volume Introduction
Traditional volume tools only show you the data for the candle that "won". This leaves traders in the dark about the balance between buying and selling behind each bar. Often a candle close is a photo finish between bulls and bears, and other times it is hardly a battle at all.
The Split Volume Indicator looks at both sides of the flow and identifies which volume candles have been flagged as anomalies compared with the surrounding volume bars. It is designed to provide additional context around where and how volume is flowing, rather than only showing total volume per candle.
Traditional Volume vs Split Volume
While volume is one of the most important signals a trader can watch, traditional volume indicators only show a single bar for each candle. Only looking at one side of the story puts the trader at a disadvantage. Sometimes the battle between the bears and the bulls is a photo finish, and sometimes it is hardly a battle at all.
In the comparison chart below, the middle pane shows TradingView's built in Volume indicator, while the lower pane shows Split Volume, so you can compare a single bar view with the split buy and sell view side by side.
Split Volume estimates buy and sell pressure separately and plots them on different halves of the panel. This gives a clearer picture of what is actually happening in the underlying order flow, not just which side closed the bar.
How Split Volume Works
The Split Volume Indicator uses an algorithm to estimate the buy and sell volume for each candle. All of the estimated buy volume is placed on the upper half of the indicator, while all of the estimated sell volume is placed on the lower half of the indicator.
As the bulls and bears trade back and forth on each candle, the algorithm also calculates a baseline average of the volume being traded over a rolling window. This dynamic baseline is shown by the gray Ghost Line.
When either the buy side or the sell side volume spikes well above that Ghost Line, the corresponding bars are flagged as abnormal. These abnormal spikes are color coded so they stand out against normal background activity.
Volume Candle Types
Green volume candles - Normal buying volume above the midline.
Blue volume candles - Abnormal buying volume above the Ghost Line.
Red volume candles - Normal selling volume below the midline.
Yellow volume candles - Abnormal selling volume below the Ghost Line.
Volume Impulses
One key pattern to watch with Split Volume is volume impulses: short bursts of concentrated activity that stand out from the Ghost Line baseline. These can be easy to miss with standard volume bars but become very obvious when normal and abnormal buy and sell flows are separated.
Settings
Volume in USD toggle On/Off - Switch between volume being displayed in USD or in the number of units (stocks or tokens) being traded. This change is reflected on the Y axis of the indicator.
Volume smoother - Changes the smoothness setting of the Ghost Line. Higher values make the baseline slower and smoother, and lower values make it more responsive to recent changes in activity.
Volume displacement shifter - Adjusts the vertical height of the Ghost Line. This lets traders control where they want abnormal blue and yellow volume candles to start triggering.
What Makes This Tool Different
Separates estimated buy and sell volume into their own zones instead of showing a single undifferentiated volume bar.
Uses a dynamic Ghost Line baseline so spikes are judged relative to recent activity, not a fixed threshold.
Highlights abnormal volume with clear color coding, making it easier to see when activity is concentrated on one side of the tape.
Emphasizes volume impulses and clusters that can precede or accompany larger moves, rather than only tracking total daily or session volume.
This indicator is intended to provide additional context around order flow and volume behavior. It is not a standalone signal generator and should always be used together with your own analysis, risk management and trading plan. Historical volume patterns do not guarantee future results.
🐋 Tight lines and happy trading!

VWAP + 4 MAs with RSI Overlay & VWAP Alignment1. Understand the components
VWAP (Volume Weighted Average Price)
Green: price is above VWAP → bullish trend
Red: price is below VWAP → bearish trend
Blue: price exactly at VWAP → neutral
Acts as a dynamic trend line and support/resistance.
4 Moving Averages (MA1–MA4)
Customizable lengths and type (SMA or EMA).
Useful for trend confirmation and dynamic support/resistance.
Typically:
MA1 = fastest (short-term)
MA4 = slowest (long-term)
When price is above multiple MAs → strong bullish trend; below → bearish trend.
RSI Overlay with VWAP Alignment
RSI line normalized to price scale.
Background shading indicates momentum aligned with VWAP trend:
Green shading: RSI > 50 and price above VWAP → bullish momentum
Red shading: RSI < 50 and price below VWAP → bearish momentum
Gray areas: neutral or momentum does not align with VWAP.
2. Basic usage workflow
Trend Confirmation
Look at VWAP color: price above → bullish, below → bearish.
Check RSI + VWAP shading: green confirms bullish momentum, red confirms bearish momentum.
Check MA alignment: shorter MAs above longer MAs = stronger bullish trend; vice versa for bearish.
Entry Signals (Scalping)
Long (Buy) Setup
Price above VWAP (green)
RSI green shading (RSI > 50)
Shorter MAs above longer MAs (trend support)
Short (Sell) Setup
Price below VWAP (red)
RSI red shading (RSI < 50)
Shorter MAs below longer MAs
Exits / Stops
Exit if price closes against VWAP trend (e.g., price drops below VWAP during a bullish trade).
Use nearest MA support/resistance as stop-loss or take-profit zones.
3. Optional adjustments for scalping
RSI length / thresholds
Shorter RSI (7–10) → faster response for scalping.
Standard RSI (14) → smoother, fewer false signals.
MA lengths
Short-term: 20–50
Medium-term: 50–100
Long-term: 100–200
Can tweak for the timeframe you trade (1m, 5m, 15m).
Timeframe
VWAP works best on intraday charts (1m, 5m, 15m).
Use higher timeframe (e.g., 15m or 1h) for trend direction and lower timeframe (1m–5m) for entries.
4. Example Scalping Setup
Bullish setup (buy):
Price above VWAP → VWAP green
RSI > 50 and green shading
Shorter MAs above longer MAs
Enter on small pullback or breakout
Stop: below nearest MA or VWAP
Bearish setup (sell):
Price below VWAP → VWAP red
RSI < 50 and red shading
Shorter MAs below longer MAs
Enter on minor bounce or breakdown
Stop: above nearest MA or VWAP
5. Visual cues summary
Element Interpretation
VWAP Green Price above VWAP → bullish trend
VWAP Red Price below VWAP → bearish trend
RSI Green Shading Bullish momentum aligns with VWAP
RSI Red Shading Bearish momentum aligns with VWAP
MA Alignment Trend strength (short above long = bullish, short below long = bearish)

1x RVOL Bull/Bear Painter v2Relative volume candle indicator registers bull and bear relative volume, at a threshold of 1 or greater. This can be modified to your liking. Use this to enter a strong trend on any time frame.

SWUltimate Sniper: SMT + AO + Money Flow
Overview This indicator is a comprehensive trading system designed to identify high-probability reversal points by combining three powerful concepts: Smart Money Techniques (SMT), Awesome Oscillator (AO) Momentum Divergences, and Macro Money Flow Analysis. It aims to filter out false signals by requiring confirmation from multiple technical factors before generating a signal.
Key Features & Logic
1. SMT Divergence (Smart Money Tool) The core of this indicator compares the current asset's price structure (Highs and Lows) against a benchmark symbol (Default: BTCUSDT).
Bullish SMT: When Bitcoin makes a Lower Low (LL), but the Altcoin makes a Higher Low (HL). This suggests underlying strength and accumulation in the Altcoin despite BTC's weakness.
Bearish SMT: When Bitcoin makes a Higher High (HH), but the Altcoin makes a Lower High (LH). This suggests weakness and distribution in the Altcoin despite BTC's strength.
2. Awesome Oscillator (AO) Confirmation To prevent premature entries based solely on price action, the indicator checks for momentum divergence on the Awesome Oscillator.
If the "AO Filter" option is enabled in settings, a signal (triangle) will only appear if both SMT Divergence and AO Divergence occur simultaneously (or within the same pivot window). This significantly increases the reliability of the setup.
3. Money Flow Dashboard A dashboard in the top-right corner provides real-time macro context to ensure you are trading with the trend.
USDT.D (Tether Dominance): Monitors whether capital is entering (Bullish) or leaving (Bearish) the crypto market.
BTC.D (Bitcoin Dominance): Monitors whether capital is flowing into Bitcoin or rotating into Altcoins (Altcoin Season).
How to Use
Buy Signal (Green Triangle): Look for a Green Triangle below the bar. Ideally, confirm this with the Dashboard showing "Money Flow: Entering" (Green) and "Trend: Flowing to Alts" (Green).
Sell Signal (Red Triangle): Look for a Red Triangle above the bar.
Dashboard: Use the dashboard as a trend filter. Do not long an Altcoin if USDT.D is spiking (Market Bearish).
Settings
Comparison Symbol: Select the benchmark asset (Default: BTCUSDT).
Pivot Period: Adjust the sensitivity of the divergence detection.
Use AO Filter: Toggle ON/OFF to require Awesome Oscillator confirmation for signals.
Dashboard: Toggle the visibility of the Money Flow panel.

Dobrusky Pressure CoreWhat it does & who it’s for
Dobrusky Pressure Core is a volume by time replacement for traders who care about which side actually controls each bar. Instead of just plotting total volume, it splits each bar into estimated buy vs sell pressure and overlays a custom, session-aware volume baseline. It’s built for discretionary traders who want more nuanced volume context for entries, breakouts, and pullbacks.
Core ideas
Buy/sell pressure split: Each bar’s volume is broken into estimated buying and selling pressure.
Dominant side highlighting: The dominant side (buy or sell) is always displayed starting from the bottom of the bar, so you can quickly see who “owned” that bar.
Median-based baseline: Uses the median of the last N bars (50 by default) to build a robust volume baseline that’s less sensitive to one-off spikes.
Session-aware behavior: Baseline is calculated from Regular Trading Hours (RTH) by default, with an option to include Extended Hours (ETH) and a control to force Regular data on higher timeframes.
Volume regimes: Three multipliers (1x, 1.5x, 2x by default) show normal, high, and extreme volume regions.
Flexible display: Baseline can be shown as lines or as columns behind the volume, with full color customization.
How the pressure logic works
For each bar, the script:
Adjusts the range for gaps relative to the prior close so the “true” traded range is more consistent.
Computes buy pressure as a proportion of the adjusted range from low to close.
Defines sell pressure as: total volume minus buy pressure.
Marks the bar as buy-dominant if buy pressure ≥ sell pressure, otherwise sell-dominant, and colors the dominant side from the bottom to at least the midpoint using the selected buy/sell colors.
In practice, this turns basic volume columns into bars where the internal split and dominant side are clearly visible, helping you judge whether aggressive buyers or sellers truly controlled the bar instead of just looking at the price action.
Volume baseline & session logic
The script builds a session-aware baseline from recent volume:
Baseline length: A rolling window (default 50 bars) is used to compute a median volume value instead of a simple moving average.
RTH-only by default: By default, the baseline is built from Regular Trading Hours bars only. During extended hours, the baseline effectively “freezes” at the last RTH-derived value unless you choose to include extended session data.
Extended mode: If you select Extended mode, the script builds separate rolling baselines for RTH and ETH trading, using the appropriate one depending on the current session.
Force Regular Above Timeframe: On timeframes equal to or higher than your chosen threshold, the baseline automatically uses Regular session data, even if Extended is selected.
Multipliers: Three adjustable multipliers (1x, 1.5x, 2x by default) create normal, high, and extreme volume bands for quick identification.
This lets you choose whether you want a pure RTH reference or a baseline that adapts to extended-session activity.
Example ways to use it
1. Replace standard volume bars
Add Dobrusky Pressure Core to your volume pane and hide the default volume if you prefer a clean look.
Use the colors and split to see at a glance whether buyers or sellers were dominant on each bar.
2. Pressure confirmation for entries
For longs (example concept; adapt to your own rules):
Require that the entry bar’s buy pressure is greater than the previous bar’s sell pressure , or
If the entry and prior bar are both buy-dominant, require that the entry bar has more buy pressure than the prior bar.
This helps avoid taking a long when buying pressure is clearly fading relative to what sellers recently showed. A mirrored idea can be used for short setups with sell pressure.
3. Context from baseline multipliers
Use ~1x baseline as “normal” volume.
Watch for bars at or above 1.5x baseline when you want to see increased participation.
Treat 2x baseline and above as “extreme” volume zones that may mark climactic or especially important bars.
In practice, the baseline and multipliers are best used as context and filters, not as rigid rules.
Settings overview
Display
- Show Volume Baseline: toggle the baseline and its levels on or off.
- Baseline Display: choose between Line or Bars for the baseline visualization.
Baseline Calculation
- Length: lookback for the median baseline (default 50, configurable).
- Baseline Session Data: choose Regular or Extended to control which session data feeds the baseline.
Session Controls
- Regular Session (Local to TZ): define your RTH window (e.g., 0930-1600).
- Session Time Zone: choose the time zone used for that window.
- Force Regular Above Timeframe: on higher timeframes, force the baseline to use Regular session data only.
Baseline Levels
- Show Level x Multiplier 1/2/3: toggle each volume regime level.
- Multiplier 1/2/3: define what you consider normal, high, and extreme volume (defaults: 1.0, 1.5, 2.0).
Colors
- Buy Volume / Sell Volume: choose colors for buy and sell pressure.
- Baseline Bars (Base / x2 / x3): colors when the baseline is drawn as columns.
- Baseline Line (Base / x2 / x3): colors when the baseline is drawn as lines.
Limitations & best practices
This is a decision-support and visualization tool, not a buy/sell signal generator.
Best suited to markets where volume data is meaningful (e.g., index futures, liquid equities, liquid crypto).
The usefulness of any volume-based metric depends on the underlying data feed and instrument structure.
Always combine pressure and baseline context with your own strategy, risk management, and testing.
Originality
Most volume tools either show total volume only or compare it to a simple moving average. Dobrusky Pressure Core combines:
An intrabar buy/sell pressure split based on a gap-adjusted price range.
A median-based, configurable baseline built from session-specific data.
Session-aware behavior that keeps the baseline focused on Regular hours by default, with the option to incorporate Extended hours and force Regular data on higher timeframes.
The goal is to give traders a richer, session-aware view of participation and pressure that standard volume bars and simple SMA overlays don’t provide, while keeping everything transparent and open-source so users can review and adapt the logic.

ueuito VWAP + VWAP Previous Day EndThis script is a fully featured VWAP indicator, based on the standard Volume-Weighted Average Price formula used by professional traders. It calculates the VWAP anchored to the selected period and also provides optional standard deviation or percentage-based bands.
In addition to the traditional VWAP logic, this version introduces an important enhancement:
⭐ Previous Day VWAP Closing Line (New Feature)
The script automatically calculates the final VWAP value of the previous trading day and plots it as a horizontal line at the start of each new session.
This line remains visible throughout the current day, allowing traders to quickly identify where the market closed relative to the VWAP on the prior day.
This added feature provides several advantages:
Highlights a key institutional reference level that is often used for mean-reversion setups.
Allows intraday traders to compare current price action with the previous session’s VWAP benchmark.
Helps identify support/resistance behavior around the prior VWAP close.
The line is customizable with options for:
Color
Width
Style (solid, dashed, dotted)
On/off toggle
✔ Summary of Features
Standard VWAP calculation with optional session or custom anchors
Three optional VWAP bands (standard deviation or percentage based)
Fully configurable appearance settings
Previous Day VWAP Closing Line added as a key enhancement
Works on any intraday timeframe
Automatically resets at the start of each trading session

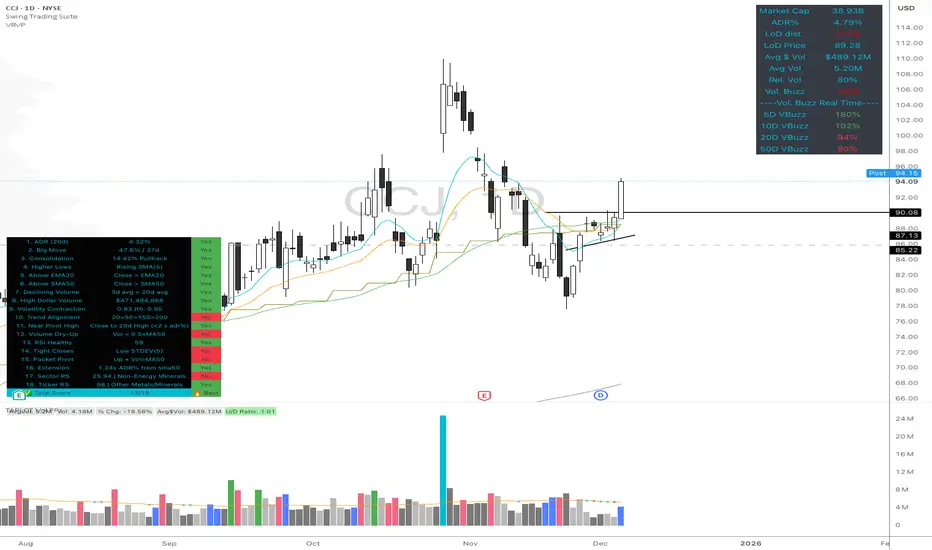
High Quality Setup Detector (Ultimate Edition)High Quality Setup Detector (Ultimate Edition)
A complete, rules-based detector for identifying elite high-probability trading setups based on volatility contraction, trend alignment, volume behavior, RS strength, and classic breakout conditions.
This script consolidates multiple proven technical concepts into one unified scoring system — giving traders a fast, objective way to evaluate the overall quality of any chart.
🔍 What This Tool Does
The indicator evaluates 16–18 technical conditions (depending on whether RS is enabled) and assigns each chart a Total Quality Score.
You instantly see:
✔ ADR volatility quality
✔ Big move + constructive pullback
✔ Higher lows (constructive structure)
✔ Trend alignment (20/50/150/200)
✔ Dollar volume strength
✔ Volatility contraction (ATR ratio)
✔ Volume dry-up before breakout
✔ RSI health
✔ Pocket pivot
✔ Extension from the 50-day
✔ Near pivot high
✔ Optional: Sector RS + Ticker RS
The result appears in a clean, color-coded table displayed on-chart.
🎯 Scoring System
Every condition is worth 1 point.
Based on your total score:
🔥 Best Setup — high probability
🟡 Good Setup — decent but not top-tier
🔴 Weak — avoid
This helps keep you disciplined and objective, even during choppy markets.
📊 RS Rating System (Optional)
Enable RS to compute:
Sector RS strength using mapped sector ETFs
Ticker RS strength using a percentile-based multi-quarter performance model
Both follow a full 1–99 rating scale.
🧩 Customizable Display
Adjustable text size (Tiny → Huge)
Clean 3-column diagnostics table
Organized into logical categories (Trend, Volume, Volatility, RS, etc.)
💡 Ideal For
Growth traders
Breakout traders
VCP / volatility contraction pattern traders
Swing traders who want rule-based confirmation
Anyone who wants structured, systematic chart evaluation
Support & Resitance LinesIntroduction:
Support & Resistance levels are time consuming to mark on charts. They also must be maintained. If the user has multiple charts they analyze, this adds to the workload. This indicator attempts to automate that work flow for the user.
Description:
Psychological Support and Resistances
are marked with a horizontal ray and labeled.
Levels marked include the 1 Month, 1 Week, and the Daily.
If a candle closes on the marked levels, the horizontal ray marking that level will disappear.
Volume Based Support and Resistances [/i
With the fixed range volume profile tool, marked levels include the point of control(POC) and the Value Areas (VA). This includes both the Value Area Low (VAL) and the Value Area High (VAH). Levels marked include the 1 Year, 6 Month, and the 1 Month fixed range volume profile.
If a candle closes on the marked levels, the horizontal ray marking that level will disappear.
How to use:
1) Turn on indicator and make sure you are on the 1D time frame.
2) Find areas of high confluence and mark with rectangular box.
3) Once all areas are marked, turn off indicator to save CPU time.
4) It is now ready to use and you can scan the chart using multiple time frames.
Useful Tips:
1) Use this tool to see if these levels marked are respected in forward testing.
2) You can turn off labels and color code horizontal rays to make tool run more efficiently for the CPU.
3) Use RSI, MACD, Wave Trend with Crosses , or any other oscillator to identify divergences once price hits support & resistance. Observe if price reacts.
4) Confluence is key, the higher the confluence, the better.
Montosca's Volume Delta Volume Delta Montosca - Indicator Summary
Volume Delta Montosca is a specialized Pine Script indicator for TradingView designed to analyze buying and selling pressure within each candle. It focuses on identifying high-impact volume events combined with strong directional dominance.
Key Features
1. Volume Delta Visualization
Displays volume bars split into Buy Volume (Blue) and Sell Volume (Red).
Includes centered text labels inside the bars showing the exact percentage of buy and sell volume for clear readability.
2. Signal Generation Logic (Triangles)
The indicator generates Buy (Blue Triangle) and Sell (Red Triangle) signals based on two strict criteria that must be met simultaneously:
Criterion A: Significant Volume (SMA Filter)
The current candle's volume must exceed a dynamic threshold.
This threshold is calculated using a Simple Moving Average (SMA) of the volume (e.g., 20 periods) multiplied by a user-defined Adjustment Factor (e.g., 150%).
Example: If the factor is 150%, the volume must be 1.5x higher than the average.
Criterion B: Directional Dominance
The candle must show strong internal conviction.
The Buy Percentage (for long signals) or Sell Percentage (for short signals) must exceed a specific Dominance Threshold (e.g., 70%).
3. Simplified Analysis
Alerts: Integrated alert conditions for both Buy and Sell signals for automated trading or notifications.