VXN Net VolumeThis indicator is based on other open source scripts. It displays net volume (buying minus selling) approximated from lower timeframe data, helping traders gauge buying/selling pressure.
It uses the CBOE Nasdaq Volatility Index (VXN) to color the chart background: green for low volatility (bullish) when VXN's short-term EMA is below its long-term SMA, and red for high volatility (bearish) when above.
The net volume color is not filtered by the VXN Index trend direction (background color). It’s highly recommended to align with the VXN Index trend direction when using net volume to confirm your entry. A red net volume with a red background or a green net volume with a green background provides a high-probability setup.
A moving average of net volume is optionally plotted as a blue area to highlight significant volume levels.
Enjoy this indicator? Consider a donation to support development! buymeacoffee.com
VXN
VXN filtered CHOCH Pattern LevelsThis indicator is based on other open source scripts. It identifies Change of Character (CHOCH) patterns on Nasdaq futures (NQ and MNQ) charts, using pivot points to detect potential trend reversals.
Signals (horizontal levels) are filtered by VXN background color: bullish levels only on green background, bearish on red.
If a CHOCH occurs on the wrong background, it is remembered (pending), and triggered when the background aligns. The last CHOCH signal is remembered to avoid wasting it.
It plots horizontal levels anchored to the extreme points of CHOCH patterns (lowest low for bullish, highest high for bearish), using the labeling and line-drawing style from the VXN Anchored VWAP indicator.
Lines are drawn as polylines (horizontal) with labels at the anchor point and current bar showing the level value.
The VXN index provides background color for market sentiment (green for bullish, red for bearish).
Historical levels are plotted semi-transparently when a new filtered signal is confirmed (on detection if aligned or on trigger).
Enjoy this indicator? Consider a donation to support development! buymeacoffee.com
VXN Choch Pattern LevelsThis indicator is based on other open source scripts. It identifies and visualizes Change of Character (ChoCh) patterns on Nasdaq futures (NQ and MNQ) charts, using pivot points and the CBOE VXN index (Nasdaq-100 Volatility Index) to detect potential trend reversals.
It plots bullish and bearish ChoCh patterns with triangles, horizontal lines, and volume delta information.
The indicator uses VXN EMA and SMA to set a background color (green for bullish, red for bearish) to contextualize market sentiment.
Key features include:
- Detection of pivot highs and lows to identify ChoCh patterns.
- Visualization of patterns with polylines, labels, and horizontal lines.
- Optional display of volume delta for each pattern.
- Management of pattern zones to limit the number of displayed patterns and remove invalidated ones.
- Bullish/bearish triangle signals triggered by VXN EMA/SMA crossovers for confirmation.
VXN EMA BandThis indicator is based on other open source scripts. It's designed for Nasdaq futures (NQ or MNQ). It plots an EMA Band consisting of three exponential moving averages (EMAs) with a period of 96, each using a different price source: low, (high + low + close)/3, and high. The EMAs are colored to indicate their source: darkest turquoise for the low-based EMA, medium turquoise for the (high + low + close)/3-based EMA, and lightest turquoise for the high-based EMA. This visual distinction helps traders identify price trends relative to these key levels.
The indicator also includes background coloring based on the VXN index direction (using CBOE:VXN) to highlight bullish or bearish market conditions. A bullish trend is suggested when the EMAs are aligned (EMA-High above EMA-Mid above EMA-Low) and the VXN EMA is below its SMA, indicated by a green background. A bearish trend is suggested when the EMAs are aligned (EMA-High below EMA-Mid below EMA-Low) and the VXN EMA is above its SMA, indicated by a red background.
VXN OBV Traffic LightsThe VXN OBV Traffic Lights indicator is based on other open source scripts. It's designed for Nasdaq futures (NQ/MNQ) uses On-Balance Volume (OBV) to gauge buying and selling pressure, filtered by the VXN (CBOE Nasdaq Volatility Index) trend. OBV accumulates volume based on price direction: positive volume when the Heikin Ashi smoothed close rises, negative when it falls, and zero when unchanged. Three EMAs (fast, medium, slow) of OBV act as "traffic lights" to signal momentum strength, with a Donchian baseline providing a midpoint reference. Buy/sell signals are visually reinforced when OBV crosses its slow EMA, colored green (bullish) or red (bearish). The VXN trend (EMA vs. 200-period SMA) sets the background: green for bullish (lower volatility, VXN EMA < SMA) or red for bearish (higher volatility, VXN EMA > SMA), helping traders align trades with market conditions.
VXN Stochastic Momentum Index with double EMA smoothingThis indicator is based on other open source scripts. It's designed for trading Nasdaq futures (NQ and MNQ). It uses the Stochastic Momentum Index (SMI) with double EMA smoothing to measure price momentum relative to the high-low range, combined with the VXN index (CBOE Nasdaq Volatility Index) to filter signals via background color.
SMI: Measures the distance of the price from the midpoint of the high-low range, double-smoothed with EMAs, and scaled to oscillate between -100 and +100. Overbought (+40) and oversold (-40) levels, with extreme max/min levels (+75/-75), help identify potential reversals.
Signals: Bullish signals occur on SMI crossing above the signal line, breaking above the oversold level (-40), or crossing above zero, especially when the VXN background is green (VXN 1-period EMA < 200-period SMA). Bearish signals occur on SMI crossing below the signal line, breaking below the overbought level (+40), or crossing below zero, when the background is red (VXN EMA > SMA).
VXN Filter: When enabled, the background is green (bullish) when VXN EMA < SMA, and red (bearish) when EMA > SMA. Alternatively, zero-line crossovers can set the background (green for SMI > 0, red for SMI < 0).
Usage: Apply this indicator to a Nasdaq futures chart in TradingView’s indicator pane (not overlayed). Use SMI crossovers, overbought/oversold breakouts, or zero-line crossovers for trade signals, confirmed by VXN background (green for long, red for short). Adjust parameters for sensitivity.
Note: Ensure VXN data is available in TradingView to avoid fallback to chart’s close price, which may skew sentiment. Use the debug option to verify VXN data.
VXN Money Flow IndexThis indicator is based on other open source scripts. It's designed for trading Nasdaq futures (NQ and MNQ). It generates trading signals using the Money Flow Index (MFI), which measures buying and selling pressure based on price and volume. The VXN index (CBOE Nasdaq Volatility Index) filters signals to align with market sentiment.
- MFI Signals: Bullish signals occur when MFI crosses above the 20 level (oversold) and the VXN background is green (bullish sentiment). Bearish signals occur when MFI crosses below the 80 level (overbought) and the VXN background is red (bearish sentiment).
- VXN Filter: The background is green when the VXN 1-period EMA is below the 200-period SMA (bullish), and red when the EMA is above the SMA (bearish).
Usage: Apply this indicator to a Nasdaq futures chart in TradingView. Take long trades on MFI crossovers above 20 when the background is green, and short trades on MFI crossunders below 80 when the background is red. Signals are plotted as triangles on the price chart.
VXN RSI VWAP basedThis indicator is based on other open source scripts. It's designed for trading Nasdaq futures (NQ and MNQ). It generates trading signals based on the Relative Strength Index (RSI) calculated from multiple VWAP-based price series with different lengths. The VXN index (CBOE Nasdaq Volatility Index) is used to filter signals via background color.
- RSI Signals: Bullish signals occur when any RSI crosses above the 20 level (oversold), and bearish signals occur when any RSI crosses below the 80 level (overbought). These are plotted as green/red circles.
- VXN Filter: Traders should only take bullish signals (RSI > 20) when the background is green (VXN 1-period EMA < 200-period SMA, indicating bullish sentiment) and bearish signals (RSI < 80) when the background is red (VXN 1-period EMA > 200-period SMA, indicating bearish sentiment).
- Additional Signals: Optional signals are generated when all RSI lines are simultaneously bullish (green) or bearish (red), plotted as triangles if enabled.
Usage: Apply this indicator to a Nasdaq futures chart (NQ or MNQ) in TradingView. Wait for RSI crossovers above 20 when the background is green for long trades, and crossunders below 80 when the background is red for short trades. Adjust VWAP lengths, RSI length, and VXN settings to suit your trading strategy.
VXN VWAP & TWAPThis indicator is based on other open source scripts. It's designed for trading Nasdaq futures (NQ and MNQ). It provides directional guidance by combining the VXN index (CBOE Nasdaq Volatility Index) with VWAP and TWAP.
- VXN: Helps assess market volatility and sentiment for Nasdaq futures. A 1-period EMA and 200-period SMA of VXN are used to determine bullish (EMA < SMA) or bearish (EMA > SMA) conditions, visualized via background color.
- VWAP: Calculates the volume-weighted average price, serving as a dynamic support/resistance level. Its direction (rising or falling) indicates bullish or bearish momentum.
- TWAP: Calculates the time-weighted average price over a user-defined anchor period, useful for identifying average price trends over time.
Usage: Traders should align their trades with the direction of VWAP and TWAP (green for bullish, red for bearish) and use the VXN EMA vs. SMA crossover to confirm market sentiment (green background for bullish, red for bearish).
VXN EMA RibbonThis indicator is based on other open source scripts. It's designed for Nasdaq futures (NQ or MNQ). It plots an EMA Ribbon with multiple exponential moving averages to identify trends, with background coloring filtered by the VXN index direction to highlight bullish or bearish market conditions. Users should go bullish when all EMAs are aligned (shorter EMAs above longer EMAs) and match a bullish VXN direction, or bearish when all EMAs are aligned (shorter EMAs below longer EMAs) and match a bearish VXN direction.
VXN MACDThis indicator is based on other open source scripts. It's designed for Nasdaq futures (NQ or MNQ). It is a MACD indicator that generates buy/sell signals based on MACD crossovers, filtered by the VXN index direction to align with bullish or bearish trends.
VXN Darvas BoxThis indicator is based on other open source scripts. It's designed for Nasdaq futures (NQ or MNQ). It is based on the Darvas Box concept, plotting boxes to identify price breakouts, with buy/sell signals filtered by the VXN index direction to align with bullish or bearish trends.
VXN UT Bot AlertsThis indicator is based on other open source scripts. It's designed for use with Nasdaq futures (NQ or MNQ). It generates buy/sell signals based on a trailing stop mechanism, filtered by the VXN index direction to eliminate signals that do not align with the VXN trend (bullish or bearish).
Volatility Inverse Correlation CandleThis is an educational tool that can help you find direct or inverse relations between two assets.
In this case I am using VIX and SPX .
The way it works is the next one :
So I am looking at the current open value of VIX in comparison with the previous close ( if it either above or below) and after on the SPX I am looking into the history and see for example which type of candle we had in respect with the opening value from VIX .
So for example, lets imagine that today is monday, and the weekly open value from VIX was higher than previous friday close value. Now I am going to see with the inverse correlation , if based on this idea, the current weekly candle from SPX finished in a bear candle.
The same can be applied for the bearish situation, so if we had an open from VIX lower than previous close, we are looking to check the SPX bull candle accuracy.
At the same time, for a different type of calculation I have added an internal lookup into heikin ashi values.
If you have any questions please let me know !
Full Volatility Statistics and Forecast
This is a tool designed to translate the data from the expected volatility of different assets, such as for example VIX, which measures the volatility of SP500 index.
Once get the data from the volatility asset we want to measure(for this test I have used VIX), we are going to translate it the required timeframe expected move by dividing the initial value into :
252 = if we want to use the daily timeframe, since there are ~252 aproximative daily trading days
52 = if we want to use the weekly timeframe, since there 52 trading weeks in a year
12 = if we want to use the monthly timeframe, since there are 12 months in a year
For this example I have used 252 with the daily timeframe.
In this scenario, we can see that we had 5711 total cnadles which we analysed, and in this case, we had 942 crosses, where the daily movement ended up either above or below the channel made from the opening daily candle value + expected movement from the volatility, giving as a total of 16.5% of occurances that volatility was higher than expected, and in 83.5% of the times, we can see that the price stayed within our channel.
At the same time, we can see that we had 6 max losses in a row ( OUT) AND 95 max wins in a row (IN), and at the same time in those moments when the volatility crosses happen we had a 0.51% avg movements when the top crossed happened, and 0.67% avg movements when the bot happened.
Lastly on the second part of the panel, we had E which means the expected movement of today, for example it has 61.056$ , so lets say price opened on 4083, our top is 4083 + 61 and our bot is 4083 - 61 ( giving us the daily channel). At continuation we can see that overall the avg bull candle os 0.714% and avg bear candle was 0.805% .
I hope this tool will help you with your future analysis and trades !
If you have any questions please let me know !
VIX Strategy : Risk-ON, Risk-OFF
VRatio is the ratio of VIX3M and VIX. This ratio rises above 1.1; in a bear market, it decreases and goes below 1. VRatio=VIX3M/VIX. More details in Part 2.
VRatio > 1: Risk-On signal
Contango is the ratio of VX2 (first back-month contract) and VX1 (front-month contract) minus one. In a bull market, this indicator rises above 5%’ in a downtrend market, this indicator goes below -5%. More details in Part 2.
Contango > -5%: Risk-On signal
Contango Roll is the ratio of VX2 first back-month contract) and the VIX minus one. In a bull market, this indicator rises above 10%’ in a downtrend market, this indicator goes below -10%. More details in Part 2.
Contango Roll > 10%: Risk-On signal
Volatility Risk Premium (VRP) compares the implied volatility to the recent realized volatility; it attempts to quantify how much “extra” premium (in volatility term) S&P500 option sellers are charging investors for the protection of their portfolio. It can be seen as an insurance premium. A simple way to compute the VRP is VRP= VIX -HV10 where HV10 is the 10-day historical volatility of S&P500. Some people also look at the 5-day moving average of the VRP to smooth this indicator.
VRP > 0: Risk-On signal
Fast Volatility Risk Premium (FVRP) is a variant of the VRP. FVRP=EMA(VIX,7)-HV5 where HV5 the 5-day historical volatility of S&P500.
FVRP > 0: Risk-On signal
Volatility Momentum compares today’s VIX to last 50 days. It has, therefore, quite a bit of lag but it is a useful measure when combined with other indicators. Volatility Momentum=SMA(VIX,50) -VIX.
Volatility Momentum > 0: Risk-On signal
VIX Mean Reversion looks at today’s VIX compared to certain thresholds. We avoid investing in the S&P500 when the VIX is too high (above 20) or too low (below 12).
VIX Mean Reversion > 12 and VIX Mean Reversion < 20: Risk-On signal
VIX3M Mean Reversion works the same way as VIX Mean Reversion.
VIX3M Mean Reversion > 12 and VIX3M Mean Reversion < 20: Risk-On signal
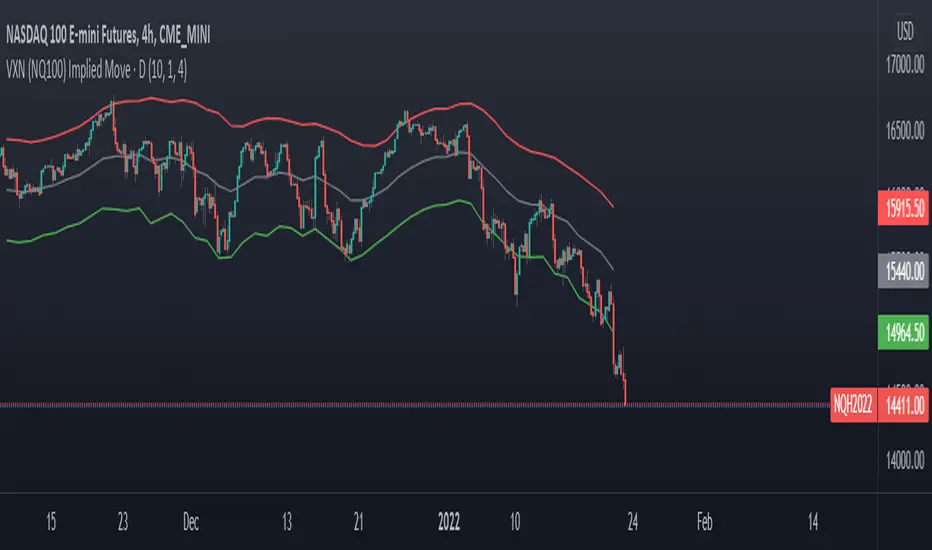
VXN (NQ100 VIX) Implied Move Bands for NQ futures.A spin-off of my similar script for ES futures. This script uses the VXN Index instead of the VIX, which represents the 30-day implied volatility of Nasdaq-100 options and then uses that value to plot bands on the chart, helping traders identify price extremes as identified by the options market. Users can modify the moving average, bands multiplier, and number of lookback days used in the calculation to suit their trading style.
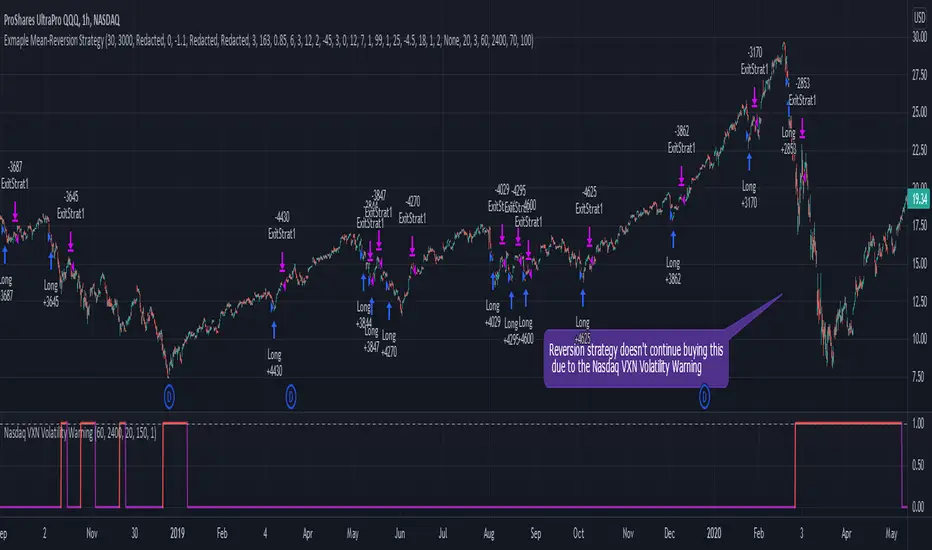
Nasdaq VXN Volatility Warning IndicatorToday I am sharing with the community a volatility indicator that uses the Nasdaq VXN Volatility Index to help you or your algorithms avoid black swan events. This is a similar the indicator I published last week that uses the SP500 VIX, but this indicator uses the Nasdaq VXN and can help inform strategies on the Nasdaq index or Nasdaq derivative instruments.
Variance is most commonly used in statistics to derive standard deviation (with its square root). It does have another practical application, and that is to identify outliers in a sample of data. Variance is defined as the squared difference between a value and its mean. Calculating that squared difference means that the farther away the value is from the mean, the more the variance will grow (exponentially). This exponential difference makes outliers in the variance data more apparent.
Why does this matter?
There are assets or indices that exist in the stock market that might make us adjust our trading strategy if they are behaving in an unusual way. In some instances, we can use variance to identify that behavior and inform our strategy.
Is that really possible?
Let’s look at the relationship between VXN and the Nasdaq100 as an example. If you trade a Nasdaq index with a mean reversion strategy or algorithm, you know that they typically do best in times of volatility . These strategies essentially attempt to “call bottom” on a pullback. Their downside is that sometimes a pullback turns into a regime change, or a black swan event. The other downside is that there is no logical tight stop that actually increases their performance, so when they lose they tend to lose big.
So that begs the question, how might one quantitatively identify if this dip could turn into a regime change or black swan event?
The Nasdaq Volatility Index ( VXN ) uses options data to identify, on a large scale, what investors overall expect the market to do in the near future. The Volatility Index spikes in times of uncertainty and when investors expect the market to go down. However, during a black swan event, historically the VXN has spiked a lot harder. We can use variance here to identify if a spike in the VXN exceeds our threshold for a normal market pullback, and potentially avoid entering trades for a period of time (I.e. maybe we don’t buy that dip).
Does this actually work?
In backtesting, this cut the drawdown of my index reversion strategies in half. It also cuts out some good trades (because high investor fear isn’t always indicative of a regime change or black swan event). But, I’ll happily lose out on some good trades in exchange for half the drawdown. Lets look at some examples of periods of time that trades could have been avoided using this strategy/indicator:
Example 1 – With the Volatility Warning Indicator, the mean reversion strategy could have avoided repeatedly buying this pullback that led to this asset losing over 75% of its value:
Example 2 - June 2018 to June 2019 - With the Volatility Warning Indicator, the drawdown during this period reduces from 22% to 11%, and the overall returns increase from -8% to +3%
How do you use this indicator?
This indicator determines the variance of VXN against a long term mean. If the variance of the VXN spikes over an input threshold, the indicator goes up. The indicator will remain up for a defined period of bars/time after the variance returns below the threshold. I have included default values I’ve found to be significant for a short-term mean-reversion strategy, but your inputs might depend on your risk tolerance and strategy time-horizon. The default values are for 1hr VXN data/charts. It will pull in variance data for the VXN regardless of which chart the indicator is applied to.
Disclaimer: Open-source scripts I publish in the community are largely meant to spark ideas or be used as building blocks for part of a more robust trade management strategy. If you would like to implement a version of any script, I would recommend making significant additions/modifications to the strategy & risk management functions. If you don’t know how to program in Pine, then hire a Pine-coder. We can help!
The dispersion of volatility indicesThe script is my implementation of "Forecasting a Volatility Tsunami" by Andrew Thrasher (Thrasher Analytics). You can find the paper here: www.researchgate.net
I've changed a bit the approach - instead of two volatility indices (VIX & VVIX), I used two more: VXN and VXD. Additionally, I average the percentiles, but there is an option to swtich it to the original approach.