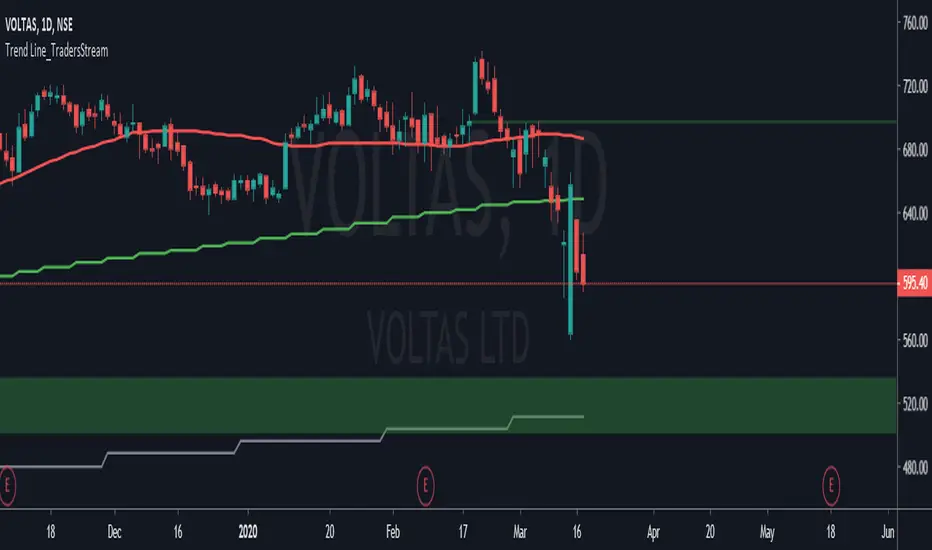
Trend Line_TradersStreamIn this Indicator you will find Multiple Trend Lines like SMA , EMA, RMA, WMA and VWMA. And this Trend lines shows Daily, Weekly and Monthly Trend on any time frame chart. So, that you can get overall trend of the Stock.
المتوسط المتحرك المرجح
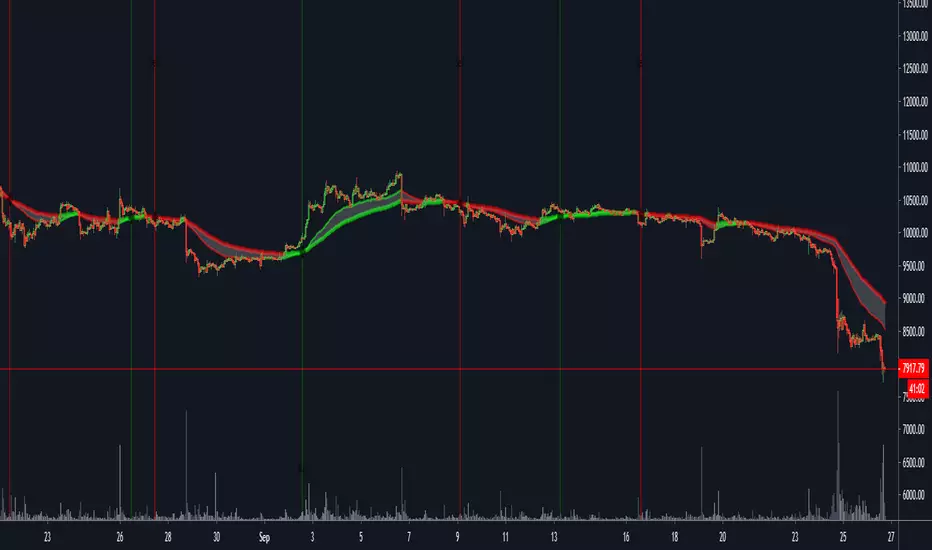
Bitcoin Cycle Top IndicatorBitcoin Cycle Top Indicator on the 1W Bitcoin Logarithmic chart.
Called all 3 tops so far to a T, this indicator will be great use for the next upcoming cycle.
I kept it sweet and simple, no need to overcomplicate. That's all this indicator does.

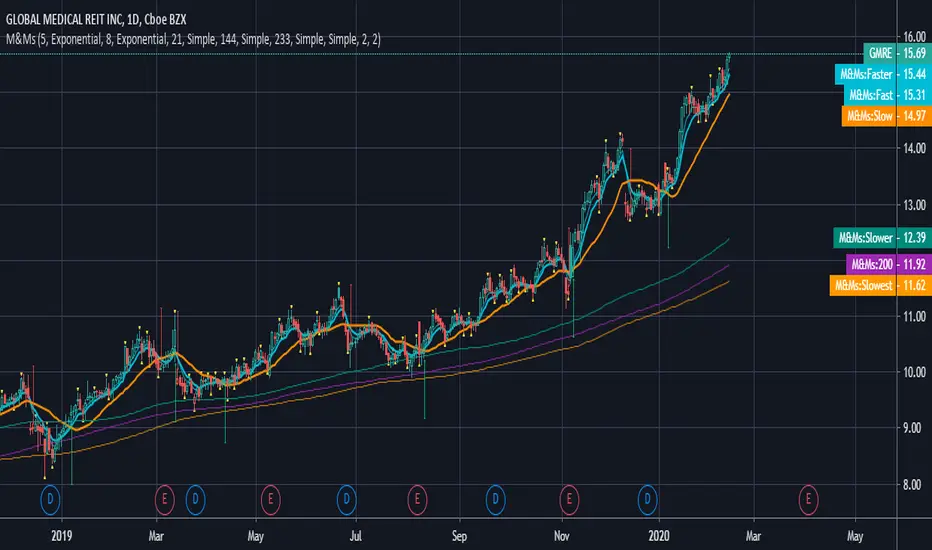
M&Ms - Multiple Moving Average Indicators This version includes Simple, Exponential and Weighted Moving Averages.
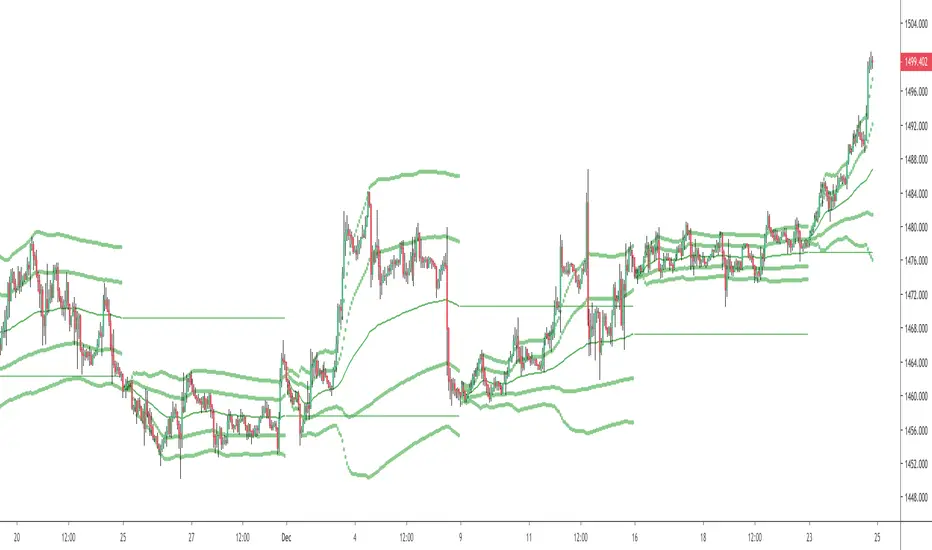
Average Price by Atilla YurtsevenHi Traders,
This is one of the most important indicators i have developed and I use it all the time and would like to share it with you.
What is Average Price?
Average price basically shows you the average of the price for the selected period. Let's say you are analysing in hourly chart and you want to know what is the monthly or weekly average price. This indicator helps you to see the average price of selected period. This is not a VWAP but you can enable VWAP from options.
Let's say your favorite period for Average price is 1 month. Average Price indicator will reset at the beginning of the each month and you can still enable volume weighted (I personally don't use VWAP).
I have also added deviations of average price. This is very useful option. Works like Bollinger Bands. Optionally, previous period's average price can be plotted onto your charts and they work like support and resistance.
Please remember to follow me on TradingView so you will be notified as soon as i share a new script or idea.
Disclaimer: This is not financial or investment advice
Trade safe,
Atilla Yurtseven
[BA] Multi Time Frame Moving Averages for BTCThis is a multi time frame moving average script. It includes 7 moving averages. Most of them are SMAs and WMAs but EMA were also used. Time frame was set to 1 day. It means that you can change the time frame of your chart freely without losing your lines. Levels will not change.
I wrote this script just to trade BTC. I prefer daily and weekly charts with this script but lower time frames are also preferable.
Since some of the lengths are too high; older exchanges are recommended due to their relatively deep historical data.
While MA1 is for taking actions like 'take profit' or 'stop loss' or just to follow 'price action' easily, other MAs are for seeing supports and resistances.
MA6 and MA7 are disabled by default in order to minimize the confusion but you can enable them from settings if you need to.
Since some newer exchanges have less historical data, you may not see MA4 and MA5 on the daily chart. In such circumstances MA6 and MA7 might be helpful to use as substitution. Some may like to use all of them.
I am using this script just for BTC but it can be useful for other coins as well.

5WMAs based on GANN numbers 5 13 49 73 198Plots 5 Weighted Moving Averages of 5 13 49 73 198 with source (High+Low+Close)/3
A Cross Appears when 13 WMA Crosses 49 WMA

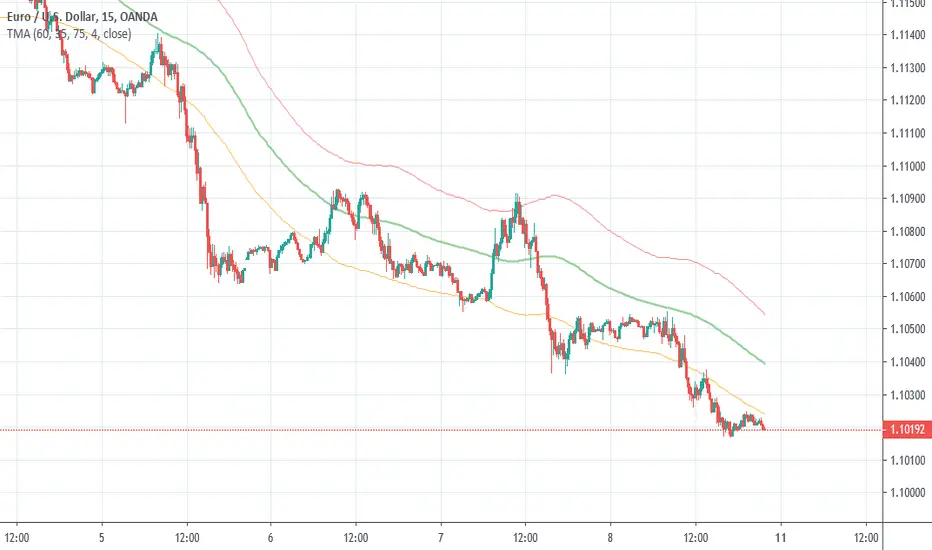
TriangularMA from different TimeFrameIndicator calculates TMA from different TF and shows it on current.
Algorithm Builder CRYPTO (m5)Hello traders 👋
I. 💎 SCRIPTS ACCESS AND TRIALS 💎
1. Every 3 weeks trial request access has to be done through my website .
2. My website URL is in this script signature at the very bottom (you'll have to scroll down a bit and going past the long description) and in my profile status available here : Daveatt
3. Many video tutorials explaining clearly how all our indicators work are available on your website > guides section.
4. You may also contact me directly for more information regarding the trading method included in the indicator or how to access it
2.1 Forewords
This indicator is for the Intraday CRYPTO traders looking for fixed entries based on a trading method designed by 2 experienced traders.
It's a variation of our Algorithm Builder with a custom method for 5-minutes chart trading - can be coupled with the UNIVERSAL Algo Builder also,
We designed this framework for CRYPTO/USD and CRYPTO/CRYPTO pairing (ex: LTC/BTC, XRP/ETH, ...).
Made for crypto with enough trading volume (big and mid-caps)
ETH/BTC
XRP/ETH
EOS/USD
The tool works in m5 timeframe but won't work with any other timeframe . Even if applied on a 5-minutes chart; we included higher timeframe indicators to enter more securely.
It includes :
- our proprietary method with fixed entries
- a hard exit system (built-in stop-loss)
- 🔔 Compatible with dynamic alerts 🔔
Dynamic alerts are bringing automated trading to a whole new level. The third-party solutions capturing TradingView alerts are able to use them.
- (optional) we let the users decide to use or not our built-in Trade Manager.
Regardless of the Trade Manager is used or not, one must mandatory exit, once a vertical hard exit bar appears.
- the Algorithmic Supports and Resistances used as safeguards and take profit zones.
Final words
We made it as simple as we could (to be honest it's a very simple system for the end-user) - even with several hundreds of calculations in the indicator.
Please hit me up for any question/feedback/comment
Become the BEST trader that you deserve to be
Dave

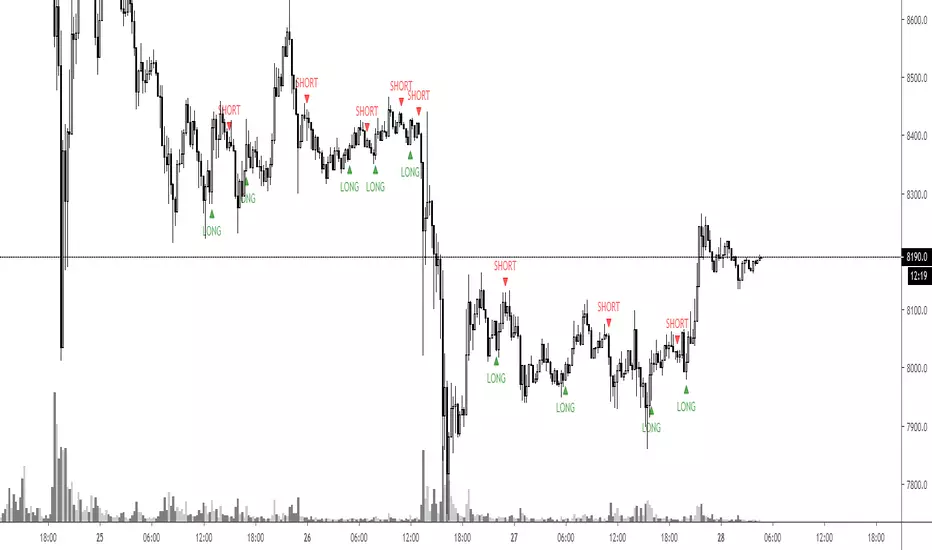
MA Crossover [Alerts]This is a Moving Average Crossover study .
The study comes with all alerts (Long, Short, Take Profit, and Stop Loss).
A few visuals like Exit Loss and Profit/Loss Boxes have been added as well.
The following Moving Averages are supported:
SMA
EMA
DEMA
TEMA
WMA
VWMA
SMMA
HullMA
LSMA
ALMA
SSMA
TMA
ZLEMA
If you’d like to automate this script you can do that by using AutoView, ProfitView, ProfitTrailer, CryptoHopper etc.
Feel free to leave a comment and share it with your friends. Enjoy!

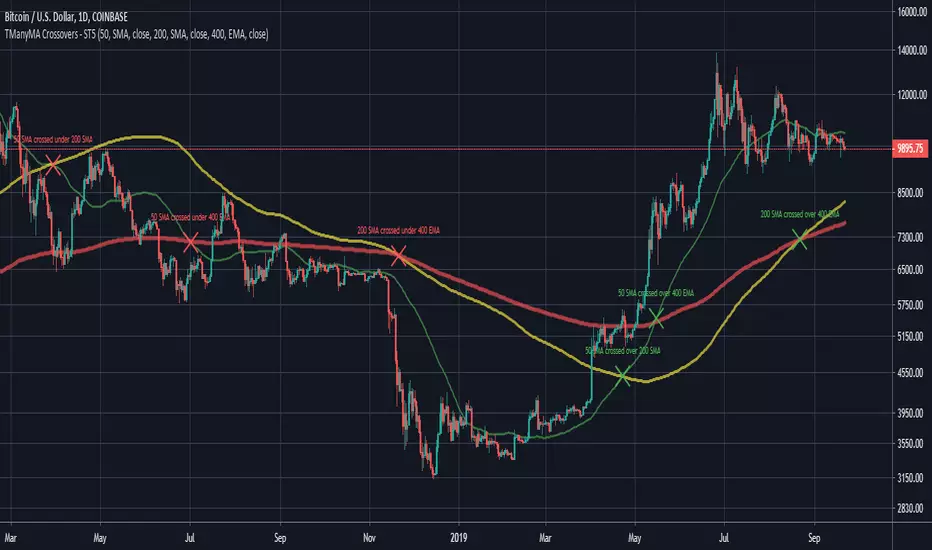
Scripting Tutorial 8 - Triple Many Moving Averages RibbonsThis script is for a triple moving average indicator where the user can select from different types of moving averages, price sources, lookback periods and resolutions.
Features:
- 3 Moving Averages with variable MA types, periods, price sources, resolutions and the ability to disable each individually
- Crossovers are plotted on the chart with detailed information regarding the crossover (Ex: 50 SMA crossed over 200 SMA )
- Forecasting available for all three MAs. MA values are forecasted 5 values out and plotted as if a continuation to the MA.
- Forecast bias also applies to all forecasting. Bias means we can forecast based on an anticipated bullish, bearish or neutral direction in the market.
- To understand bias, please read the source code, or if you can't read the code just send me a message on here or Twitter. Twitter should be linked to my profile.
- Ribbons added and on by default. Optional setting to disable the ribbons. 5 ribbons between MA1 and MA2 and another 5 between MA2 and MA3.
- Ribbons are alpha-color coded based on their relation to their default MAs.
- Ribbons are only visible between MAs if the MAs being compared share the same Type, Resolution, and Source because there is no way to consolidate those three in a simple manner.
- Ribbon values are calculated based on calculated MA Periods between the MAs.
This script is meant as an educational script with well-formatted styling, and references for specific functions.

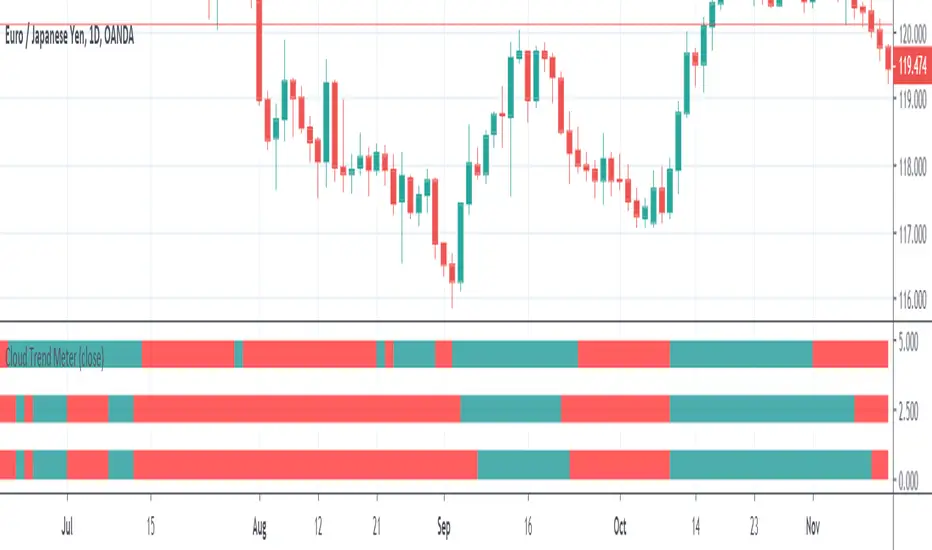
Cloud Trend Meter Uptrend / Bullish
Predict uptrend when at least 2/3 are green on the left side.
Downtrend / Bearish
Predict downtrend when at least 2/3 are red on the left side.
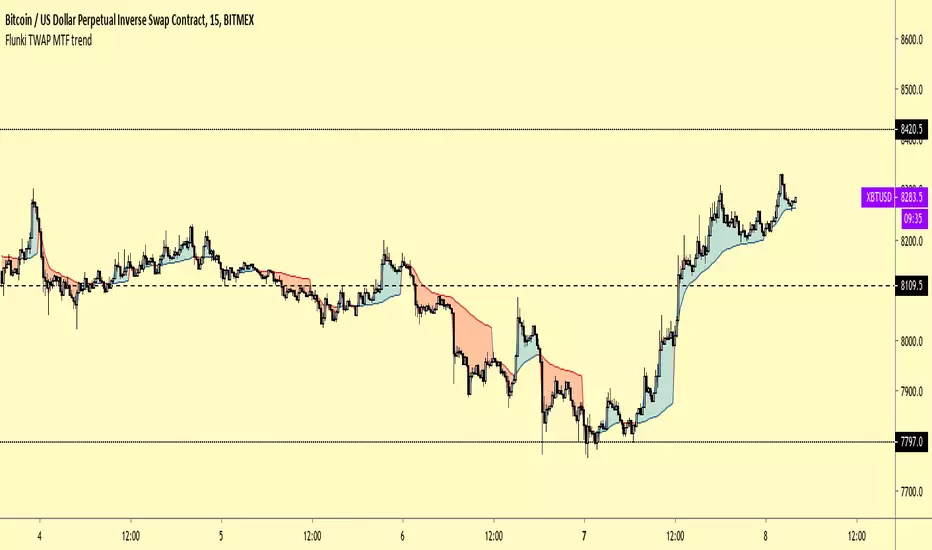
Flunki TWAP MTF Trend v.2Further experiments with multi-timeframe weighted averages...
Herewith a duel timeframe TWAP (time weighted average price)
TWAP differs from VWAP as so..
TWAP is weighted based on time, VWAP is weighted based on time and volume . Small volume trades do not impact TWAP but impact VWAP
Anyways, as you can see, it does a pretty good job of showing trend..
Enjoy.
Momentum 4 Ways Smoothed [Salty]This is an enhance version of Momentum 4 Ways that shows 4 ways to calculate momentum and display each one along with their combined average value.
This study was created to compare 4 different momentum values against their combined average using different display styles to allow the user to experiment with different views of momentum.
- Added the ability to smooth the Average Momentum value. Default Smoothing value is 5.
- Added the ability to use different average calculations. Default is WMA.
- Added the ability to select the number of momentum values to average (1-4). Default is 4.
- Added the ability to use VWAP instead of price as the input.
The Smoothed Average Momentum line is color coded so that it is green when it is moving in the bullish direction and red when it is moving in the bearish direction.

Ori Moving Averages (MTF)This indicator helps to plot different moving averages with different types and different multi time frame options.

Scripting Tutorial 5 - Triple Many Moving Averages CrossoversThis script is for a triple moving average indicator where the user can select from different types of moving averages and periods. This script improves upon tutorial 3 by adding source selection for MAs and another option for an MA that is not built-in, the HMA . It is meant as an educational script with well formatted styling, and references for specific functions.
Farey Sequence Weighted Moving AverageA moving average that weighted with Farey fractions. It matches a standard linear weighted average almost one-to-one. Why? Because both averages have strictly monotonic weighting sequences and assign a higher weight to latests data. So, Farey weights are just scaled to linear ones. Instead of specifing period you specify an order of Farey sequence. To learn more about Farey sequence you can refer to Wiki
Published just for reference, it is not intended for trading purposes.
Highly Optimized (Aroon, DMI, RWI)It is a highly optimized script for H4, D1. Backtests from (2016 - 2019, depending on the currency pair). Optimization still
going on.
Following alerts can be activated:
-
Buy-Signal (Baseline-Cross)!
Sell-Signal (Baseline-Cross)!
Buy Signal (Aroon)!
Sell Signal (Aroon)!
Buy Signal (DMI)!
Sell Signal (DMI)!
Buy Signal (RWI)!
Sell Signal (RWI)!
Can be used by the following pairs:
AUDCAD
AUDCHF
AUDJPY
AUDNZD
AUDSGD
AUDUSD
CADCHF
CADJPY
CHFJPY
CHFSGD
EURAUD
EURCAD
EURCHF
EURGBP
EURJPY
EURNZD
EURSGD
EURTRY
EURUSD
GBPAUD
GBPCAD
GBPCHF
GBPJPY
GBPNZD
GBPSGD
GBPUSD
NZDCAD
NZDCHF
NZDJPY
NZDUSD
SEKJPY
SGDJPY
USDCAD
USDCHF
USDCNH
USDJPY
USDSGD
USDTRY
XRPUSD
Price is 5€ per Month or 75€ lifetime. One week free for testing.

Price CorrelationPrice Volume correlation script.
Detects divergences between Price and Volume. The line will become blue when the price becomes indecisive / detects divergences between the price and volume. When this happens the line will drop / jump between the moving price S/R levels. Usually a good indication on when to buy / sell given the current trend

BB%_RSI-WMA with alertsThis is a volatility indicator that gives signals based on some indicators like RSI, WMA etc
This indicator is requested by trader ogranicgrower and owns the permision to permit one on using it

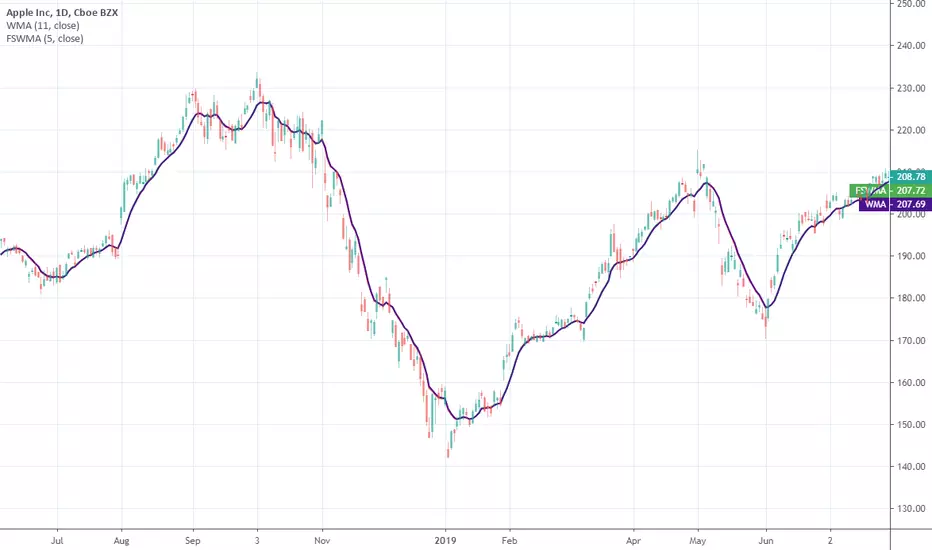
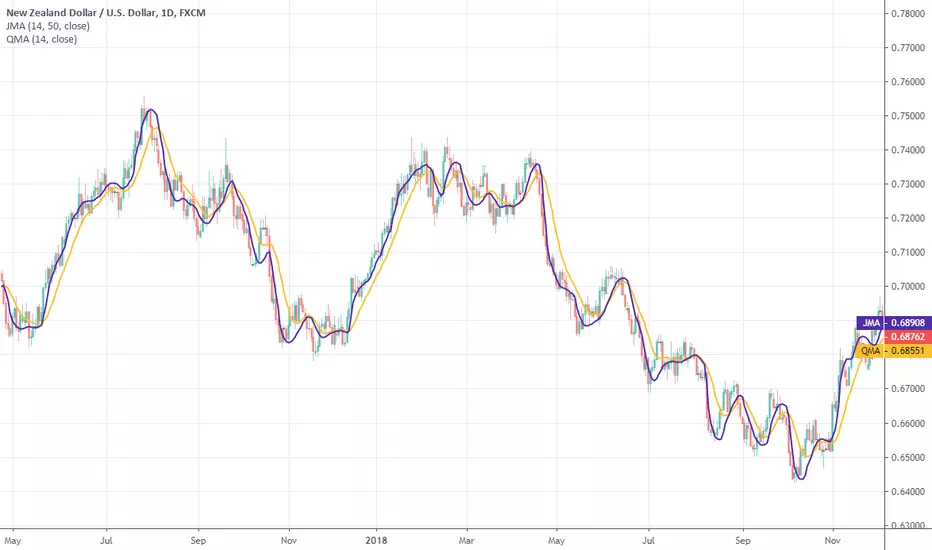
Quick Moving AverageThis moving average was originally developed by John McCormick in 2008 as NinjaTrader indicator. The purpose was to find a cheap replacement for JMA ( ).
Well, not impressive concerning the response.
Source code on request .
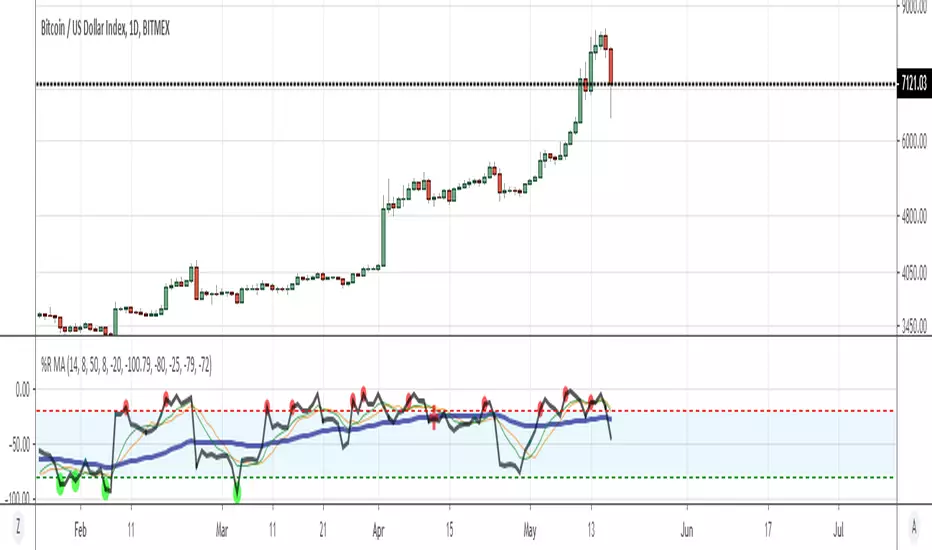
Williams %R with MA-EMA-WMAWilliams %R is a momentum indicator that is the inverse of the Fast Stochastic Oscillator. Also referred to as %R, Williams %R reflects the level of the close relative to the highest high for the look-back period. However, bare-metal version of Williams %R does not indicate where the trend is heading and only gives you buy and sell signals, whenever it crosses over or under certain levels. In order to improve this indicator i decided to add few things, in order to see where the trend is heading while Williams %R giving you buy and sell signals at the same time.
Information:
This indicator comes with adjustable (ma-ema and wma) moving averages, applied on Williams %R signal. So whenever Williams %R crossover SMA or EMA it's an indication of stock/coin price is moving upwards while it crossunder SMA or EMA values, it's an indication of price will go downwards. Convincigly though each crosspoints have their own custom colors, so you can identify if it's going up or down.
Oversold and Overbought Visuals:
Whenever Williams %R crossover overbought area, it will draw an orange circle, which indicates the direction of the trend is about to end and price of that stock/coin may fall. Anything over -20 is considered as Overbought.
Convincigly when Williams %R crossunder oversold area, it will drawn lime color circle, which indicates that the stock/coin may have reached at it's bottom and trend change is expected. Anything below -80 is considered as Oversold and could be used as buying zone.
Trend following with WMA:
As mentioned earlier, while Willams %R gives you reliatively good buy and sell points, it does not show you the whole picture, thanks to it's jagged nature. If the certain stock/coin in a falling trend, Williams %R may give you numerous buy and sell signals; but won't show you if it's going to get lower or higher. Thanks to WMA, it filters most of the jagged signals and gives you an idea of where the trend is heading, also offers key turning points (trend overbought and oversold areas)
Whenever WMA draws a red cross on top, it indicates the following trend is about the change and if you have not sold the stocks/coins you are holding, you may only have small amount of time left to do so. And when WMA draws a green cross at the bottom, it's an indication of strong buy signal and the downtrend is about to end. Although for both of these keypoints, you should always confirm it via Williams %R signals and candlesticks as well.
There is also something called midpoint. Whenever WMA draws purple circle at specific levels(which is also adjustable) it will give you an idea of trend may change it's direction if it's going upwards or downwards. These circles do not offer you a buy or sell signal and only informs you about where trend is heading or where it might make a reversal. You can also adjust overbought-oversold and midpoint levels for your own liking.
Moving Average Cross Alert, Multi-Timeframe OptionSee when two moving averages cross. With the option to choose between four moving average calculations:
SMA = simple moving average
EMA = exponential moving average (default)
WMA = weighted moving average
Linear = linear regression
The moving averages can be plotted from different time-frames, like e.g. the weekly or 4 hour time-frame using HL2 , HLC3 or OHLC4 as price source for the calculation. In addition there is a background color alert and arrows when the moving averages cross each other when the price also rises or falls. And the moving averages are colored depending on their trend direction (if they are trending up or down).