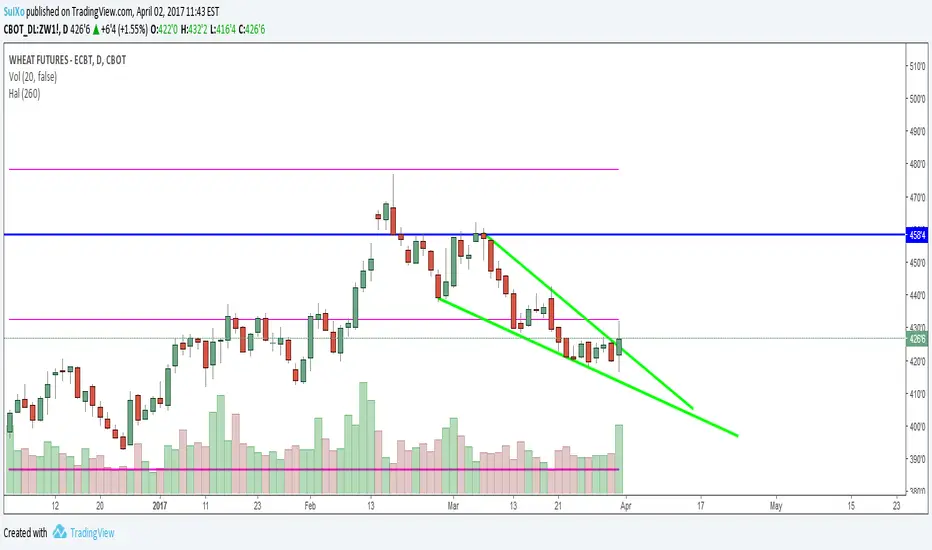
TKP Weekly, Monthly and Yearly Fib Pivot PointsThis script allows you to plot Weekly, Monthly and Yearly Fibonacci Pivot Points. I used templates from others I found on TradingView, special thanks given in the Script. I prefer Longer time frames, especially yearly Pivots, to predict reversals and places to trim risk, so this was tailored to my needs. Hope this helps!
Yearly
Close of relevant previous periodThis indicator puts the previous close value of a higher relevant time frame on the chart, it adepts to the period of the chart. Relevant means that it puts:
Close of previous year in monthly chart
Close of previous month in weekly chart
Close of either previous month of week in daily chart, default setting is week
Close of previous week in 4hourly and 3hourly charts
Close of previous day in 30minute and higher intraday charts
Not bother the user below 30 minutes.

HalHighest High and Lowest Low within a given length. Default is 260 bars (approx 1 year)
Separated in 3 thirds with 2 middle lines. Lowest third, middle third and highest third.
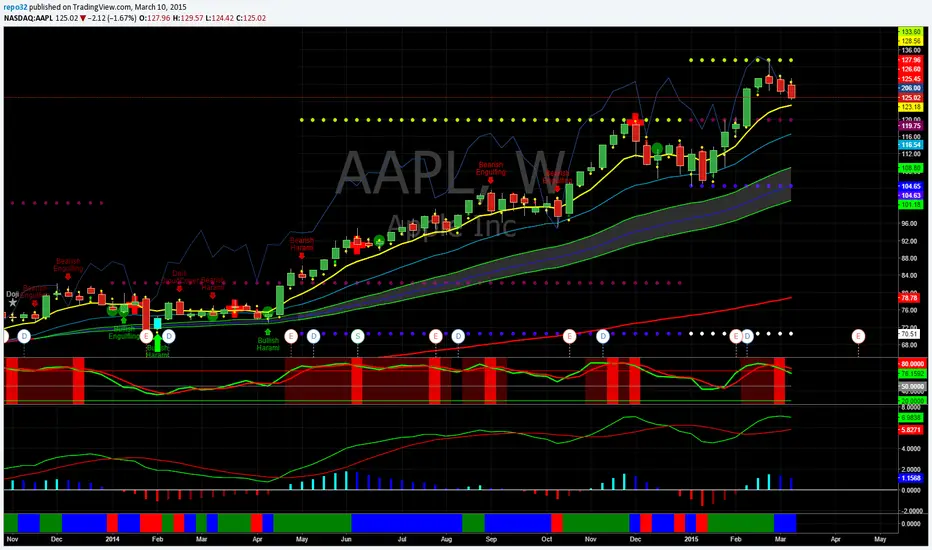
High Low Yearly Support ResistanceDecided to repost to get clean chart up. This gives you lines showing the current years highs and lows along with the previous years high and lows.
Requested by "N"

High Low YearlySorry for the mess above. Not sure how to remove it. It was not what I was looking to post. I added the the clean chart below.
This was requested by "N". It displays the current yearly highs and lows along with the previous years highs and lows. Just a nice way to see the support resistance in all time frames.