What is Bar Replay?
Bar Replay enables users to simulate past price movements for strategy testing. This tool assists traders in refining strategies by analyzing historical market behavior and practicing trading decisions without real financial exposure. Historical trading starts at a selected point with a controlled replay speed. Data availability varies with subscription plans and chart timeframes.
Bar Replay offers a risk-free, interactive, and dynamic way to enhance your trading skills, refine strategies, and gain valuable insights into historical market behavior.
What can I learn from this article?
This article provides a comprehensive overview of this feature, offering a step-by-step guide on using it for strategy testing and simulated trading.
- What are the benefits?
- How to turn it on and off: Step-by-Step Guide
- How can drawings and indicators be used in Bar Replay?
- What is the maximum depth of data history available?
- Are there any special hotkeys available for specific actions?
- What are the additional functionalities and limitations present in Bar Replay?
What are the benefits?
Bar Replay provides significant advantages for traders:
- Strategy Refinement: It enables refining trading strategies through historical price analysis and simulated trading, identifying areas for improvement.
- Realistic Learning: Traders simulate real market conditions, gaining practical insights into strategy performance.
- Historical Insights: By studying past price movements, traders uncover patterns and trends for informed decisions.
- Risk-Free Practice: Beginners practice without real financial risk, building confidence before live trading.
- Customized Speed: Replay speed adjusts for various learning paces.
How to turn it on and off: Step-by-Step Guide
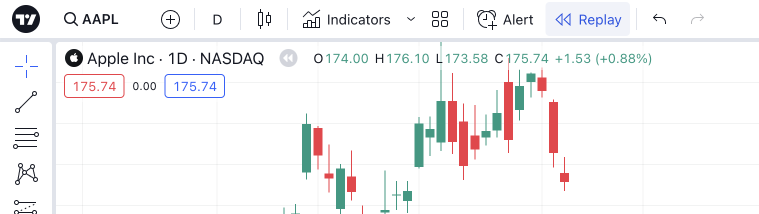
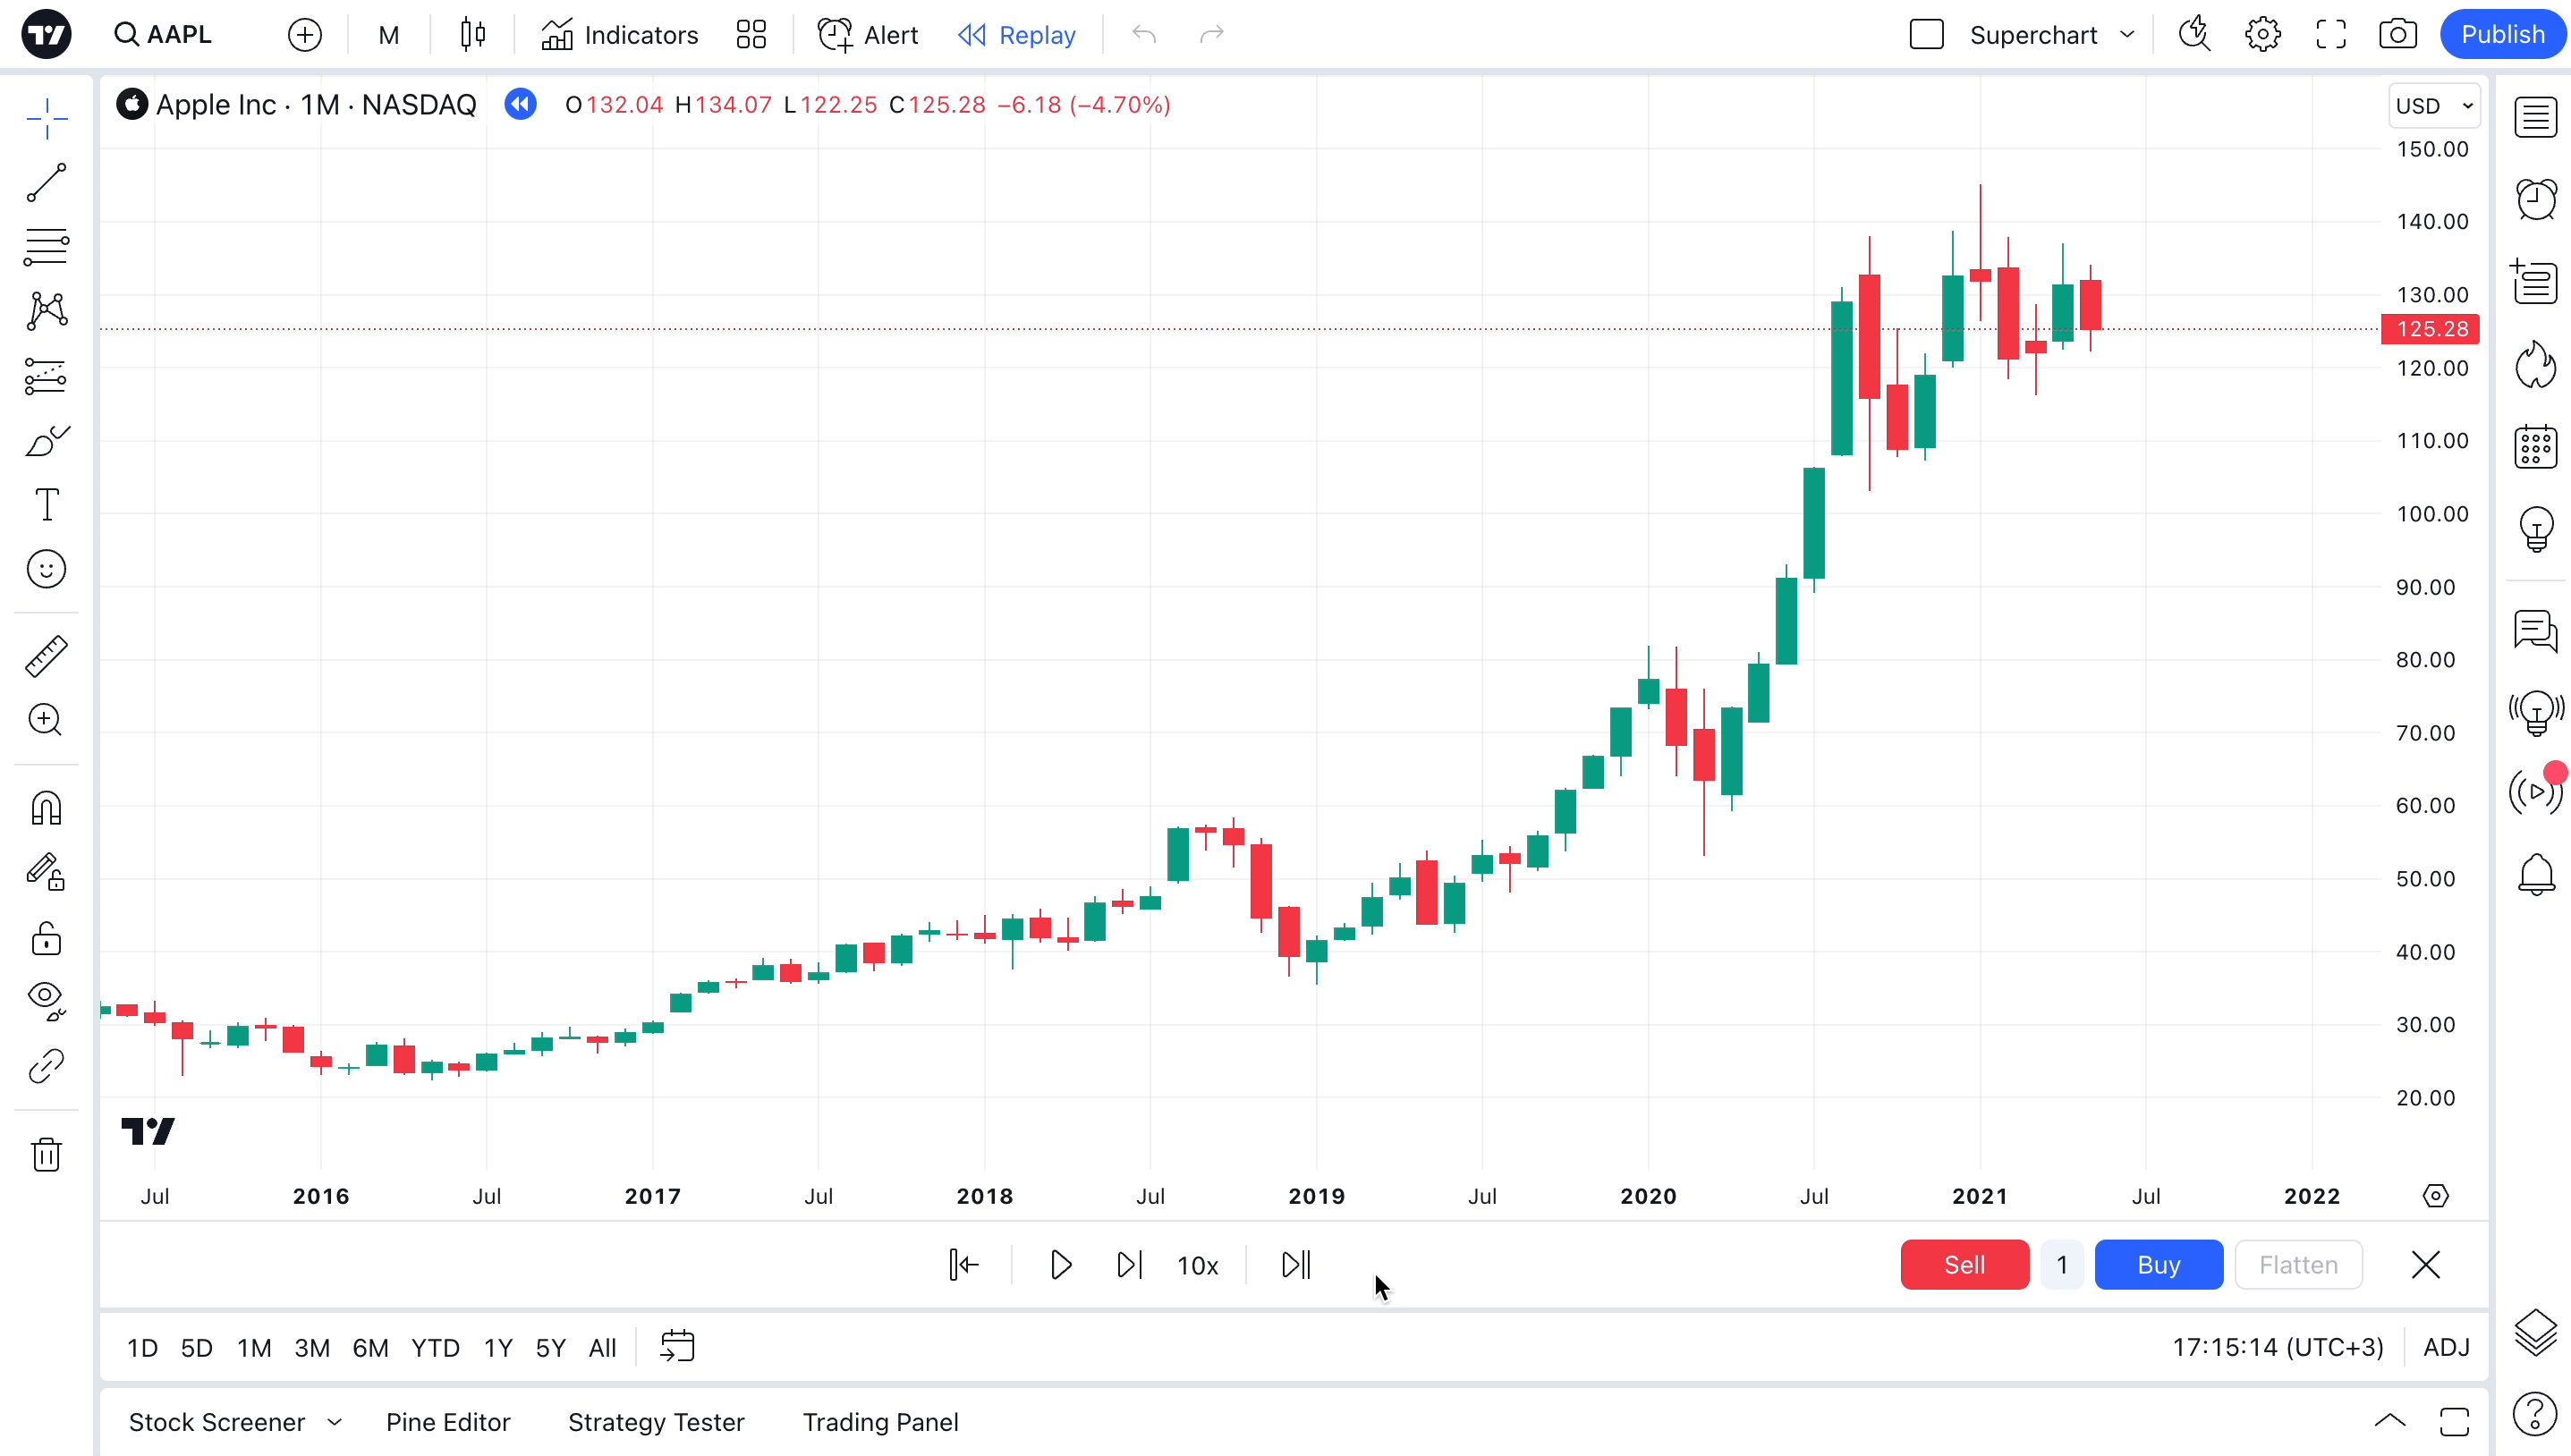
Opening Bar Replay: To begin, locate the Bar Replay button on the top panel of your chart. Click this button to open the replay panel. The button resembles a play symbol.
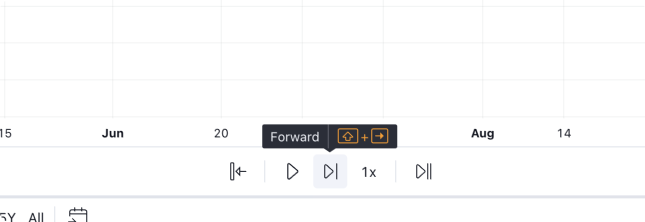
Navigating Playback: Once inside the replay panel, you'll notice playback buttons that function similarly to those in common media players. Familiarize yourself with these buttons for easy navigation.

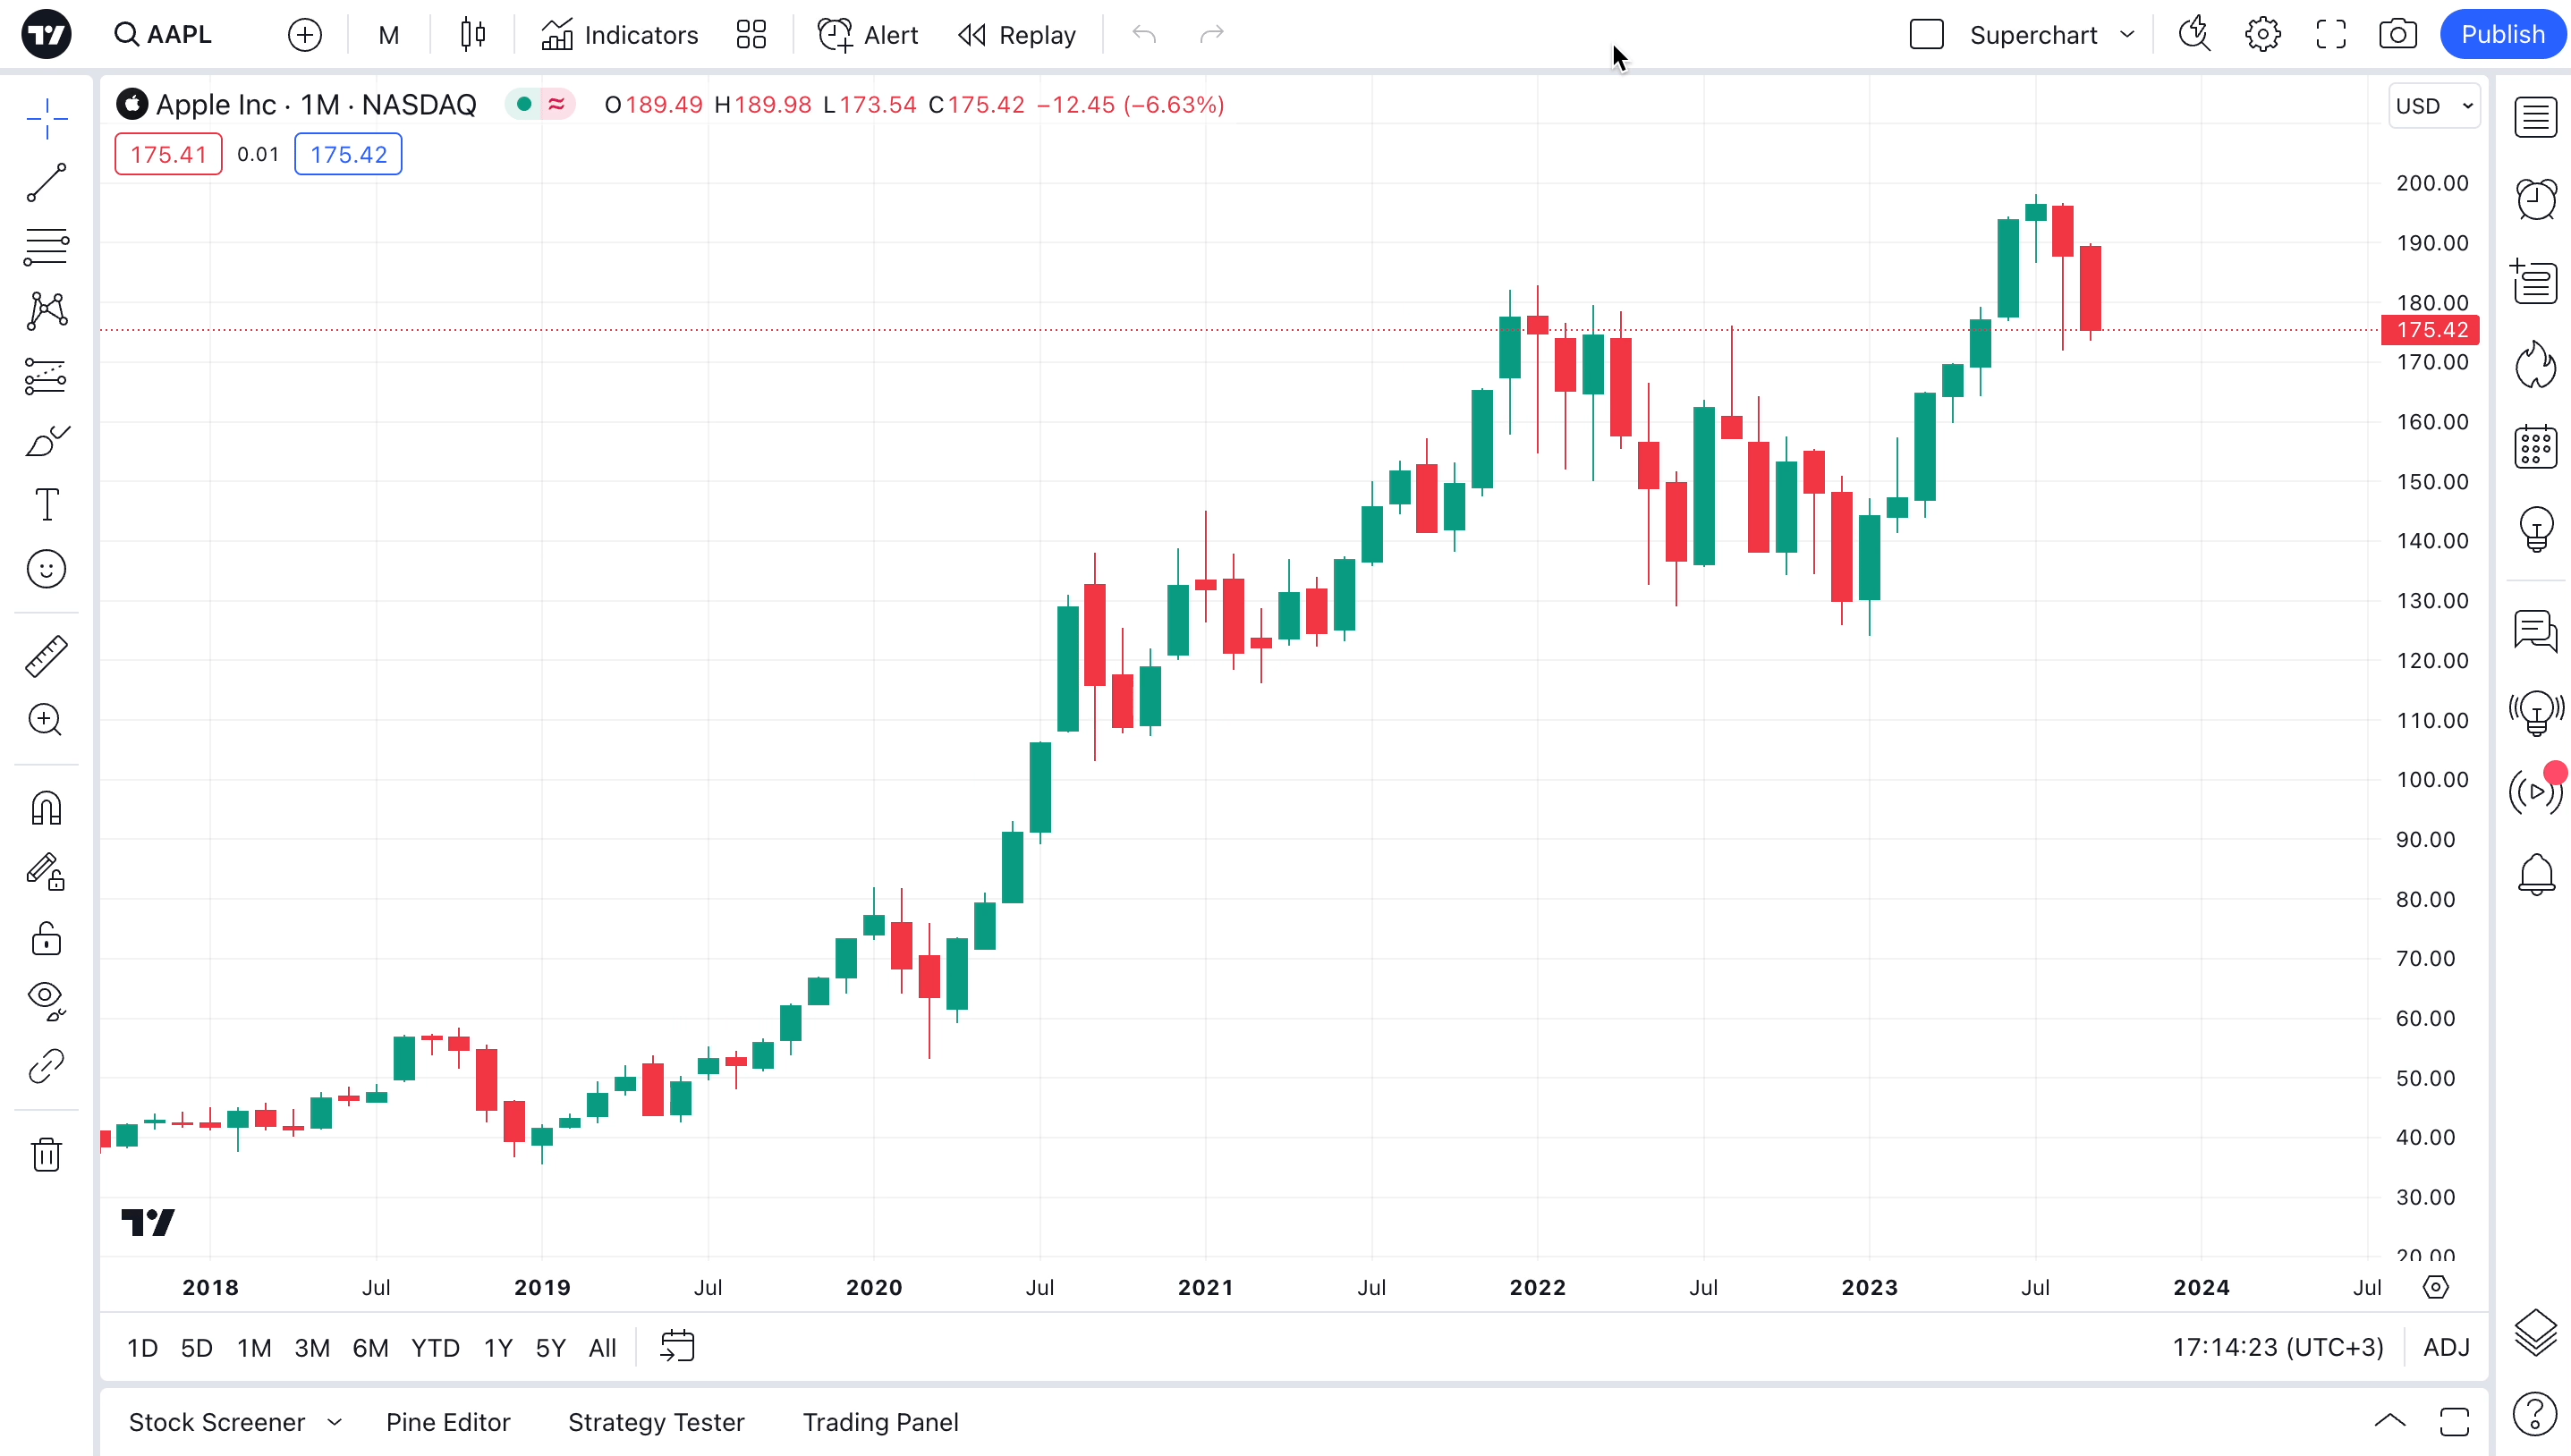
Selecting Starting Point: The chart will now allow you to choose a starting point for the replay. Hover your cursor over the chart screen, a blue vertical line with scissors will appear. Click on the specific date and time you wish to start from.
Starting Playback: Click the Play button to initiate the replay. You can control the replay speed before or during playback according to your preference.

Manual Advancement: To move forward one step at a time, simply click the Forward button.
Monitoring Status: Keep an eye on the corresponding status displayed on the chart when Bar Replay is running.

Changing Starting Point: Even if the replay is running, you can switch to a different starting point. Click "Jump To..." and select a historical section of the chart to adjust the starting point.

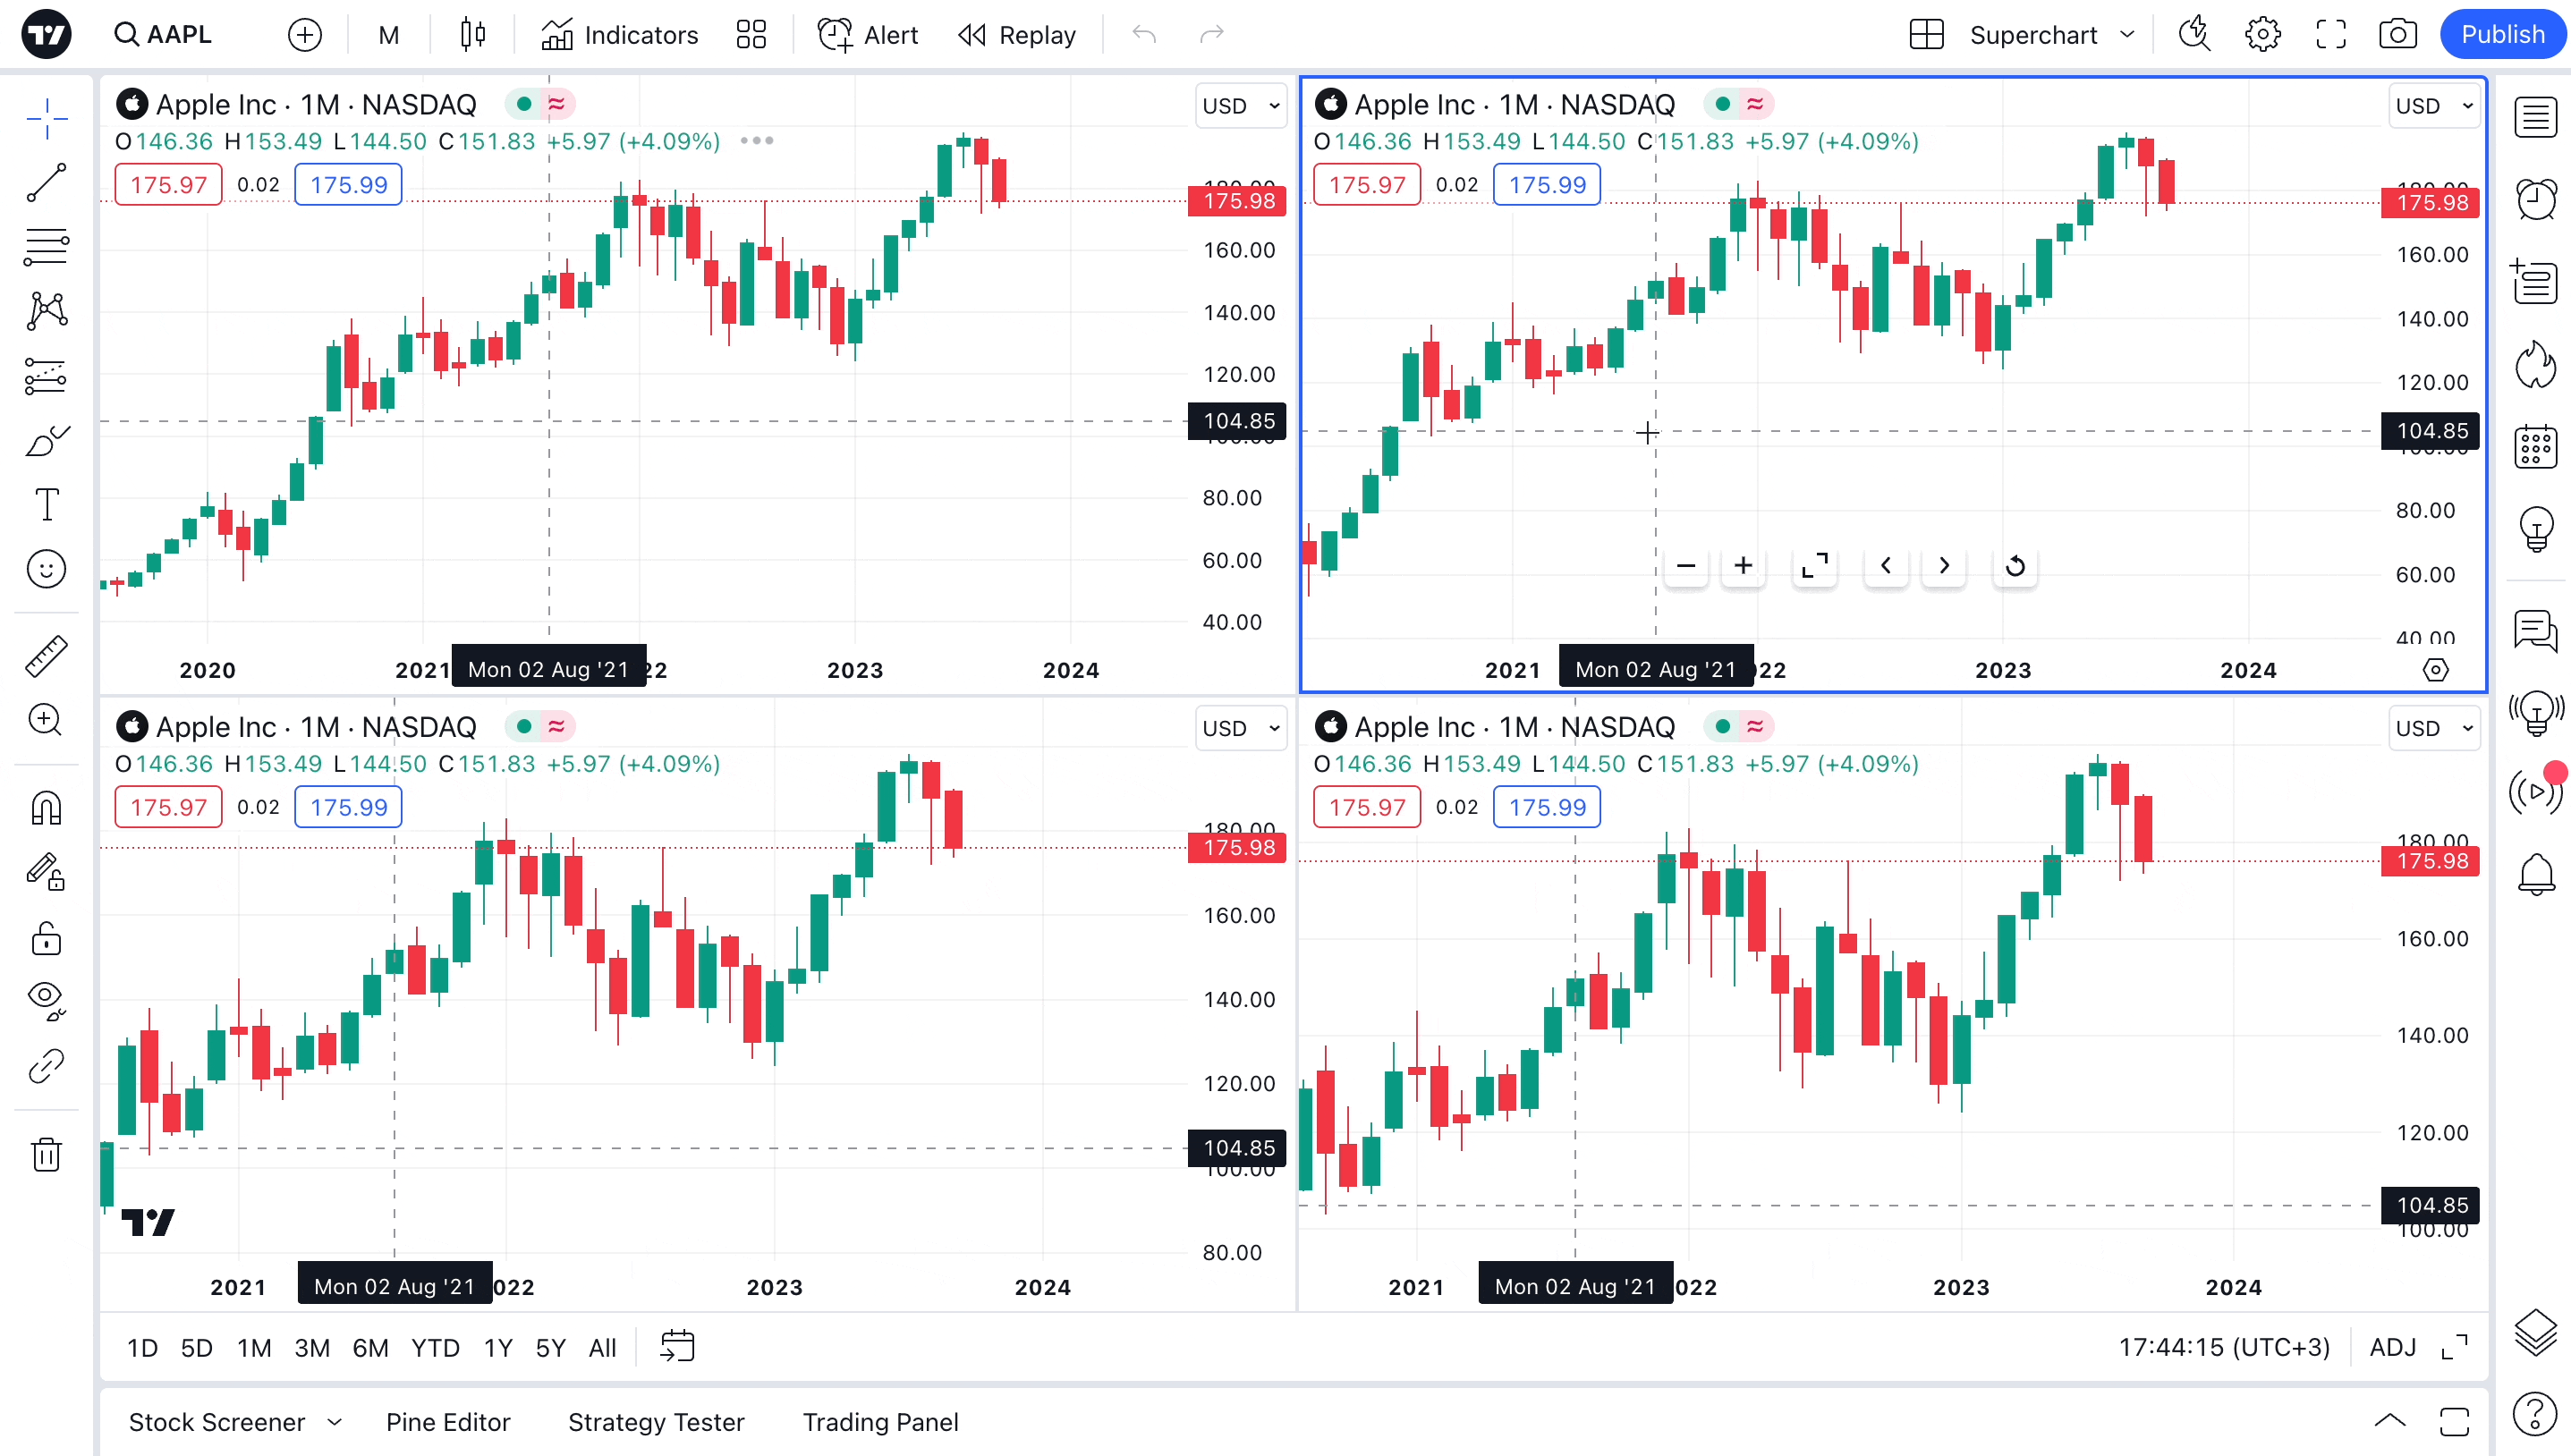
Multiple Charts: If needed, you can view multiple charts within one window. Click on any chart to initiate replay, and the panel will show the status of your selected chart. This process is the same for each chart.
However, it's important to note you can replay each of the charts in a multi-chart layout sequentially, but you cannot replay all the charts in a multi-chart layout simultaneously.
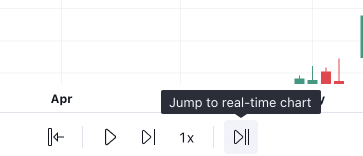
Ending Replay: You can conclude the replay and return to live data by using the "Jump to real-time chart" button. This brings you back to current market conditions instantly.
Closing the Replay Panel: To close the replay panel, either click the [X] button on it or click the Bar Replay button again at the top of the chart.
How can drawings and indicators be used in Bar Replay?
Using drawings and indicators in Bar Replay and on the regular chart differs in purpose and function. In Bar Replay, drawings act as annotations for historical price data, assisting in strategy testing. Indicators provide insights into past price movements based on selected parameters, evaluating indicator performance for strategy improvement. While drawings are session-specific, indicators rely on historical data and lack real-time relevance.
What is the maximum depth of data history available?
The length of historical data in Bar Replay can vary depending on the selected symbol and chart timeframe. For daily and daily-based timeframes, we display all available data on the chart and the same data can be used in the Bar Replay mode. For intraday timeframes, TradingView keeps limited amount of data and the length in Bar Replay varies depending on the plan.
For Essential and Plus plan holders, the length of available intraday data is calculated as follows: from now to 6 weeks back multiplied by timeframe (in minutes), i.e. you can go 6 weeks back on the 1-minute chart, 12 weeks back on the 2-minute chart, 30 weeks back on the 5-minute chart, 90 weeks back on the 15-minute chart and so on. The higher timeframe is selected, the more intraday data is available.
While Premium plan holders have more historical intraday data for Bar Replay: from now to 6 months back multiplied by timeframe (in minutes), i.e. Premium users have access to 6 months of 1-minute data. For 2-minute timeframe, this limit is doubled and a year of 2-minute data is available; for 3-minute it is tripled and 18 months of 3-min data is available and so on.
For all second-based timeframes, Premium users have access to 90 days of data in Bar Replay.
Our Professional plans provide even more historical intraday data for Bar Replay. The limitations are as follows:
- for Expert plans - from now to 270 days back multiplied by timeframe(in minutes)
- for Elite plans - from now to 360 days back multiplied by timeframe (in minutes)
- for Ultimate plans - from now to 450 days back multiplied by timeframe (in minutes)
For all seconds-based timeframes, Expert plans have access to 120 days of data, Elite plans have access to 150 days of data, and Ultimate plans can have the maximum length of seconds-based data in Bar Replay, which is 180 days.
Please note that the above-mentioned replay limits are not applied to continuous futures charts - 1! and 2! symbols(for example, ES1!, BANKNIFTY1!) as they have their own special intraday limitations and it's not possible to play more than 20K intraday bars in the replay mode.
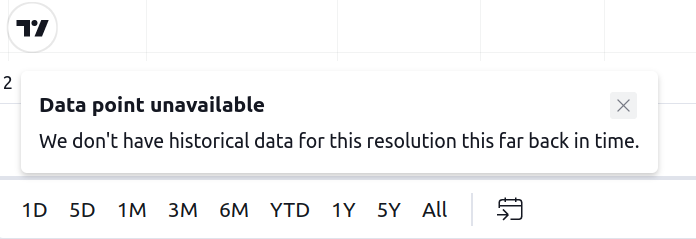
If there is no data for the selected time period, the Replay will show the notification.

When you switch timeframes from higher to lower ones, there may be a situation when there is data available on the higher timeframe (e.g. 1 day) that is not available on the lower timeframe chart (e.g. 1 min) since the intraday limit has been reached. In this case, you will see the message "Data point unavailable" in the bottom left corner of the chart and the Bar Replay will bring you to the most recent bars, but you will still be in the Bar Replay mode and will be able to choose a new starting point for replay by clicking "Jump To..." button.
Are there any special hotkeys available for specific actions?
You can quickly and conveniently control playback from the keyboard, without having to use your mouse or trackpad.
To start or stop playback, simply click Shift + ↓
To move one step forward, just click Shift + →
What are the additional functionalities and limitations present in Bar Replay?
- Server-side alerts persist based on real-time data.
- Generating new server-side alerts is not feasible during replay.
- Trading orders (including Paper Trading and other brokers) execute using real-time data.
- Quotes visible on the trading panel and in the quotes list align with real-time data when in replay mode.
- Non-standard chart types are incompatible with Bar Replay.
- Regression Trend and Fixed Range Volume Profile tools are inactive during replay.
- It is not possible to replay bars in smaller segments.
- Bar Replay does not work with spread charts.