Sltenzi//DRBASL
//@version=5
indicator("Quantitative Market Analyst KSA ksa", overlay=true, max_lines_count=500, max_boxes_count=100)
// الإعدادات
show_summary = input.bool(true, "إظهار الملخص", group="العرض")
show_oscillators = input.bool(true, "إظهار المؤشرات الفنية", group="العرض")
show_moving_averages = input.bool(true, "إظهار المتوسطات المتحركة", group="العرض")
show_ob_analysis = input.bool(true, "إظهار تحليل الكتل السعرية", group="العرض")
show_supertrend = input.bool(true, "إظهار تحليل سوبرترند", group="العرض")
show_trendline = input.bool(true, "إظهار تحليل الترند/القناة", group="العرض")
show_volume = input.bool(true, "إظهار تحليل الحجم", group="العرض")
show_progress_bars = input.bool(true, "إظهار مؤشرات التقدم", group="العرض")
dashboard_size = input.string("عادي", "حجم لوحة المعلومات", options= , group="العرض")
theme_setting = input.string("مضيء", "الثيم", options= , group="العرض")
timeframe_setting = input.timeframe("60", "الإطار الزمني للتحليل", group="الإعدادات")
// إعدادات الكتل السعرية
ob_lookback = input.int(50, "فترة البحث عن الكتل", minval=10, maxval=200, group="الكتل السعرية")
ob_min_touches = input.int(2, "أقل عدد لمسات للكتلة", minval=1, maxval=5, group="الكتل السعرية")
// إعدادات سوبرترند
atr_period = input.int(10, "فترة ATR", group="سوبرترند")
atr_multiplier = input.float(6.0, "مضاعف ATR", step=0.1, group="سوبرترند")
// إعدادات الترند/القناة
trendline_lookback = input.int(100, "فترة الترند", minval=20, maxval=500, group="الترند")
channel_width_multiplier = input.float(2.0, "مضاعف عرض القناة", step=0.1, group="الترند")
// إعدادات الحجم
volume_ma_period = input.int(20, "فترة متوسط الحجم", group="الحجم")
volume_threshold = input.float(1.5, "عتبة ارتفاع الحجم", step=0.1, group="الحجم")
// ألوان الثيم المضيء
light_bg_primary = color.new(color.white, 5)
light_bg_secondary = color.new(#f8f9fa, 0)
light_royal_blue = color.new(#4169e1, 0)
light_royal_blue_light = color.new(#6495ed, 0)
light_border_color = color.new(#e1e5e9, 0)
light_text_primary = color.new(#2c3e50, 0)
light_text_secondary = color.new(#5a6c7d, 0)
// ألوان الثيم الداكن
dark_bg_primary = color.new(#1e1e1e, 5)
dark_bg_secondary = color.new(#2d2d2d, 0)
dark_royal_blue = color.new(#5a9fd4, 0)
dark_royal_blue_light = color.new(#4a8cc7, 0)
dark_border_color = color.new(#404040, 0)
dark_text_primary = color.new(#e8e8e8, 0)
dark_text_secondary = color.new(#b8b8b8, 0)
// اختيار ألوان الثيم
bg_primary = theme_setting == "مضيء" ? light_bg_primary : dark_bg_primary
bg_secondary = theme_setting == "مضيء" ? light_bg_secondary : dark_bg_secondary
royal_blue = theme_setting == "مضيء" ? light_royal_blue : dark_royal_blue
royal_blue_light = theme_setting == "مضيء" ? light_royal_blue_light : dark_royal_blue_light
border_color = theme_setting == "مضيء" ? light_border_color : dark_border_color
text_primary = theme_setting == "مضيء" ? light_text_primary : dark_text_primary
text_secondary = theme_setting == "مضيء" ? light_text_secondary : dark_text_secondary
// ألوان الإشارات - موحدة لكلا الثيمين
strong_buy_color = color.new(#00c851, 0)
buy_color = color.new(#28a745, 0)
neutral_color = color.new(#6c757d, 0)
sell_color = color.new(#dc3545, 0)
strong_sell_color = color.new(#c62828, 0)
// ألوان مؤشرات التقدم
progress_bg = theme_setting == "مضيء" ? color.new(#e9ecef, 0) : color.new(#404040, 0)
progress_positive = color.new(#28a745, 0)
progress_negative = color.new(#dc3545, 0)
// المؤشرات الفنية
rsi = request.security(syminfo.tickerid, timeframe_setting, ta.rsi(close, 14))
stoch_k = request.security(syminfo.tickerid, timeframe_setting, ta.stoch(close, high, low, 14))
cci = request.security(syminfo.tickerid, timeframe_setting, ta.cci(close, 20))
williams_r = request.security(syminfo.tickerid, timeframe_setting, ta.wpr(14))
= request.security(syminfo.tickerid, timeframe_setting, ta.macd(close, 12, 26, 9))
momentum = request.security(syminfo.tickerid, timeframe_setting, ta.mom(close, 10))
roc = request.security(syminfo.tickerid, timeframe_setting, ta.roc(close, 9))
= request.security(syminfo.tickerid, timeframe_setting, ta.bb(close, 20, 2))
// المتوسطات المتحركة
sma10 = request.security(syminfo.tickerid, timeframe_setting, ta.sma(close, 10))
sma20 = request.security(syminfo.tickerid, timeframe_setting, ta.sma(close, 20))
sma50 = request.security(syminfo.tickerid, timeframe_setting, ta.sma(close, 50))
sma100 = request.security(syminfo.tickerid, timeframe_setting, ta.sma(close, 100))
sma200 = request.security(syminfo.tickerid, timeframe_setting, ta.sma(close, 200))
ema10 = request.security(syminfo.tickerid, timeframe_setting, ta.ema(close, 10))
ema20 = request.security(syminfo.tickerid, timeframe_setting, ta.ema(close, 20))
ema50 = request.security(syminfo.tickerid, timeframe_setting, ta.ema(close, 50))
current_price = request.security(syminfo.tickerid, timeframe_setting, close)
// كشف الكتل السعرية
detect_order_blocks() =>
var float bullish_ob_level = na
var float bearish_ob_level = na
var int bullish_ob_strength = 0
var int bearish_ob_strength = 0
// كتلة دعم صاعدة
for i = 1 to ob_lookback
if i < bar_index
if low < low and low < low and high > high
potential_ob = low
touches = 0
for j = 0 to i-1
if low <= potential_ob * 1.002 and low >= potential_ob * 0.998
touches += 1
if touches >= ob_min_touches
bullish_ob_level := potential_ob
bullish_ob_strength := touches
break
// كتلة مقاومة هابطة
for i = 1 to ob_lookback
if i < bar_index
if high > high and high > high and low < low
potential_ob = high
touches = 0
for j = 0 to i-1
if high >= potential_ob * 0.998 and high <= potential_ob * 1.002
touches += 1
if touches >= ob_min_touches
bearish_ob_level := potential_ob
bearish_ob_strength := touches
break
// كشف الاختراق
bullish_breakout = not na(bearish_ob_level) and close > bearish_ob_level and close <= bearish_ob_level
bearish_breakout = not na(bullish_ob_level) and close < bullish_ob_level and close >= bullish_ob_level
ob_signal = bullish_breakout ? 2 : bearish_breakout ? -2 : close > bullish_ob_level ? 1 : close < bearish_ob_level ? -1 : 0
// حساب سوبرترند
calculate_supertrend() =>
= request.security(syminfo.tickerid, timeframe_setting, ta.supertrend(atr_multiplier, atr_period))
st_signal = direction == -1 ? 2 : direction == 1 ? -2 : 0
st_signal
// تحليل الترند/القناة
calculate_trendline_channel() =>
var line upper_trendline = na
var line lower_trendline = na
var float upper_slope = 0.0
var float lower_slope = 0.0
pivot_high = ta.pivothigh(high, 5, 5)
pivot_low = ta.pivotlow(low, 5, 5)
highs = array.new_float(0)
lows = array.new_float(0)
for i = 0 to math.min(trendline_lookback, bar_index)
if high == ta.highest(high, 11)
array.push(highs, high )
if low == ta.lowest(low, 11)
array.push(lows, low )
upper_trend = ta.highest(high, trendline_lookback)
lower_trend = ta.lowest(low, trendline_lookback)
mid_trend = (upper_trend + lower_trend) / 2
channel_width = (upper_trend - lower_trend) * channel_width_multiplier
upper_channel = mid_trend + channel_width / 2
lower_channel = mid_trend - channel_width / 2
trendline_signal = close > upper_channel ? 2 : close < lower_channel ? -2 : close > mid_trend ? 1 : close < mid_trend ? -1 : 0
trendline_signal
// تحليل الحجم
calculate_volume_analysis() =>
vol = request.security(syminfo.tickerid, timeframe_setting, volume)
vol_ma = request.security(syminfo.tickerid, timeframe_setting, ta.sma(volume, volume_ma_period))
volume_ratio = vol / vol_ma
is_volume_spike = volume_ratio > volume_threshold
obv = request.security(syminfo.tickerid, timeframe_setting, ta.obv)
obv_ma = request.security(syminfo.tickerid, timeframe_setting, ta.sma(ta.obv, 20))
vpt = request.security(syminfo.tickerid, timeframe_setting, ta.cum((close - close ) / close * volume))
vpt_ma = request.security(syminfo.tickerid, timeframe_setting, ta.sma(ta.cum((close - close ) / close * volume), 20))
mfi = request.security(syminfo.tickerid, timeframe_setting, ta.mfi(hlc3, 14))
ad = request.security(syminfo.tickerid, timeframe_setting, ta.cum(((close - low) - (high - close)) / (high - low) * volume))
ad_ma = request.security(syminfo.tickerid, timeframe_setting, ta.sma(ta.cum(((close - low) - (high - close)) / (high - low) * volume), 20))
volume_signal = 0
volume_signal += is_volume_spike and close > close ? 2 : is_volume_spike and close < close ? -2 : 0
volume_signal += obv > obv_ma ? 1 : obv < obv_ma ? -1 : 0
volume_signal += vpt > vpt_ma ? 1 : vpt < vpt_ma ? -1 : 0
volume_signal += mfi > 70 ? -1 : mfi < 30 ? 1 : 0
volume_signal += ad > ad_ma ? 1 : ad < ad_ma ? -1 : 0
volume_signal
// حساب المؤشرات الجديدة
= detect_order_blocks()
st_signal = calculate_supertrend()
trendline_signal = calculate_trendline_channel()
volume_signal = calculate_volume_analysis()
// دوال تقييم الإشارات
get_oscillator_signal(value, overbought, oversold) =>
value > overbought ? -2 : value > (overbought + oversold) / 2 ? -1 : value < oversold ? 2 : value < (overbought + oversold) / 2 ? 1 : 0
get_ma_signal(price, ma_value) =>
if not na(ma_value) and ma_value != 0
diff_pct = (price - ma_value) / ma_value * 100
diff_pct > 2 ? 2 : diff_pct > 0 ? 1 : diff_pct < -2 ? -2 : diff_pct < 0 ? -1 : 0
else
0
// حساب الإشارات
rsi_signal = get_oscillator_signal(rsi, 70, 30)
stoch_signal = get_oscillator_signal(stoch_k, 80, 20)
cci_signal = get_oscillator_signal(cci, 100, -100)
williams_signal = get_oscillator_signal(williams_r, -20, -80)
macd_signal = macd_line > signal_line ? 1 : macd_line < signal_line ? -1 : 0
momentum_signal = momentum > 0 ? 1 : momentum < 0 ? -1 : 0
roc_signal = roc > 2 ? 1 : roc < -2 ? -1 : 0
bb_signal = current_price > bb_upper ? -1 : current_price < bb_lower ? 1 : 0
sma10_signal = get_ma_signal(current_price, sma10)
sma20_signal = get_ma_signal(current_price, sma20)
sma50_signal = get_ma_signal(current_price, sma50)
sma100_signal = get_ma_signal(current_price, sma100)
sma200_signal = get_ma_signal(current_price, sma200)
ema10_signal = get_ma_signal(current_price, ema10)
ema20_signal = get_ma_signal(current_price, ema20)
ema50_signal = get_ma_signal(current_price, ema50)
// تجميع الإشارات
oscillator_total = rsi_signal + stoch_signal + cci_signal + williams_signal + macd_signal + momentum_signal + roc_signal + bb_signal
ma_total = sma10_signal + sma20_signal + sma50_signal + sma100_signal + sma200_signal + ema10_signal + ema20_signal + ema50_signal
advanced_total = ob_signal + st_signal + trendline_signal + volume_signal
// حساب الإجمالي الكلي
overall_total = oscillator_total + ma_total + advanced_total
// دوال حجم النص حسب حجم اللوحة
get_header_size() =>
dashboard_size == "صغير" ? size.small : dashboard_size == "عادي" ? size.normal : dashboard_size == "كبير" ? size.large : dashboard_size == "كبير جداً" ? size.huge : size.normal
get_main_text_size() =>
dashboard_size == "صغير" ? size.tiny : dashboard_size == "عادي" ? size.normal : dashboard_size == "كبير" ? size.large : dashboard_size == "كبير جداً" ? size.huge : size.normal
get_secondary_text_size() =>
dashboard_size == "صغير" ? size.tiny : dashboard_size == "عادي" ? size.small : dashboard_size == "كبير" ? size.normal : dashboard_size == "كبير جداً" ? size.large : size.small
get_progress_size() =>
dashboard_size == "صغير" ? size.tiny : dashboard_size == "عادي" ? size.tiny : dashboard_size == "كبير" ? size.small : dashboard_size == "كبير جداً" ? size.normal : size.tiny
// دالة ترجمة الإشارة
get_signal_text_and_color(total, threshold_strong_buy, threshold_buy, threshold_sell, threshold_strong_sell) =>
signal_txt = ""
signal_col = neutral_color
if total >= threshold_strong_buy
signal_txt := "شراء قوي"
signal_col := strong_buy_color
else if total >= threshold_buy
signal_txt := "شراء"
signal_col := buy_color
else if total >= threshold_sell and total <= -threshold_sell
signal_txt := "محايد"
signal_col := neutral_color
else if total >= threshold_strong_sell
signal_txt := "بيع"
signal_col := sell_color
else
signal_txt := "بيع قوي"
signal_col := strong_sell_color
// دالة شريط التقدم
create_progress_bar(value, max_value) =>
if max_value == 0
"▱▱▱▱▱▱▱▱▱▱"
else
filled_bars = math.round(math.abs(value) / max_value * 10)
filled_bars := math.min(filled_bars, 10)
progress_str = ""
for i = 1 to 10
progress_str := progress_str + (i <= filled_bars ? "▰" : "▱")
progress_str
// دالة عد إشارات الشراء/البيع
count_buy_sell_signals(total, max_signals) =>
buy_count = 0
sell_count = 0
neutral_count = 0
if total > 0
buy_count := math.min(total, max_signals)
else if total < 0
sell_count := math.min(math.abs(total), max_signals)
remaining = max_signals - buy_count - sell_count
neutral_count := math.max(0, remaining)
// رسم الجدول بالعربية
if barstate.islast
rows = 6
columns = 0
if show_summary
columns += 1
if show_oscillators
columns += 1
if show_moving_averages
columns += 1
if show_ob_analysis
columns += 1
if show_supertrend
columns += 1
if show_trendline
columns += 1
if show_volume
columns += 1
if columns > 0
var table dashboard = table.new(position.bottom_center, columns, rows, bgcolor=bg_primary, border_width=2, border_color=royal_blue)
table.clear(dashboard, 0, 0, columns - 1, rows - 1)
theme_indicator = theme_setting == "مضيء" ? "☀️" : "🌙"
header_text = theme_indicator + " محلل السوق الكمي DR-KSA | " + syminfo.ticker + " | بيانات مباشرة " + theme_indicator
table.cell(dashboard, 0, 0, header_text, text_color=color.white, bgcolor=royal_blue, text_size=get_header_size())
table.merge_cells(dashboard, 0, 0, columns - 1, 0)
current_col = 0
// الملخص
if show_summary
max_signals = 20
= get_signal_text_and_color(overall_total, 10, 4, -4, -10)
= count_buy_sell_signals(overall_total, max_signals)
table.cell(dashboard, current_col, 1, "الملخص", text_color=color.white, bgcolor=royal_blue_light, text_size=get_secondary_text_size())
table.cell(dashboard, current_col, 2, summary_text, text_color=summary_color, bgcolor=bg_secondary, text_size=get_main_text_size())
if show_progress_bars
progress_bar = create_progress_bar(overall_total, max_signals)
table.cell(dashboard, current_col, 3, progress_bar, text_color=summary_color, bgcolor=bg_secondary, text_size=get_progress_size())
else
table.cell(dashboard, current_col, 3, "", bgcolor=bg_secondary)
buy_text = "شراء: " + str.tostring(summary_buy)
neutral_text = "محايد: " + str.tostring(summary_neutral)
sell_text = "بيع: " + str.tostring(summary_sell)
table.cell(dashboard, current_col, 4, buy_text, text_color=buy_color, bgcolor=bg_secondary, text_size=get_secondary_text_size())
table.cell(dashboard, current_col, 5, neutral_text + " | " + sell_text, text_color=text_secondary, bgcolor=bg_secondary, text_size=get_secondary_text_size())
current_col += 1
// المؤشرات الفنية
if show_oscillators
= get_signal_text_and_color(oscillator_total, 6, 2, -2, -6)
= count_buy_sell_signals(oscillator_total, 8)
table.cell(dashboard, current_col, 1, "المؤشرات الفنية", text_color=color.white, bgcolor=royal_blue_light, text_size=get_secondary_text_size())
table.cell(dashboard, current_col, 2, osc_text, text_color=osc_color, bgcolor=bg_secondary, text_size=get_main_text_size())
if show_progress_bars
osc_progress = create_progress_bar(oscillator_total, 8)
table.cell(dashboard, current_col, 3, osc_progress, text_color=osc_color, bgcolor=bg_secondary, text_size=get_progress_size())
else
table.cell(dashboard, current_col, 3, "", bgcolor=bg_secondary)
osc_buy_text = "شراء: " + str.tostring(osc_buy)
osc_neutral_text = "محايد: " + str.tostring(osc_neutral)
osc_sell_text = "بيع: " + str.tostring(osc_sell)
table.cell(dashboard, current_col, 4, osc_buy_text, text_color=buy_color, bgcolor=bg_secondary, text_size=get_secondary_text_size())
table.cell(dashboard, current_col, 5, osc_neutral_text + " | " + osc_sell_text, text_color=text_secondary, bgcolor=bg_secondary, text_size=get_secondary_text_size())
current_col += 1
// المتوسطات المتحركة
if show_moving_averages
= get_signal_text_and_color(ma_total, 6, 2, -2, -6)
= count_buy_sell_signals(ma_total, 8)
table.cell(dashboard, current_col, 1, "المتوسطات المتحركة", text_color=color.white, bgcolor=royal_blue_light, text_size=get_secondary_text_size())
table.cell(dashboard, current_col, 2, ma_text, text_color=ma_color, bgcolor=bg_secondary, text_size=get_main_text_size())
if show_progress_bars
ma_progress = create_progress_bar(ma_total, 8)
table.cell(dashboard, current_col, 3, ma_progress, text_color=ma_color, bgcolor=bg_secondary, text_size=get_progress_size())
else
table.cell(dashboard, current_col, 3, "", bgcolor=bg_secondary)
ma_buy_text = "شراء: " + str.tostring(ma_buy)
ma_neutral_text = "محايد: " + str.tostring(ma_neutral)
ma_sell_text = "بيع: " + str.tostring(ma_sell)
table.cell(dashboard, current_col, 4, ma_buy_text, text_color=buy_color, bgcolor=bg_secondary, text_size=get_secondary_text_size())
table.cell(dashboard, current_col, 5, ma_neutral_text + " | " + ma_sell_text, text_color=text_secondary, bgcolor=bg_secondary, text_size=get_secondary_text_size())
current_col += 1
// الكتل السعرية
if show_ob_analysis
ob_text = ob_signal == 2 ? "اختراق صاعد" : ob_signal == -2 ? "اختراق هابط" : ob_signal == 1 ? "فوق الدعم" : ob_signal == -1 ? "تحت المقاومة" : "محايد"
ob_color = ob_signal >= 1 ? buy_color : ob_signal <= -1 ? sell_color : neutral_color
table.cell(dashboard, current_col, 1, "الكتل السعرية", text_color=color.white, bgcolor=royal_blue_light, text_size=get_secondary_text_size())
table.cell(dashboard, current_col, 2, ob_text, text_color=ob_color, bgcolor=bg_secondary, text_size=get_main_text_size())
if show_progress_bars
ob_progress = create_progress_bar(ob_signal, 2)
table.cell(dashboard, current_col, 3, ob_progress, text_color=ob_color, bgcolor=bg_secondary, text_size=get_progress_size())
else
table.cell(dashboard, current_col, 3, "", bgcolor=bg_secondary)
ob_level_text = not na(bullish_ob) ? "دعم: " + str.tostring(bullish_ob, "#.##") : "دعم: غير متوفر"
ob_resist_text = not na(bearish_ob) ? "مقاومة: " + str.tostring(bearish_ob, "#.##") : "مقاومة: غير متوفر"
table.cell(dashboard, current_col, 4, ob_level_text, text_color=text_secondary, bgcolor=bg_secondary, text_size=get_secondary_text_size())
table.cell(dashboard, current_col, 5, ob_resist_text, text_color=text_secondary, bgcolor=bg_secondary, text_size=get_secondary_text_size())
current_col += 1
// سوبرترند
if show_supertrend
st_text = st_signal == 2 ? "اتجاه صاعد" : st_signal == -2 ? "اتجاه هابط" : "محايد"
st_color = st_signal == 2 ? buy_color : st_signal == -2 ? sell_color : neutral_color
table.cell(dashboard, current_col, 1, "سوبرترند", text_color=color.white, bgcolor=royal_blue_light, text_size=get_secondary_text_size())
table.cell(dashboard, current_col, 2, st_text, text_color=st_color, bgcolor=bg_secondary, text_size=get_main_text_size())
if show_progress_bars
st_progress = create_progress_bar(st_signal, 2)
table.cell(dashboard, current_col, 3, st_progress, text_color=st_color, bgcolor=bg_secondary, text_size=get_progress_size())
else
table.cell(dashboard, current_col, 3, "", bgcolor=bg_secondary)
st_period_text = "فترة ATR: " + str.tostring(atr_period)
st_mult_text = "المضاعف: " + str.tostring(atr_multiplier)
table.cell(dashboard, current_col, 4, st_period_text, text_color=text_secondary, bgcolor=bg_secondary, text_size=get_secondary_text_size())
table.cell(dashboard, current_col, 5, st_mult_text, text_color=text_secondary, bgcolor=bg_secondary, text_size=get_secondary_text_size())
current_col += 1
// الترند/القناة
if show_trendline
tl_text = trendline_signal == 2 ? "اختراق علوي" : trendline_signal == -2 ? "اختراق سفلي" : trendline_signal == 1 ? "فوق المتوسط" : trendline_signal == -1 ? "تحت المتوسط" : "محايد"
tl_color = trendline_signal >= 1 ? buy_color : trendline_signal <= -1 ? sell_color : neutral_color
table.cell(dashboard, current_col, 1, "الترند/القناة", text_color=color.white, bgcolor=royal_blue_light, text_size=get_secondary_text_size())
table.cell(dashboard, current_col, 2, tl_text, text_color=tl_color, bgcolor=bg_secondary, text_size=get_main_text_size())
if show_progress_bars
tl_progress = create_progress_bar(trendline_signal, 2)
table.cell(dashboard, current_col, 3, tl_progress, text_color=tl_color, bgcolor=bg_secondary, text_size=get_progress_size())
else
table.cell(dashboard, current_col, 3, "", bgcolor=bg_secondary)
tl_lookback_text = "الفترة: " + str.tostring(trendline_lookback)
tl_width_text = "العرض: " + str.tostring(channel_width_multiplier)
table.cell(dashboard, current_col, 4, tl_lookback_text, text_color=text_secondary, bgcolor=bg_secondary, text_size=get_secondary_text_size())
table.cell(dashboard, current_col, 5, tl_width_text, text_color=text_secondary, bgcolor=bg_secondary, text_size=get_secondary_text_size())
current_col += 1
// الحجم
if show_volume
vol_text = volume_signal >= 3 ? "تجميع عالي" : volume_signal >= 1 ? "تجميع" : volume_signal <= -3 ? "توزيع عالي" : volume_signal <= -1 ? "توزيع" : "محايد"
vol_color = volume_signal >= 1 ? buy_color : volume_signal <= -1 ? sell_color : neutral_color
table.cell(dashboard, current_col, 1, "الحجم", text_color=color.white, bgcolor=royal_blue_light, text_size=get_secondary_text_size())
table.cell(dashboard, current_col, 2, vol_text, text_color=vol_color, bgcolor=bg_secondary, text_size=get_main_text_size())
if show_progress_bars
vol_progress = create_progress_bar(volume_signal, 5)
table.cell(dashboard, current_col, 3, vol_progress, text_color=vol_color, bgcolor=bg_secondary, text_size=get_progress_size())
else
table.cell(dashboard, current_col, 3, "", bgcolor=bg_secondary)
vol_ma_text = "متوسط الحجم: " + str.tostring(volume_ma_period)
vol_threshold_text = "عتبة الارتفاع: " + str.tostring(volume_threshold) + "x"
table.cell(dashboard, current_col, 4, vol_ma_text, text_color=text_secondary, bgcolor=bg_secondary, text_size=get_secondary_text_size())
table.cell(dashboard, current_col, 5, vol_threshold_text, text_color=text_secondary, bgcolor=bg_secondary, text_size=get_secondary_text_size())
plot(na)
Coinbase Global, Inc. Shs A Cert Deposito Arg Repr 0.037037037 Sh
لا صفقات
تحاليل تداول COINB

كوين بيس تحقق مكاسب مدفوعة بوضوح تنظيميارتفعت أسهم شركة Coinbase بشكل ملحوظ خلال الأسبوع الماضي، مسجّلةً واحدة من أكبر مكاسبها الأسبوعية لهذا العام. ويُعزى هذا الارتفاع ليس إلى تحركات أسعار العملات الرقمية، وإنما إلى موجة من التفاؤل بشأن الأطر التنظيمية، والموقع الاستراتيجي الذي تحتله كوين بيس (Coinbase) ضمن هذا التحول.
انفراج تنظيمي يشعل موجة الارتفاع
جاءت موجة الارتفاع الأخيرة على خلفية مصادقة مجلس الشيوخ الأمريكي على قانون GENIUS، وهو تشريع محوري يهدف إلى توفير إشراف فيدرالي وتنظيم واضح لسوق العملات المستقرة. يتضمن القانون قواعد صارمة بشأن دعم الاحتياطيات وإجراء عمليات تدقيق دورية، ما يوفر البنية التنظيمية التي طالما انتظرها المستثمرون المؤسسيون، وقد يفتح المجال أمام تدفقات مالية بمليارات الدولارات مستقبلاً.
وبالنسبة لـ Coinbase، فإن هذه التطورات تتجاوز مجرد التفاؤل العام. فقد شاركت الشركة في تأسيس العملة المستقرة USDC بالتعاون مع شركة Circle، وتحقق ما نسبته 50٪ من عائدات احتياطيات USDC. وباتت العملات المستقرة تمثّل ثاني أكبر مصدر دخل للشركة بعد نشاطات التداول، كما أن الطرح العام الأولي الأخير لـ Circle عزّز ثقة المستثمرين بنموذج الأعمال المعتمد. ومع تموضع USDC في صميم منظومة Coinbase، بدأ السوق يُعيد تقييم سهم الشركة، لا باعتبارها مجرد منصة تداول، بل كمكوّن أساسي في البنية التحتية للتمويل الرقمي المنظم طويل الأجل.
هل ستستمر موجة الارتفاع؟
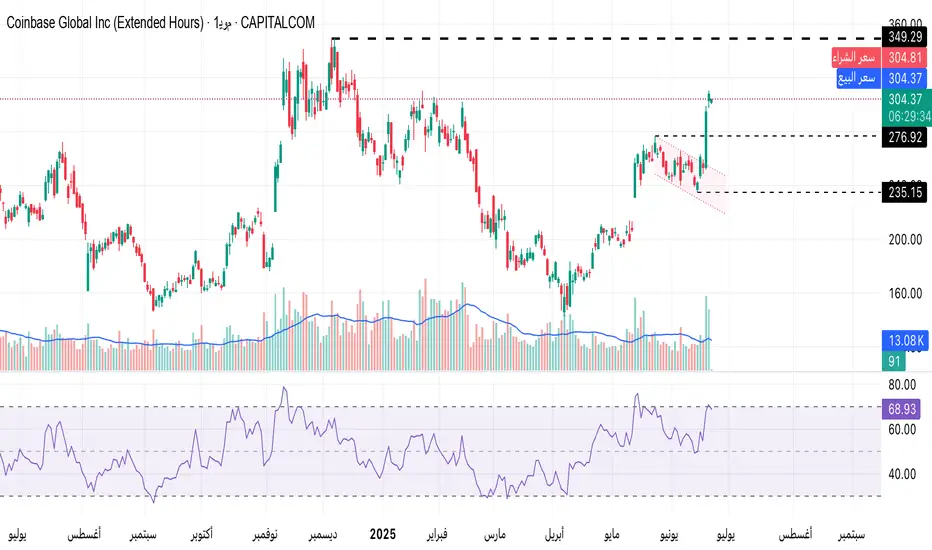
ثمة حجج قوية تشير إلى أن الارتفاع الأخير لا يُعد تحركًا مؤقتًا. فنيًا، بدأت Coinbase في تكوين زخم تصاعدي منذ مايو، حين قفز سهمها عقب الإعلان عن إدراجها في مؤشر S&P 500. تلا ذلك مرحلة من التماسك الجانبي الضيق، والتي شكّلت نمط "علم الثور" التقليدي. وقد جاء اختراق الأسبوع الماضي مصحوبًا بحجم تداول يفوق المتوسط، متجاوزًا قمم التأرجح الأخيرة، ومُهيئًا الأرضية لاحتمال إعادة اختبار ذروة ديسمبر. ويتجاوز مؤشر القوة النسبية RSI الآن مستوى 70، مما يدل على زخم قوي، ومن اللافت عدم وجود أي مؤشرات على تباعد سلبي، مما يُعطي إشارات بأن الاتجاه الصاعد لا يزال قائمًا.
أما من الناحية الأساسية، فتسعى Coinbase إلى الابتعاد عن نمط الإيرادات الدورية المرتبطة بتقلبات التداول. وتُظهر المنتجات الجديدة، مثل حل الدفع للتجار باستخدام USDC وبطاقة ائتمان مشفرة بالتعاون مع American Express، أن الشركة جادة في بناء مصدر دخل متكرر يعتمد على الاستخدام الفعلي. كما أن طموح الرئيس التنفيذي براين أرمسترونغ بأن تتفوق USDC على Tether وتصبح العملة المستقرة الرائدة عالميًا، يبدو أكثر واقعية ضمن إطار تنظيمي واضح.
ومع ذلك، فإن تقييم السهم لا يزال مرتفعًا. حيث يتم تداول السهم حاليًا بمعدل السعر إلى الأرباح الآجلة يبلغ 51.4، ونسبة السعر إلى المبيعات تتجاوز 11، بينما تتخطى نسبة القيمة المؤسسية إلى الأرباح قبل الفوائد والضرائب والاستهلاك والإطفاء 30. ومن المتوقع أن تنخفض ربحية السهم بنسبة 18٪ خلال هذا العام، وعلى الرغم من أن العائد على حقوق المساهمين يبلغ نسبة محترمة تُقدّر بـ 15.8٪، إلا أن السوق يسعّر السهم وفقًا لتوقعات نمو مستقبلية مرتفعة. ورغم ما تتمتع به Coinbase من جودة وزخم، يبقى التساؤل مطروحًا حول مدى استعداد المستثمرين ذوي التوجه القيمي لتحمل هذا التقييم المرتفع.
الرسم البياني اليومي لسهم COIN
الأداء السابق لا يُعد مؤشرًا موثوقًا للنتائج المستقبلية
إخلاء المسؤولية: ان هذا المقال هو لأغراض تعليمية فقط. لا تشكل المعلومات المقدمة نصيحة استثمارية ولا تأخذ في الاعتبار الظروف المالية الفردية أو أهداف أي مستثمر. أي معلومات قد يتم تقديمها فيما يتعلق بالأداء السابق ليست مؤشرًا موثوقًا به للنتائج أو الأداء المستقبلي.
إن 71%–82.67% من حسابات المستثمرين الأفراد تخسر الأموال عند تداول العقود مقابل الفروقات مع كابيتال دوت كوم غروب. يجب أن تفكر مليّاً فيما إذا كنت تفهم آلية عمل العقود مقابل الفروقات وما إذا كان بإمكانك تحمل المخاطر العاليّة المتمثلة في خسارة أموالك.
نماذج سعرية
لحظات لا تتكرر كثيرا بعد اعلان ايجابي من spx500
فنيا السهم تجاوز قيده التاريخي اخترق مقاومات متتالية ونماذج سعرية والموجة الآن صاعدة بثقة راقب مناطق التصحيح وكن مستعد فالسهم الآن ملك السوق 👑
🎯 الهدف الذهبي 248...270

استجابة سهم "كوين بيس" لفوز ترامبتتجه الأنظار نحو سهم كوين بيس عقب فوز دونالد ترامب الأخير في الانتخابات. دعونا نلقي نظرة على تأثير فوز ترامب على تنظيم العملات الرقمية والتوقعات الفنيّة والأساسية لـسهم كوين بيس.
تأثير فوز ترامب على تنظيم العملات الرقمية
أثار فوز ترامب تكهنات حول اتجاه تنظيم العملات الرقمية في ظل الإدارة الجديدة. هناك اهتمام كبير في السوق بشأن التغييرات التنظيمية المحتملة التي قد تؤثر على كيفية إدارة وتداول الأصول الرقمية في الولايات المتحدة.
يُعتبر سهم كوين بيس، كونه منصة للعملات الرقمية مطروحة للتداول العام، حساساً بشكل خاص للتحولات التنظيمية التي قد تؤثر على بيئة عمله. يراقب المستثمرون عن كثب أي مؤشرات على تغييرات في السياسات قد تؤثر على المشهد الأوسع للأصول الرقمية في السنوات القادمة.
التحليل الفني لـسهم كوين بيس
شهد سعر سهم كوين بيس مؤخرًا ارتفاعًا فوق المتوسط المتحرك لمدة 200 يوم، مدعوماً بزيادة ملحوظة في حجم التداول. ومع ذلك، أدى هذا الارتفاع إلى وصول الأسهم إلى منطقة مقاومة رئيسية شكلتها الارتفاعات في شهري مارس ويوليو.
نظراً لقوة الحركة الأخيرة ومستوى المقاومة عند هذه المنطقة السعرية، فإنه ليس من المستبعد حدوث فترة من التماسك أو التماسك قصير الأجل. في حال تجاوز السهم هذه المقاومة، قد يؤدي ذلك إلى اتجاه صعودي مستدام.
الرسم البياني للشموع على أساس يوم واحد لـسهم COIN
الأداء السابق ليس مؤشراً موثوقاً للنتائج المستقبلية
التحليل الأساسي لـسهم كوين بيس
من الناحية الأساسية، يقدم سهم كوين بيس صورة متباينة. فقد شهدت الشركة زيادة بنسبة 99% في الإيرادات خلال الأشهر التسعة الماضية، مما يعد إيجابياً بشكل واضح. ومع ذلك، يتم تداول الأسهم بنسبة ربحية متقدمة قدرها 71.2، مما يشير إلى أن المستثمرين يدفعون علاوة مقابل النمو.
في حين أن سهم كوين بيس يحافظ على هامش تشغيلي قوي بنسبة 26.81% وعائد على حقوق الملكية بنسبة 21.3%، إلا أن أرباح الشركة كانت متقلبة، متأثرة بتذبذب حجم التداول في العملات الرقمية. وبالنظر إلى المستقبل، ستعتمد قدرة الشركة على زيادة حصتها في السوق بشكل كبير على مسار سوق العملات الرقمية والتغيرات التنظيمية، خاصةً في ظل تأثير محتمل لإدارة ترامب على الأصول الرقمية.
إخلاء المسؤولية: ان هذا المقال هو لأغراض تعليمية فقط. لا تشكل المعلومات المقدمة نصيحة استثمارية ولا تأخذ في الاعتبار الظروف المالية الفردية أو أهداف أي مستثمر. أي معلومات قد يتم تقديمها فيما يتعلق بالأداء السابق ليست مؤشرًا موثوقًا به للنتائج أو الأداء المستقبلي.
إن 71%–82.67% من حسابات المستثمرين الأفراد تخسر الأموال عند تداول العقود مقابل الفروقات مع كابيتال دوت كوم غروب. يجب أن تفكر مليّاً فيما إذا كنت تفهم آلية عمل العقود مقابل الفروقات وما إذا كان بإمكانك تحمل المخاطر العاليّة المتمثلة في خسارة أموالك.

سهم coin جاهز للبوت باذن الله السهم نشاطه منصة لتداول العملات الرقمية ويتاثر سلبا وايجابا بسعر البيتكوين ....فنيا اراه قاب قوسين او ادنى من البوط والله اعلم

توقع لسهم COINBASE مع نتائج الارباح توقع لسهم COINBASE مع نتائج الارباح للربع الرابع من 2023 والتي اعلنت 15 فبراير 2024 وكانت اعلى من التوقعات طبعاالسهم اعلنت الدخول به للاصدقاء عند سعر 122 ووصل بفضل الله لمنطقه العرض 184 وفي حال الثبات فوقها سيكون مساره بالخط الاخضر لمنطقة العرض 250 ثم العودة ومواصله المسير لمنطقة 315 وهذا مرهون بأغلاق اسبوعي فوق 184


COIN NASDAQ:COIN
سهم منصة كوين بيس على فريم الساعة مناطق الشراء باللون الاحمر
اهداف محددة باللون الازرق شرط الصعوداختراق المنطقة المذكورة
لتعلم المزيد حول التحليل الفني والأسواق المالية تفضل بزيارة موقعنا اعلى الصفحة


تحليل فني لسهم COINمنطقة اختراق /246.27
هدف /256.26
هدف /281.99
الدعم /214.64
وقف خسارة /
NASDAQ:COIN
تحليل فني ليس توصية شراء أو بيع ..

كيفية استخدام عملات TradingView الافتراضيةهل أردت يومًا أن تُظهر تقديرك لفكرة ما ولكنك شعرت أن مجرد الضغط على زر الإعجاب ليس كافيًا؟
تعتبر عملات TradingView طريقة رائعة لتظهر للمستخدمين الآخرين أنك تقدر أعمالهم!
ما هي عملات TradingView؟
عملات TradingView الافتراضية هي العملة الخاصة بالموقع. 1 عملة افتراضية تعادل 0.01 دولار أمريكي.
كيف يمكنك الحصول عليها؟
إحالة صديق : عندما تحيل صديقًا إلى TradingView، سيحصل كلاكما على عملات TradingView بعد الترقية إلى إحدى عضوياتنا المدفوعة.
تلقي تبرعات من مستخدمين آخرين: يمكن لمستخدمي TradingView أن يتبرعوا بعملات افتراضية مقابل محتوى رائع، كطريقة لشكرك، أو لأي سبب آخر.
شراء عملات افتراضية: يمكنك شراء العملات الافتراضية على دفعات من 500 أو 1000 أو 5000. يمكن القيام بذلك عن طريق فتح قائمة المستخدم واختيار "عملات افتراضية".
(يظهر هنا أيضًا رصيدك الحالي من العملات وسجل التبرعات ومعلومات أخرى)
رائع! الآن بعد أن أصبح لديك الكثير من عملات TradingView، كيف يمكنك استخدامها؟
شجّع شخصاً ما : يعتبر التشجيع طريقة رائعة لإظهار دعمك للمستخدمين الذين تقدرهم.
يتم تحديد حجم إرسال عملتك الافتراضية على موقعنا بالقيم التالية: 100 أو 200 أو 350 أو 500 عملة. هذه القيم تعادل 1 دولار و 2 دولار و 3.50 دولار و 5 دولارات أمريكية. هذه الميزة متاحة لجميع المستخدمين.
شجع فكرة أو تحليلاً باستخدام الزر "تعليق مع التشجيع" لكتابة تعليق بوالتبرع بعملات TradingView
شجع مستخدماً من ملفه الشخصي عن طريق تحديد "تشجيع" في الزاوية العلوية من صفحة ملفه الشخصي.
شراء عضوية مدفوعة : يمكنك إنفاق عملات TradingView على العضويات المدفوعة لمدة شهر أو عام واحد. على سبيل المثال، تمنحك 3000 عملة إمكانية الاشتراك في شهر واحد من PRO+، أحد أكثر العضويات شعبية على موقعنا.
لاحظ أنه إذا كانت لديك عضوية نشطة بالفعل، فيمكنك إضافة شهر أو سنة من نفس النوع بالعملات الافتراضية. ترقية باستخدام عملات افتراضية غير مدعومة حالياً.
نصائح حول عملات TradingView
يقدم المشرفون والمديرون والموظفون في TradingView عملات افتراضية للأفكار المختارة حسب اختيارات المحرر للنصوص البرمجية والأفكار والمحتويات الاستثنائية الأخرى.
يمكن التعرف عليهم من خلال شعار TradingView أو شارة "Mod" بجوار اسمهم.
تعرف على المزيد حول العملات الافتراضية TradingView في مركز المساعدة هنا

كيفية إضافة الرموز التعبيرية إلى رسمك البيانيإذا قمت بنشر الكثير من الأبحاث من حساب TradingView الخاص بك، فإن الرموز التعبيرية ستمنح القراء طريقة أخرى للتفاعل مع عملك. الرموز التعبيرية معروفة على مستوى العالم ويمكن أن تساعد الآخرين على فهم طريقة تفكيرك أو شعورك بشكل أفضل. يمكن استخدامها أيضًا كتذكير أو ملاحظات سريعة.
فيما يلي كيفية إضافة الرموز التعبيرية إلى الرسم البياني الخاص بك:
1 انسخ والصق رمزًا تعبيريًا مباشرةً في أداة مربع النص مثل هذا 👋. إذا كنت بحاجة إلى مساعدة في العثور على رمز تعبيري لنسخه ولصقه، فهناك العديد من مواقع الويب التي تسهل القيام بذلك. يمكنك إضافة رموز تعبيرية إلى أي مربع نص أو أداة رسم تدعم النص.
2 الطريقة الثانية هي استخدام أداة اللافتة. توجد أداة اللافتة في أداة الملاحظات والتوضيحات على الجانب الأيسر من الرسم البياني. حدد اللافتة، ضعها على الرسم البياني، ثم افتح إعداداتها لإضافة رمز تعبيري. يمكن استخدام أداة اللافتة لكتابة ملاحظات مفصلة عند مستويات أسعار محددة. هي سهلة الاستخدام وقابل للتخصيص ويمكن وضعها على أي نقطة على الرسم البياني. لقد قمنا بتضمين بعض الأمثلة على الرسم البياني أعلاه حيث قمنا أيضًا بتخصيص لون الخلفية لكل لافتة.😎🐻 🥶🐂
شكراً للمتابعة! إذا كانت لديك أي أسئلة أو تعليقات فلا تتردد في مشاركتها معنا. فريقنا يتطلع للمساعدة دائماً.
