TSLA: WaverVanir Edge – $TSLA Daily Outlook⚡ WaverVanir Edge – NASDAQ:TSLA Daily Outlook
NASDAQ:TSLA rejected from the 0.382 Fib ($466.9) and is hovering near $445, showing short-term weakness after an extended rally.
Auto-Fib map reveals liquidity clusters:
🟢 Premium Zones: $484 → $501 → $525 (target expansion levels)
🔴 Discount Zone: $411.6 major support
⚖️ Current equilibrium around $445 — consolidation before directional break.
WaverVanir DSS: Bearish divergence (−14% 30-day projection)
Institutional Model: Bullish rebound (+9% target → $485.6)
Edge Consensus: ⚠️ Range compression — volatility pocket between $411 and $466.
🌍 Macro & Catalysts
⚙️ FSD/AI expansion and Energy storage growth remain medium-term bullish
💰 Margins still under pressure amid price cuts & China competition
🏦 Fed tone mildly dovish → liquidity supportive, but yield volatility persists
🔋 Watch raw material cost trends (lithium, nickel) into Q1-2026
Base Path (WaverVanir Scenario):
Pullback → $420–$411 → re-accumulation → breakout >$466 to retest $484
“When volatility converges, conviction breaks. Patience over bias.”
#TSLA #WaverVanir #VolanXDSS #Fibonacci #SmartMoneyConcepts #AITrading #Macro #ElonMusk #StockMarket #RiskOn
Trade ideas

TSLA eyes on $448 above 409 below: Dual Goldens will tell ALLTSLA range bound and looking for direction.
Again testing a Golden Covid fib at $448.01
Support below is a Golden Genesis at $409.56
What happens here will signal TOP or Continuation.
Bulls want a Break-n-Retest of the dashed Covid fib.
Bears want a B-n-R of the solid golden Genesis below.

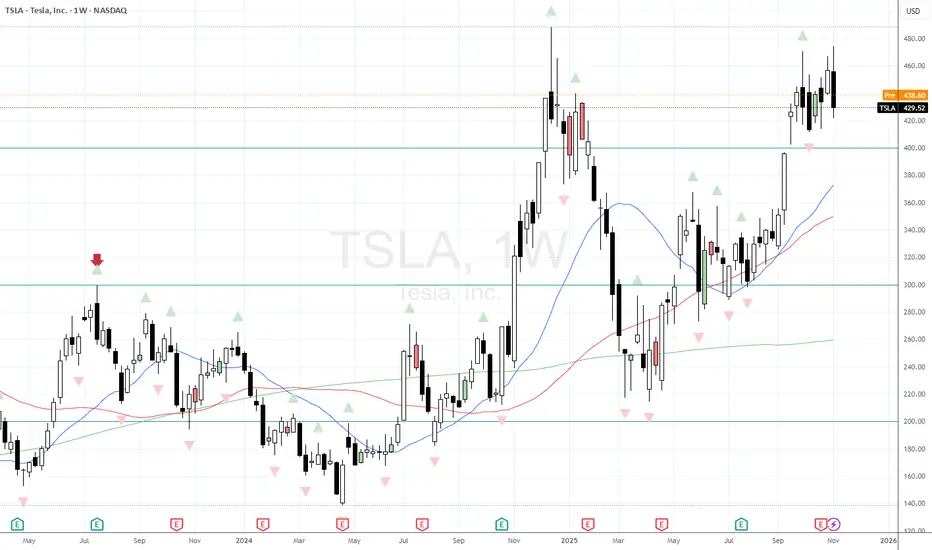
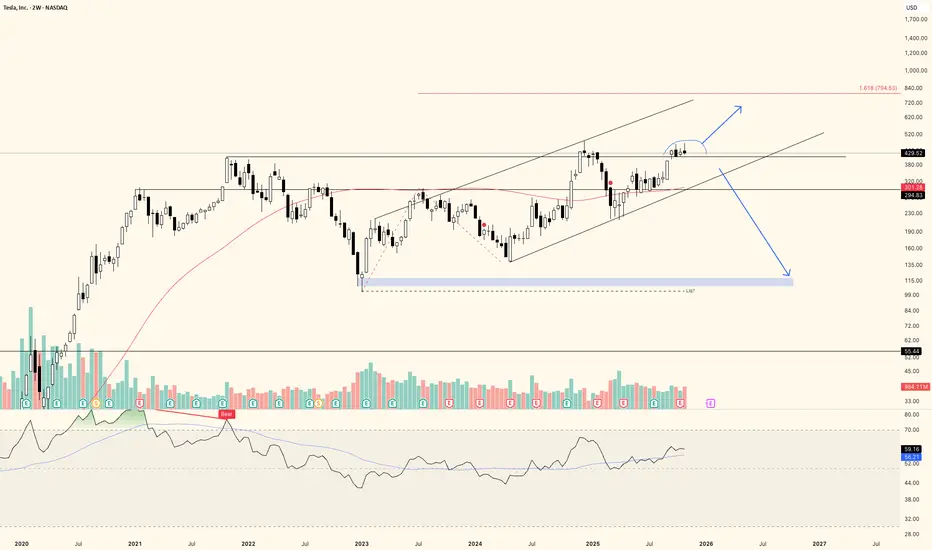
Tesla - Stay patient and don’t rush in 🔮 Tesla (TSLA) – Long-Term Weekly Outlook
Based on the weekly timeframe, Tesla has completed its historical bullish cycle, topping out at $488.54, and has since entered a major corrective phase that has lasted for nearly two years.
This structural correction now appears to be in its final stages, as the price consolidates within what looks like a clear institutional accumulation zone.
---
⚙️ Key Technical Zones
The 2020 Point of Control (POC) around $219.42 represents the core price level that supported Tesla’s previous major rally.
The long-term ascending trendline passes right through this area, reinforcing it as a major structural support.
Just below lies the $183–$185 region, which marks a powerful confluence zone of:
Fibonacci 0.786 retracement,
a historical VWAP level near $183.60, and
the beginning of a strong volume node on the profile.
> This region is what institutions often refer to as the “final accumulation zone” — where large investors quietly rebuild positions before the next expansion phase begins.
---
📉 Expected Scenario Before the Next Rally
During the first quarter of 2026, Tesla is expected to experience one last corrective leg, gradually pulling back toward the $185 level, which aligns perfectly with the 0.786 Fibonacci retracement.
This move will likely act as a liquidity sweep — shaking out late buyers and triggering stop-losses — before institutions start accumulating heavily again.
---
💰 Smart Buying Zone
Optimal entry range: $183 – $190
Entry confirmation: A strong bullish weekly candle with rising volume emerging from the support zone
Protective stop: Weekly close below $170
Projected upside targets:
1. $295
2. $340
3. $396
4. $475
5. $520
These represent the key stages of Tesla’s expected bullish recovery cycle for 2026–2027.
---
🧠 Institutional Perspective
Large funds (“the whales”) are patiently waiting for this final phase of the correction to rebuild their long-term positions at discounted prices.
Between March and May 2026, the accumulation process is expected to complete, marking the beginning of Tesla’s next major bull cycle.
---
✅ Summary
The final downside scenario projects a move to around $185,
right at the 0.786 Fibonacci level — the last golden buying zone before the next historical rally begins.
⏳ Recommendation:
> Stay patient and don’t rush in — the real buying opportunity will come with the whales 🐳
in the $183–$185 zone, where smart money quietly re-enters the market.

Tesla prints a weekly Key Reversal as part of a triple topTesla has been a volatile stock this year - and difficult to trade because of that.
However I now see that we've printed a weekly bearish key reversal as part of a double/ triple top. Is this now indication that we're likely to flow lower in the immediate future?
Well I am expecting some giddiness if they manage to end the US Gov't Shutdown, so it may help push prices higher for a day or two...and then the trend re-exerts itself?
Bearish in the short term after the relief rally bump.
TSLA Setting Up for a Big Move This Week (Nov 10–14)Here’s the full multi-timeframe outlook for TSLA based on SMC structure, channels, BOS/CHoCH shifts, momentum, and the GEX map. Each section is separated so you can attach the matching chart under it.
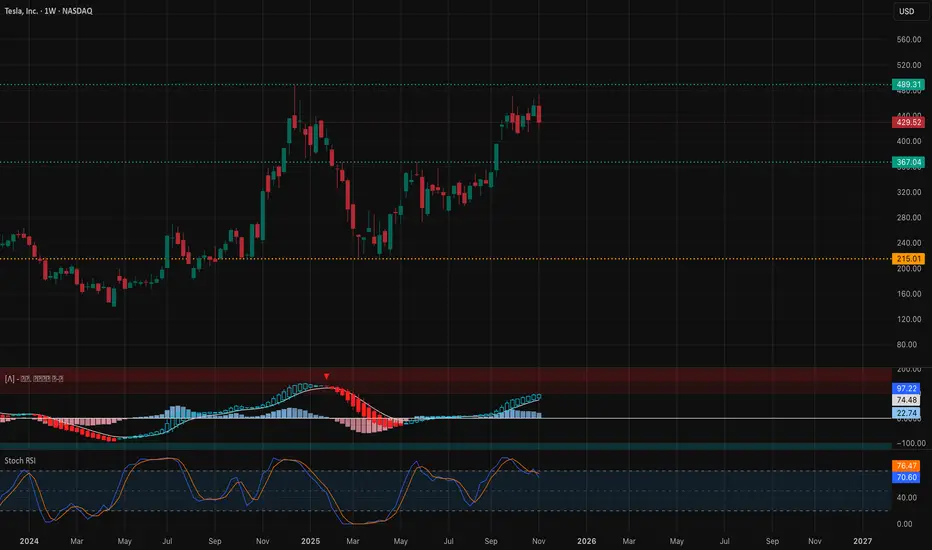
1. Weekly Timeframe (1W)
Macro Structure
TSLA is still holding its bigger weekly breakout after clearing the long-term descending trendline. The pullback off 480 looks like a standard retest rather than a reversal.
Weekly demand at 368–402 hasn’t been touched, so the broader trend still favors the upside as long as price stays above that region. Weekly MACD momentum continues to rise while Stoch RSI cools off, signaling consolidation rather than weakness.
Weekly Trade View
As long as TSLA stays above 402, the weekly bias remains bullish with potential to retest 486 once shorter timeframes settle.
Weekly GEX View
Large positive GEX above 470–480 slows upside momentum.
Large negative GEX under 420 accelerates downside moves.
TSLA currently sits between these zones, so whichever side breaks gets momentum.
2. Daily Timeframe (1D)
Daily Trend
The daily chart just printed a downside CHoCH inside the ascending channel. That confirms short-term weakness even though the weekly remains bullish.
The key line is 411–415. Losing this level flips the daily fully bearish. Holding it keeps the pullback healthy.
Daily MACD is red and still heading down. Stoch RSI is oversold but hasn’t curled up yet, meaning momentum hasn’t turned.
Daily Trade View
Hold 411 → potential bounce into 438 then 455.
Break 411 → opens a move toward 392–368.
Daily GEX View
Multiple put walls at 421–425 and 400.
These usually act as magnets during pullbacks because of dealer hedging.
3. 1-Hour Timeframe (1H)
Short-Term Structure
TSLA remains in a descending channel on the 1H. The most recent BOS was bearish, and the CHoCH didn’t reclaim any major highs.
The short-term pivot is 439. If TSLA stays under that line, momentum stays bearish.
MACD is flattening and Stoch RSI is trying to curl, hinting at a potential early-week bounce.
1H Trade View
Below 439 → bearish continuation.
Above 439 → opens a move into 447–455.
If TSLA can’t reclaim 432–439 early, expect another test toward 425–421.
4. 15-Minute Timeframe (15M)
Intraday Structure
The 15M shows a clean descending channel. Bulls attempted a small CHoCH, but without an upside BOS, momentum is still controlled by sellers.
The main intraday battle is 432–438.
Break above → intraday reversal.
Reject → continuation lower.
MACD is trying to turn but hasn’t built momentum yet.
15M Trade View
Break above 437–438 → scalp long toward 445.
Reject 432–434 → scalp short toward 425 and 421.
5. GEX Map & Options Strategy
GEX Interpretation for the Week
Positive GEX sits above 455–480
Negative GEX increases under 425
Major put wall at 421.88
Call walls thin around 445–465
What that means:
Upside above 455 slows down
Downside below 430 sharpens
421 is a strong gravitational level
A clean break below 421 increases volatility rapidly
Options Strategy
If TSLA fails to reclaim 438:
Short-dated puts targeting 421 make sense.
If TSLA reclaims 439 and holds:
Short-dated calls into 445–455 are reasonable.
Avoid deep OTM calls above 470 because price tends to stall in strong positive GEX zones.
My Thought
TSLA is sitting at a major inflection point. The weekly chart still leans bullish, but the daily and intraday structure are showing short-term weakness. This entire week will revolve around how price reacts around 438.
Rejecting 438 favors continuation into 425 and 421.
Reclaiming 438 puts 447–455 back into play.
Keep the levels simple. Let 438 decide the direction for the week.
Disclaimer
This analysis is for educational purposes only and not financial advice. Always trade your own plan and manage your risk. If you want a breakdown for another ticker, just let me know.
$TSLA: in a trading rangeNASDAQ:TSLA seems to be in a trading range to complete wave (4) of 3, and wave 4. Buying at the range low ($420-$430) and selling $450, $460 call options is my TSLA strategy for now for short term shares. I also have uncovered long term shares.

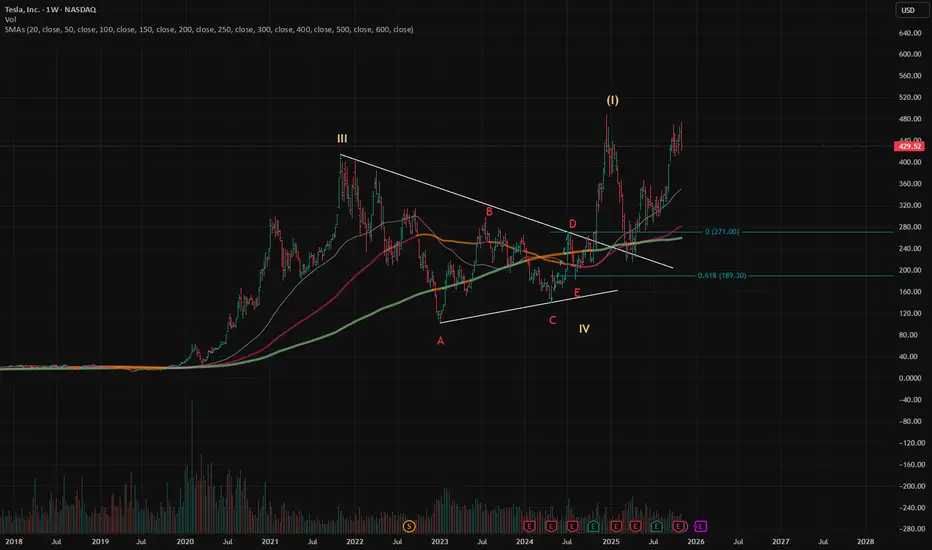
$TSLA: Weekly BullishNASDAQ:TSLA Weekly: I consider TSLA to have completed Wave III. Triangles are more likely to appear in Wave IV. We are in an extending Wave V.
Wave (I) of V has completed. Wave (II) appears to be a very sharp zigzag.
THE WEEK AHEAD FOR MARKETS (11.9.2025)In this video going over my watchlist of individual stock names
Also forgot to mention in addition to buying Shopify this week, I may be looking at small buys for AMD & potentially NVDA in the coming weeks ahead

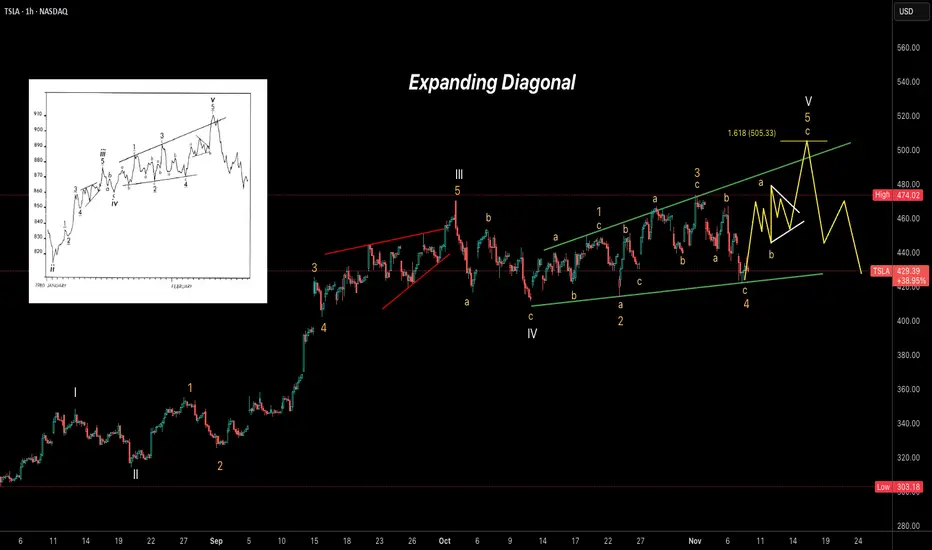
TSLA – Expanding Diagonal in Progress Tesla (TSLA) appears to be forming an Expanding Ending Diagonal pattern on the 1-hour chart, suggesting the final stages of a larger impulsive structure. Wave (V) seems to be unfolding with internal subdivisions visible, possibly targeting the 1.618 Fibonacci extension near 505 before a sharp reversal.
Key observations:
Structure resembles a textbook expanding diagonal (5-3-5-3-5).
Wave 4 found support near the lower trendline.
Wave 5 projection aims toward the 500–505 area.
Expecting a potential pullback or reversal once the diagonal completes.
TSLA is giving mixed signals. Range low next move?I must say I have a very dualistic view on TSLA here. I think there is certainly a possibility of this becoming a prolonged consolidation with another move towards the downside of the range. On the other hand, that 1.618 extension to the upside als looks like a very valid target. Needless to say, while most people seem to stare blindly at TESLA great promises, I'm a little more skeptical to say the lest.
- Earnings have been going down over the years
- Revenue has stayed somewhat flat, with high odds of continuing to decline in China
- First their cars were going to change the world, then it was their energy solutions, then FSD became the narrative (Once done, FSD would instantly scale to worldwide usage and work everywhere, but currently their taxi service that would expand rapidly is geofenced), now Optimus is the narrative.
Elon is holding a carrot
- My point is: Elon is holding a carrot in front of us. I'm not saying Tesla is not doing great things. Their progress on FSD is real. But unless they will actually start to deliver real revenue and real profit, it will continue to be hyped up promises.
- For example, the EPS of XETR:VOW is 13x higher than Tesla's. Current Price to Earnings ratio for Tesla is at 300x.
So is it that weird to find that TA is giving mixed signals and possibly pointing towards range low?
Simple outlook
Anyway, this is my plan:
- I'll assume we are going up for 1.618 UNLESS
- We deviate back below previous ATH level. Then I think odds are starting to shift in favor of a bigger downward move.
TSLA 3-Drive & ABCD Pattern – Path to $500 Before a PullbackThis chart highlights multiple harmonic and Elliott structures aligning for a potential bullish extension in Tesla (TSLA). A well-defined ABCD pattern and 3-Drive pattern suggest momentum building toward the $500 zone, supported by Fibonacci projections and channel resistance.
The current wave structure points to an imminent 5-wave advance, likely completing the “Drive 3” and pattern D confluence area near $500–505. Following that move, a corrective pullback (ABC) is anticipated, possibly retesting prior support near $440–400.
Key elements featured:
ABCD completion zone: around $500
3-Drive pattern: confirming exhaustion at upper trendline
Elliott 5-wave projection: short-term bullish continuation
Possible corrective phase: after the final wave up
📈 Watching for confirmation of Wave iii and potential exhaustion signals near $500 before considering downside setups.

1 trillion dollar pay package to elon muskTesla shareholders agreed to pay Elon Musk a package of 1 trillion dollars, and that's 12% of total gains if he reached his promised goal to shareholders of making Tesla the most valuable company in the world, and it stays that way for 5 years. If Musk delivers, the stock price should jump to 1000 dollars price per share in 5 years.
PS: If Musk misses the target but a few thousand dollars, he gets nothing. Hence, the current most valuable company is now Nvidia with a 5 billion dollar evaluation, and Tesla is currently worth 1.35 trillion.
TESLA Sellers In Panic! BUY!
My dear subscribers,
My technical analysis for TESLA is below:
The price is coiling around a solid key level - 429.39
Bias - Bullish
Technical Indicators: Pivot Points Low anticipates a potential price reversal.
Super trend shows a clear buy, giving a perfect indicators' convergence.
Goal - 446.44
About Used Indicators:
By the very nature of the supertrend indicator, it offers firm support and resistance levels for traders to enter and exit trades. Additionally, it also provides signals for setting stop losses
Disclosure: I am part of Trade Nation's Influencer program and receive a monthly fee for using their TradingView charts in my analysis.
———————————
WISH YOU ALL LUCK

$TSLA - Reaching $1050 in 2026 is NOT a Dream!I can't ignore how bullish Tesla stocks chart looks right now. A massive ascending triangle with horizontal resistance ($430) was broken upwards and currently the price is consolidating above it, the resistance also perfectly correlates with the 0.786 lvl by Fibo.
Taking into account the overall company's plan regarding its growth (talking about recent news that 75% of shareholders voted in favour of a compensation plan that could award Musk up to $1T in stock if Tesla could achieve $8.5T market capitalization) , we can easily expect NASDAQ:TSLA to reach point 1 by Fibo ($1050 mark) .
By the way, by pointing out to the news about providing $1T, I don't mean that Tesla could really achieve $8.5T market capitalization any time soon, if only in 10 years as the overall money supply is drastically increasing. This news highlights the plan, in other words - creative way of sharing what is their "plan maximum" in terms of 10 years.
I believe Tesla will cost $2T in 2026.

Tesla at a Breakout Crossroad
The Tesla (TSLA) daily chart shows a classic Cup & Handle pattern nearing a critical resistance zone. The key level sits around $450, aligning with a long-term descending trendline (in blue).
Technical Overview:
General Trend:
Since early 2025, TSLA has been in a steady uptrend.
The 50-day moving average (SMA 50) near $220 acts as strong dynamic support and is still trending upward.
The structure indicates Tesla is finishing the “handle” phase of the pattern — a decisive moment is approaching.
Bullish Scenario:
If the price breaks and holds above $450 with strong volume, it would confirm the Cup & Handle breakout.
Potential upside targets:
Short-term target: $503
Mid to long-term target: $565 (based on cup depth projection)
Stop loss: Below $410
A breakout above $450 could trigger a strong continuation rally as investors re-enter on technical confirmation.
Bearish Scenario:
Failure to break above $450 and a drop below $410 could invalidate the bullish setup, leading to a deeper correction.
Potential downside targets:
Short-term target: $375
Long-term target: $320
Stop loss: A confirmed close back above $445
This would suggest that the handle failed, and selling pressure could accelerate toward lower supports.
Timeframe Summary:
Short-term (1–3 weeks):
Expect consolidation between $410–$450, with bias toward a breakout if the tech sector remains strong.
Long-term (3–6 months):
A confirmed breakout above $450 opens the path toward $565.
If rejected, expect a correction toward $375, possibly forming a new accumulation base.

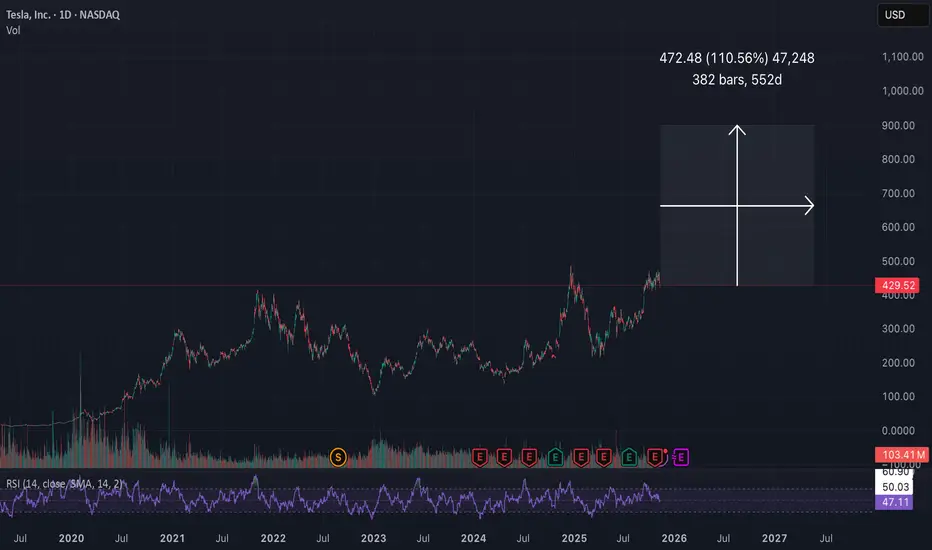
Last Tesla (Macro) chart before ATHATH NEXT!
If I'm wrong, then I have "strict invalidations" with minimal loses...because of "proper risk management".
If I'm right then I'm taking an extended vacation.
May the trends be with you.
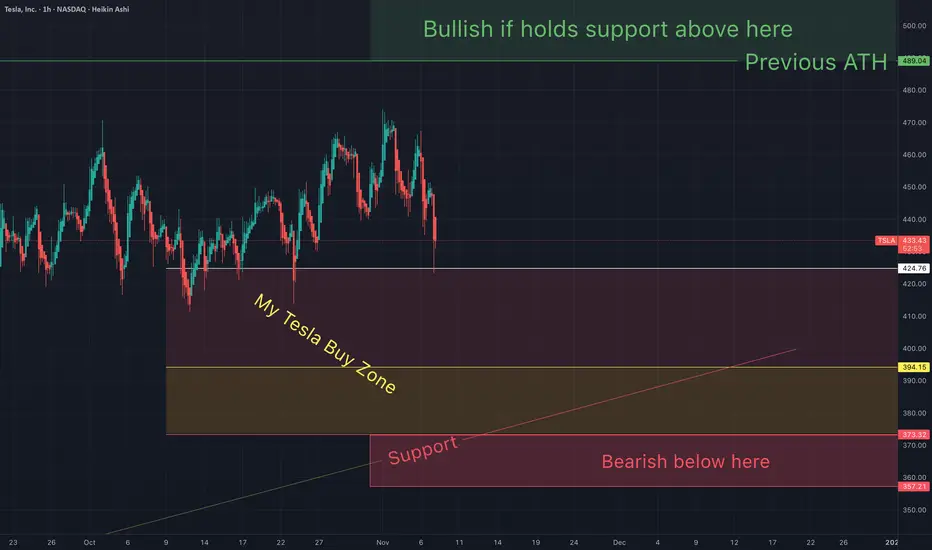
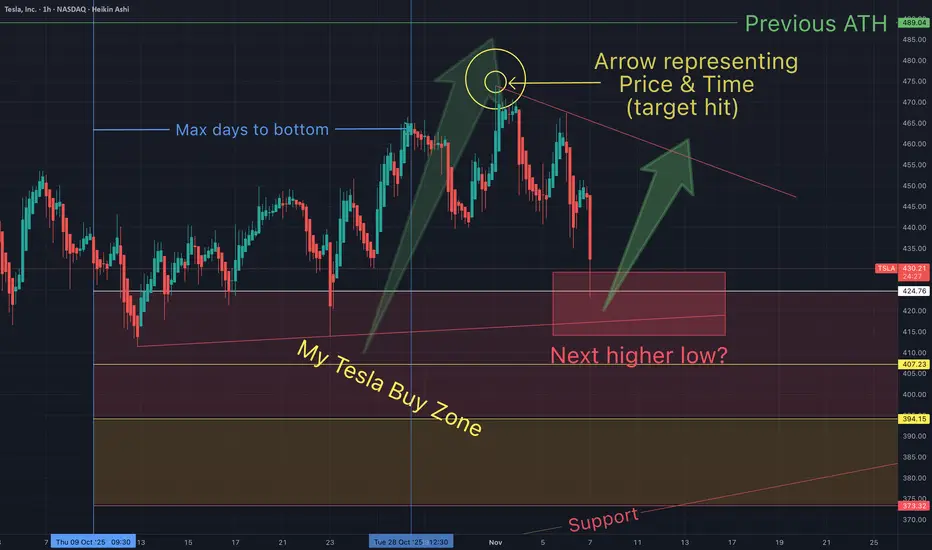
My Last Tesla post before ALL TIME HIGHOn Oct 21st I said I was adding to my positions (price at the time below):
Some of my target hit. We may even go lower.
What do you think?
TSLA CCREALLY GOOD premium and volatility here.... wow. Pay package means
Buy low, sell high. It's at a high spot right now.

Tsla weekly chartI think it's time to sell tsla
We got a bad signal down trend candlestick & down trend RSI
GOOD LUCK 4ALL

TSLA QuantSignals V3 Weekly 2025-11-07TSLA QuantSignals V3 Weekly 2025-11-07
TSLA Weekly Signal | 2025-11-07
• Direction: NEUTRAL | Confidence: 55%
• Expiry: 2025-11-14 (8 days)
• Strike Focus: $400.00
• Entry Range: $4.07
• Target 1: $6.07
• Stop Loss: $2.43
• Weekly Momentum: BULLISH (+2.18% 1W)
• Flow Intel: Bearish (High P/C Ratio) | PCR 3.24
• Max Pain: $452.50 (-0.1% vs spot)
• 🔴 HIGH RISK WARNING: Use only small position size due to lower confidence and high uncertainty.
⚖️ Compliance: Educational commentary for QS Premium members only. No financial advice.
🎯 TRADE RECOMMENDATION
Direction: BUY PUTS
Confidence: 55%
Conviction Level: LOW
🧠 ANALYSIS SUMMARY
Katy AI Signal: NEUTRAL (50% confidence) with bearish bias - Target $445.95 (-1.5% downside), Stop Loss $459.69 (+1.5% upside)
Technical Analysis: Current price $452.90 trading near weekly range midpoint (62.0%). MACD momentum bullish but mixed timeframe signals. Strong trending regime (100% strength) supports swing trades. Key resistance at $474.07, support at $435.09.
News Sentiment: Mixed - Roadster reveal and Robotaxi expansion (bullish) offset by Musk pay package criticism and political headwinds. News flow suggests cautious sentiment.
Options Flow: Extremely bearish - Put/Call Ratio 3.24 indicates heavy institutional put buying. Max pain at $452.50 (-0.1% from spot), high volume at $468 put. Flow suggests downside protection.
Risk Level: MODERATE - Conflicting signals require careful risk management. Neutral AI confidence limits upside conviction.
💰 TRADE SETUP
Expiry Date: 2025-11-14 (8 days)
Recommended Strike: $400.00
Entry Price: $4.05 - $4.10
Target 1: $6.07 (50% gain from entry)
Target 2: $8.10 (100% gain from entry)
Stop Loss: $2.43 (40% loss from entry)
Position Size: 2% of portfolio
⚡ COMPETITIVE EDGE
Why This Trade: Bearish options flow (PCR 3.24) provides contrarian edge against mixed technicals. Max pain align
Image
QS Analyst
APP
— 10:49 PM
ment near current price creates favorable gamma positioning.
Timing Advantage: Thursday positioning with 8 days to expiry allows for volatility capture during weekly momentum confirmation.
Risk Mitigation: Conservative delta (-0.138) provides defined risk exposure. Stop loss at 40% protects capital in neutral environment.
🚨 IMPORTANT NOTES
Katy AI's neutral confidence (50%) limits directional conviction - treat as speculative trade
Conflicting signals between bullish MACD and bearish flow require careful monitoring
Position size should remain minimal given low conviction level
Be prepared to exit early if technicals flip bullish or options flow reverses
📊 TRADE DETAILS 📊
🎯 Instrument: TSLA
🔀 Direction: PUT (SHORT)
🎯 Strike: 400.00
💵 Entry Price: 4.07
🎯 Profit Target: 6.07
🛑 Stop Loss: 2.43
📅 Expiry: 2025-11-14
📏 Size: 2.0
📈 Confidence: 55%
⏰ Entry Timing: N/A
🕒 Signal Time: 2025-11-07 01:49:31 EST
🔴 HIGH RISK WARNING: Use only small position size due to lower confidence and high uncertainty.

News Momentum QuantSignals AI Screener 2025-11-06News Momentum QuantSignals AI Screener 2025-11-06
🎯 NEWS-DRIVEN MOMENTUM DETECTED
AI News Analysis Results
════════════════════════════════════════════════════════════════════════════════
💰 NEWS MOMENTUM SIGNALS
Generated: November 06, 2025 at 10:45 PM
════════════════════════════════════════════════════════════════════════════════
📊 5 Total Opportunities • ✅ 5 Ready to Trade • ⏸️ 0 Monitor
────────────────────────────────────────────────────────────────────────────────
┌─ #1 ✅ NYSE:JNJ • Score: 75/100 • ENTER NOW
│
│ 📅 DTE: 42 days
│ 🟢 Risk Level: Low Risk (2/10)
│
│ 📰 Catalyst: High-impact FDA approval for DARZALEX FASPRO, creating immediate revenue potential
│ 📊 Setup: Stock consolidating near $187 with regulatory catalyst providing breakout fuel
│ 🎯 Target: $195-200 within 2-3 weeks following approval momentum
│ 📈 Options: $190 CALL exp 2025-12-19
│
│ 💡 Trade - High conviction setup
│ ⚠️ Risk: Broad market weakness or unexpected regulatory hurdles for new drug adoption
└───────────────────────────────────────────────────────────────────────────────
┌─ #2 ✅ NASDAQ:AVGO • Score: 70/100 • ENTER NOW
│
│ 📅 DTE: 28 days
│ 🟡 Risk Level: Medium Risk (4/10)
│
│ 📰 Catalyst: Strong analyst bullishness on AI-driven growth prospects from Mizuho
│ 📊 Setup: At key $357 support level with institutional accumulation evident
│ 🎯 Target: $375-385 within 10-14 days on AI momentum continuation
│ 📈 Options: $360 CALL exp 2025-12-05
│
│ 💡 Trade - High conviction setup
│ ⚠️ Risk: AI sentiment shift or broader semiconductor sector rotation
└───────────────────────────────────────────────────────────────────────────────
┌─ #3 ✅ NYSE:TSM • Score: 65/100 • ENTER NOW
│
│ 📅 DTE: 35 days
│ 🟡 Risk Level: Medium Risk (4/10)
│
│ 📰 Catalyst: Needham Buy rating with N3 capacity boost accelerating revenue growth
│ 📊 Setup: Testing $290 resistance with positive analyst momentum
Image
building
│ 🎯 Target: $305-310 within 3-4 weeks on capacity expansion news flow
│ 📈 Options: $295 CALL exp 2025-12-12
│
│ 💡 Trade - Monitor entry timing
│ ⚠️ Risk: Geopolitical Taiwan tensions or semiconductor demand slowdown
└───────────────────────────────────────────────────────────────────────────────
┌─ #4 ✅ NYSE:XOM • Score: 60/100 • ENTER NOW
│
│ 📅 DTE: 21 days
│ 🟡 Risk Level: Medium Risk (6/10)
│
│ 📰 Catalyst: Dividend hike and record output milestones despite recent earnings pressure
│ 📊 Setup: Oversold at $114 after earnings sell-off, dividend catalyst provides support
│ 🎯 Target: $120-122 within 2 weeks on dividend attraction and output momentum
│ 📈 Options: $117.50 CALL exp 2025-11-28
│
│ 💡 Trade - Monitor entry timing
│ ⚠️ Risk: Continued oil price weakness overwhelming positive company-specific news
└───────────────────────────────────────────────────────────────────────────────
┌─ #5 ✅ NYSE:BAC • Score: 55/100 • ENTER NOW
│
│ 📅 DTE: 28 days
│ 🔴 Risk Level: High Risk (10/10)
│
│ 📰 Catalyst: Strong analyst pick status with earnings season bank sector rotation potential
│ 📊 Setup: Neutral at $53 but positioned for financial sector leadership shift
│ 🎯 Target: $56-57 within 10 days on sector rotation and analyst conviction
│ 📈 Options: $54 CALL exp 2025-12-05
│
│ 💡 Trade - Monitor entry timing
│ ⚠️ Risk: Interest rate uncertainty or broader financial sector weakness
└───────────────────────────────────────────────────────────────────────────────
────────────────────────────────────────────────────────────────────────────────
📖 QUICK GUIDE:
✅ ENTER NOW → High probability setup, optimal timing, low-medium risk
⏸️ WAIT → Monitor for better entry or catalyst resolution
🟢 Low Risk → Heat 1-3 (stable, far from catalysts)
🟡 Med Risk → Heat 4-6 (moderate volatility)
🔴 High Risk → Heat 7-10 (near catalysts, high volatility)
💎 Position Sizing: 2-5% per trade • Max 2-3 concurrent positions
🎯 Exit Strategy: Take profit at 50%
max gain or stop at 2x loss
════════════════════════════════════════════════════════════════════════════════

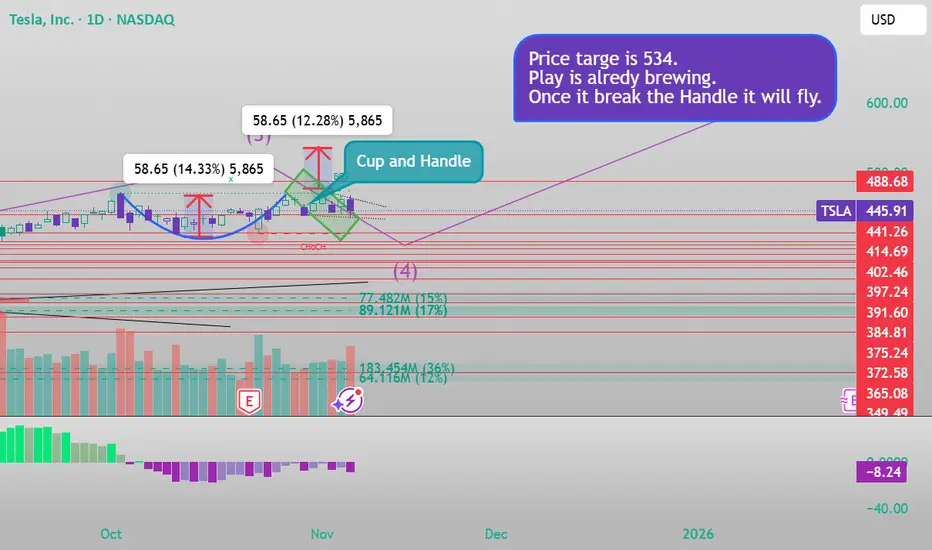
Cup and handleYou can see the cup and Handle in the Daily timeframe. It Will fly soon. My price target is 534 once it break the handle. You see this here at first.
X
@Sandeep194924
Tesla / Palantir Fractal STILL playing out STRANGELY ACCURATEMillions of people
...buying Trillions of dollars of assets
...at random times
...on random days
but somehow these 2 assets move together on the x-axis & the y-axis??
Cansomeone explain this to me mathematically?
May the Truth be with you.
