This analysis is an update of the analysis you see in the "Related publications" section
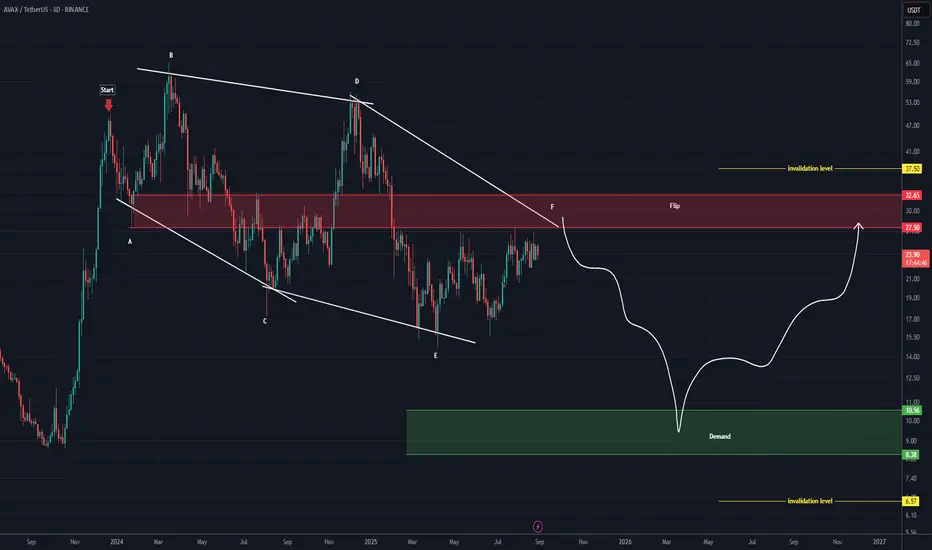
Before anything else, pay attention to the timeframe: it’s the 3-day timeframe.
The structure that AVAX is following is a large diametric, where wave F of this diametric is expected to end within the red-marked zone. After that, the price is anticipated to enter the bearish G wave.
Wave G could extend down to the main order block, which is the green-marked zone.
For both the bearish and bullish scenarios, the invalidation levels are marked on the chart. A daily candle closing above or below these levels will invalidate the respective outlook.
For risk management, please don't forget stop loss and capital management
Comment if you have any questions
Thank You
💎Join our Telegram channel for real-time crypto insights 👉 t.me/Behdark_EN
where traders can receive up to 30% of their trading fees back. More details: whitebit.com/m/cashback-fees-tradingview?affiliate=tradingviewcashback
where traders can receive up to 30% of their trading fees back. More details: whitebit.com/m/cashback-fees-tradingview?affiliate=tradingviewcashback
منشورات ذات صلة
إخلاء المسؤولية
لا يُقصد بالمعلومات والمنشورات أن تكون، أو تشكل، أي نصيحة مالية أو استثمارية أو تجارية أو أنواع أخرى من النصائح أو التوصيات المقدمة أو المعتمدة من TradingView. اقرأ المزيد في شروط الاستخدام.