Bank Nifty Technical Analysis for May 26–30, 2025
# Current Market Context
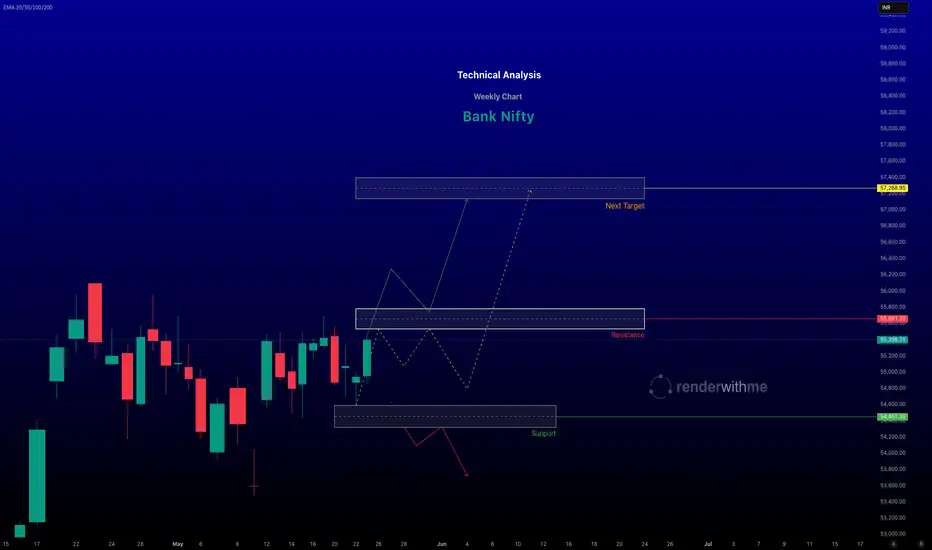
Recent Performance: As of May 23, 2025, the Bank Nifty index closed at approximately 55,389, up 456.94 points in the prior session, reflecting bullish momentum. The index is trading within a broken descending channel, indicating potential for further upside if key levels are sustained.
Market Sentiment: I suggest a neutral to bullish bias, with some analysts expecting a breakout above 55,900 or a move toward 56,500–57,500 in the near term. However, signs of distribution and weak open interest (OI) build-up indicate caution, as momentum may stall if support levels break.
#Key Technical Levels
- Support Levels:
Immediate support lies at 54,800–54,850, coinciding with the 20-day EMA zone. A break below 54,850 could trigger selling pressure, with further support at 54,700, 54,450, and 54,250.
Weekly pivot support is noted at 54,600, with a stronger support at 54,300 if a deeper correction occurs.
- Resistance Levels:
Immediate resistance is at 55,520 - 55,700 . A sustained break above this could lead to short covering and targets of 56,000 - 57,500
## Disclaimer
- This analysis is based on recent technical data and market sentiment from web sources. It is for informational purposes only and not financial advice. Trading involves high risks, and past performance does not guarantee future results. Always conduct your own research or consult a SEBI-registered advisor before trading.
# Current Market Context
Recent Performance: As of May 23, 2025, the Bank Nifty index closed at approximately 55,389, up 456.94 points in the prior session, reflecting bullish momentum. The index is trading within a broken descending channel, indicating potential for further upside if key levels are sustained.
Market Sentiment: I suggest a neutral to bullish bias, with some analysts expecting a breakout above 55,900 or a move toward 56,500–57,500 in the near term. However, signs of distribution and weak open interest (OI) build-up indicate caution, as momentum may stall if support levels break.
#Key Technical Levels
- Support Levels:
Immediate support lies at 54,800–54,850, coinciding with the 20-day EMA zone. A break below 54,850 could trigger selling pressure, with further support at 54,700, 54,450, and 54,250.
Weekly pivot support is noted at 54,600, with a stronger support at 54,300 if a deeper correction occurs.
- Resistance Levels:
Immediate resistance is at 55,520 - 55,700 . A sustained break above this could lead to short covering and targets of 56,000 - 57,500
## Disclaimer
- This analysis is based on recent technical data and market sentiment from web sources. It is for informational purposes only and not financial advice. Trading involves high risks, and past performance does not guarantee future results. Always conduct your own research or consult a SEBI-registered advisor before trading.
renderwithme
منشورات ذات صلة
إخلاء المسؤولية
The information and publications are not meant to be, and do not constitute, financial, investment, trading, or other types of advice or recommendations supplied or endorsed by TradingView. Read more in the Terms of Use.
renderwithme
منشورات ذات صلة
إخلاء المسؤولية
The information and publications are not meant to be, and do not constitute, financial, investment, trading, or other types of advice or recommendations supplied or endorsed by TradingView. Read more in the Terms of Use.